[fusion_builder_container hundred_percent=”no” equal_height_columns=”no” menu_anchor=”” hide_on_mobile=”small-visibility,medium-visibility,large-visibility” class=”” id=”” background_color=”” background_image=”” background_position=”center center” background_repeat=”no-repeat” fade=”no” background_parallax=”none” parallax_speed=”0.3″ video_mp4=”” video_webm=”” video_ogv=”” video_url=”” video_aspect_ratio=”16:9″ video_loop=”yes” video_mute=”yes” overlay_color=”” video_preview_image=”” border_size=”” border_color=”” border_style=”solid” padding_top=”” padding_bottom=”” padding_left=”” padding_right=””][fusion_builder_row][fusion_builder_column type=”1_6″ spacing=”” center_content=”no” link=”” target=”_self” min_height=”” hide_on_mobile=”small-visibility,medium-visibility,large-visibility” class=”” id=”” hover_type=”none” border_size=”0″ border_color=”” border_style=”solid” border_position=”all” border_radius=”” box_shadow=”no” dimension_box_shadow=”” box_shadow_blur=”0″ box_shadow_spread=”0″ box_shadow_color=”” box_shadow_style=”” padding_top=”” padding_right=”” padding_bottom=”” padding_left=”” margin_top=”” margin_bottom=”” background_type=”single” gradient_start_color=”” gradient_end_color=”” gradient_start_position=”0″ gradient_end_position=”100″ gradient_type=”linear” radial_direction=”center” linear_angle=”180″ background_color=”” background_image=”” background_image_id=”” background_position=”left top” background_repeat=”no-repeat” background_blend_mode=”none” animation_type=”” animation_direction=”left” animation_speed=”0.3″ animation_offset=”” filter_type=”regular” filter_hue=”0″ filter_saturation=”100″ filter_brightness=”100″ filter_contrast=”100″ filter_invert=”0″ filter_sepia=”0″ filter_opacity=”100″ filter_blur=”0″ filter_hue_hover=”0″ filter_saturation_hover=”100″ filter_brightness_hover=”100″ filter_contrast_hover=”100″ filter_invert_hover=”0″ filter_sepia_hover=”0″ filter_opacity_hover=”100″ filter_blur_hover=”0″ last=”no”][/fusion_builder_column][fusion_builder_column type=”2_3″ layout=”1_1″ background_position=”left top” background_color=”” border_size=”” border_color=”” border_style=”solid” border_position=”all” spacing=”yes” background_image=”” background_repeat=”no-repeat” padding_top=”” padding_right=”” padding_bottom=”” padding_left=”” margin_top=”0px” margin_bottom=”0px” class=”” id=”” animation_type=”” animation_speed=”0.3″ animation_direction=”left” hide_on_mobile=”small-visibility,medium-visibility,large-visibility” center_content=”no” last=”no” min_height=”” hover_type=”none” link=””][fusion_text columns=”” column_min_width=”” column_spacing=”” rule_style=”default” rule_size=”” rule_color=”” hide_on_mobile=”small-visibility,medium-visibility,large-visibility” class=”” id=”” animation_type=”” animation_direction=”left” animation_speed=”0.3″ animation_offset=””]
U.S. Markets: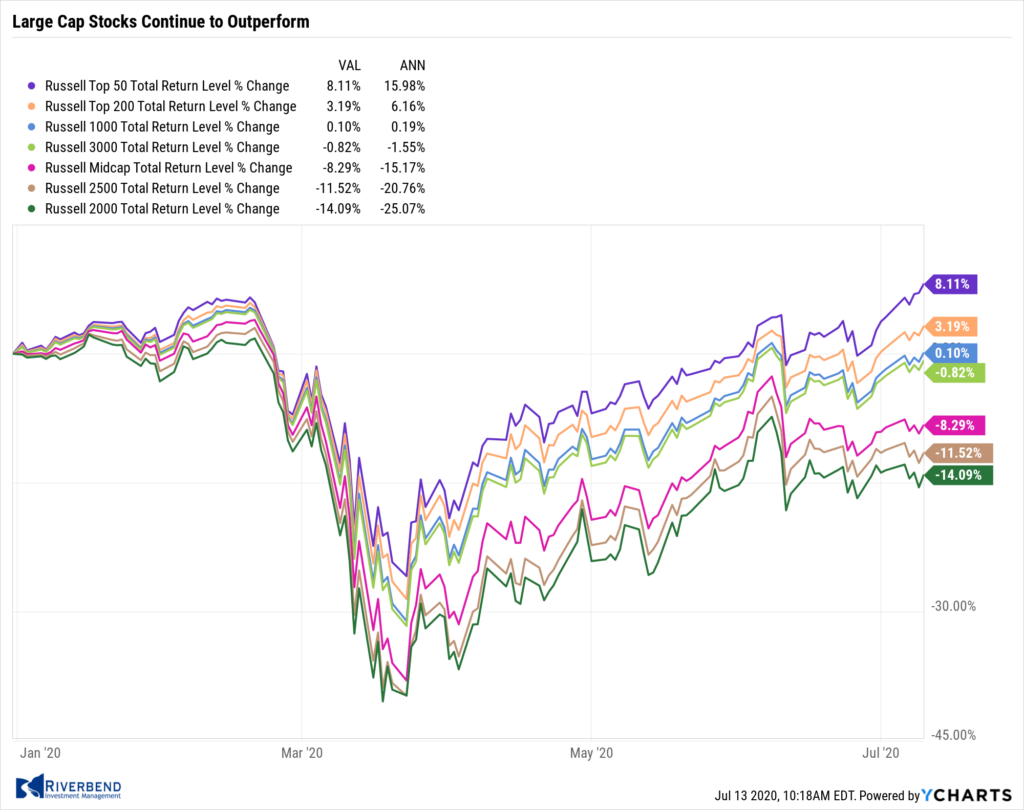
The major U.S. indexes ended the week mixed, with large caps outperforming small caps. The technology-heavy NASDAQ Composite outperformed the other major indexes by rising 4.0% to a new record high of 10,617. The Dow Jones Industrial Average rose 1.0% finishing the week at 26,075.
By market cap, the large cap S&P 500 finished the week up 1.8%, while the mid cap S&P 400 and small cap Russell 2000 retreated -0.3% and -0.6%, respectively.
Despite numerous short bursts of outperformance, small and mid caps have yet to mount a sustained period of outperformance and remain substantially negative for the year to date at -14.7% for the Russell 2000 small cap index and -14.1% for the S&P 400 mid cap index.
International Markets:
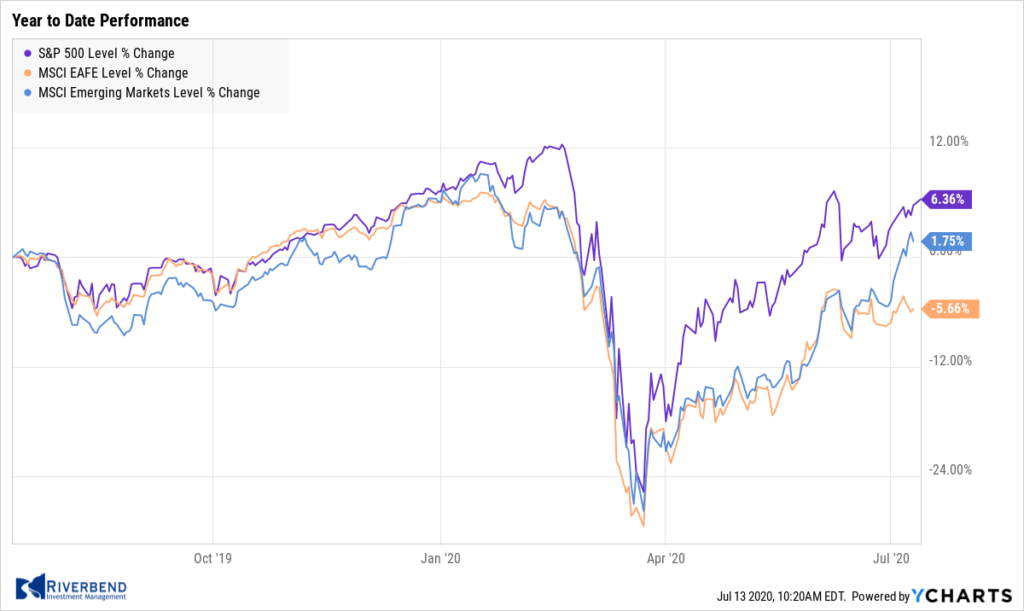
International markets also finished the week mixed. Canada’s TSX finished up 0.8%, while the United Kingdom’s FTSE 100 ended down -1.0%.
On Europe’s mainland, France’s CAC 40 ended down -0.7%, while Germany’s DAX added 0.8% and Italy’s Milan FTSE rose 0.2%. In Asia, China’s Shanghai Composite surged 7.3%, its fourth consecutive week of gains, following a front-page editorial in the China Securities Journal, which stated “fostering a healthy bull market after the pandemic is now more important to the economy than ever.” Japan’s Nikkei ticked down -0.1%.
As grouped by Morgan Stanley Capital International, developed markets finished the week up 0.9% while emerging markets surged 4.5%.
Commodities: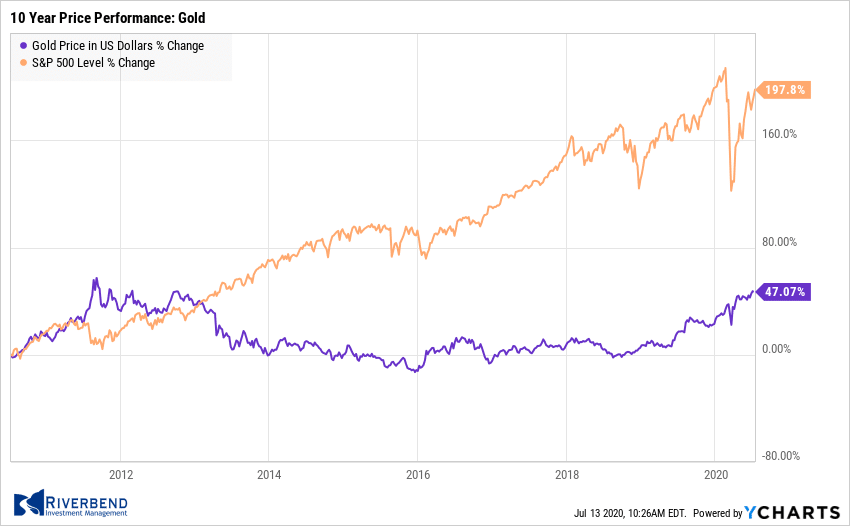
Precious metals continued their run with Gold rising for a fifth consecutive week, up $11.90 to $1801.90 an ounce. Silver finished the week up 4% to $19.05 an ounce.
Oil finished the week down slightly to $40.55 per barrel of West Texas Intermediate crude, a decline of -0.3%.
The industrial metal copper, viewed by some analysts as a barometer of global economic health due to its wide variety of uses, surged 5.4% last week. Copper has now advanced for eight consecutive weeks and has only had three down weeks since bottoming in late March.
U.S. Economic News: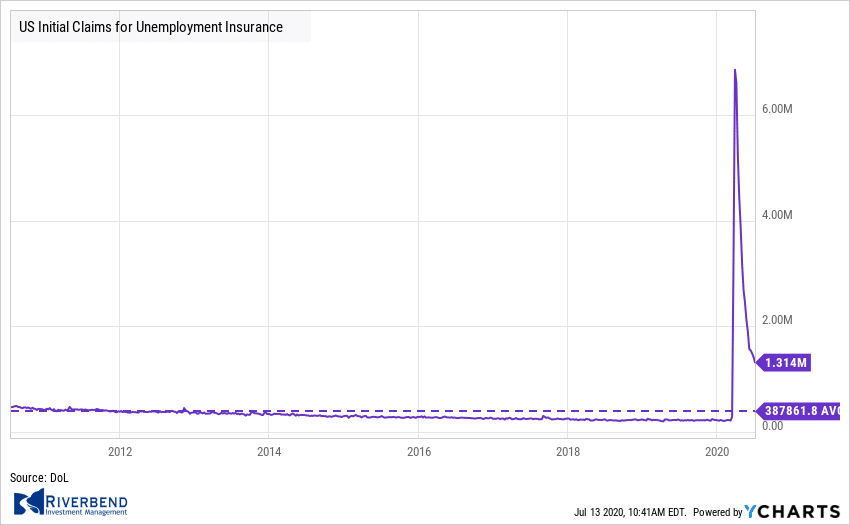
The number of Americans seeking first-time unemployment benefits fell to a four-month low, but layoffs still remain far above their average level at the beginning of the year. The Labor Department reported initial jobless claims fell 99,000 last week to 1.314 million. It was the fourteenth decline in a row. While below the forecast of 1.388 million, claims remain high and more than double the peak reached during the financial crisis of 2008.
Continuing claims, which counts the number of Americans already seeking benefits, fell by 698,000 to 18.062 million. More than 50 million new claims have been filed since mid-March. Before the pandemic the states processed fewer than 225,000 claims a week.
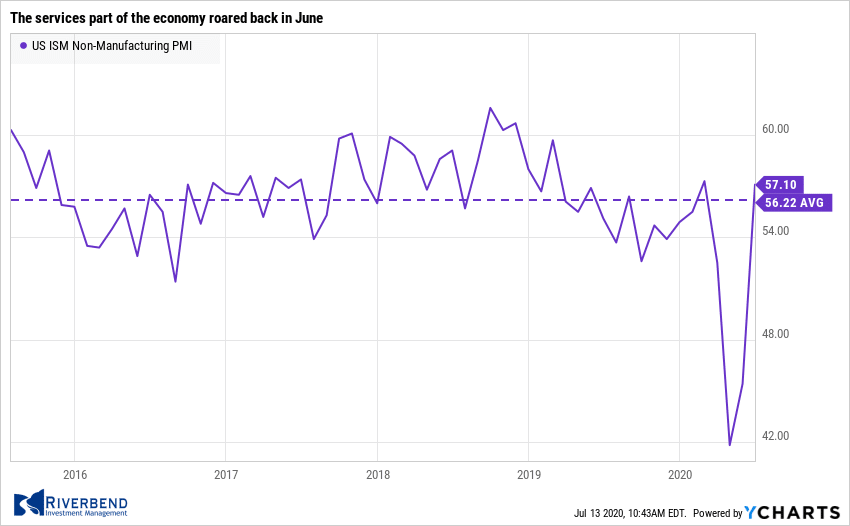
The services part of the economy roared back in June as businesses were allowed to reopen, pointing to a gradual recovery after the extended coronavirus lockdowns. The Institute for Supply Management (ISM) reported its index of non-manufacturing companies surged a record 11.7 points to 57.1—well above the consensus forecast of 50.1.
The index hit its highest level since February, before the shutdown of the economy in response to COVID-19. Analysts noted that the reading confirms economic activity is rebounding, and that the recession that started in February has likely ended.
 Similarly, research firm Markit reported its U.S. Services Purchasing Managers’ Index (PMI) rose 10.4 points in June, to 47.9. Unlike the ISM index it remained below 50, but nonetheless showed significant improvement from just a few months ago. The services side of the U.S. economy is huge, employing more than 80% of all American workers.
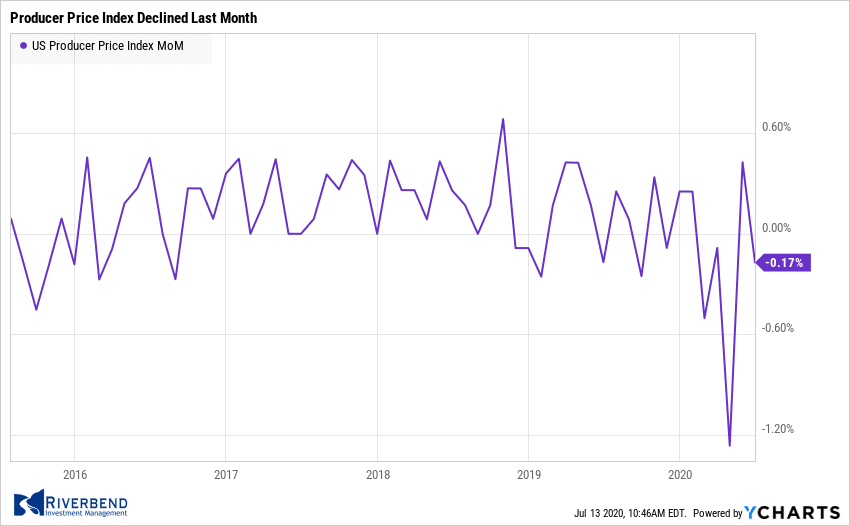
At the wholesale level, the cost of goods and services fell last month, reflecting the depressed demand in retail and other parts of the economy. The Bureau of Labor Statistics reported the Producer Price Index declined -0.2% last month. Economists had expected a 0.4% increase. Wholesale inflation has fallen -0.8% over the past year. In contrast, wholesale inflation was rising at a 1.6% annual pace just a year ago.
Another measure of wholesale inflation known as core PPI, which excludes food, energy, and trade margins, rose 0.3% last month. It was the biggest increase since January. Analysts note that despite the Federal Reserve pumping huge sums of money into the economy, inflation is likely to remain low until the crisis is over. Lydia Boussour and Gregory Daco at Oxford Economics wrote in a research note, “The PPI decline confirms inflation should be the least of our worries.”
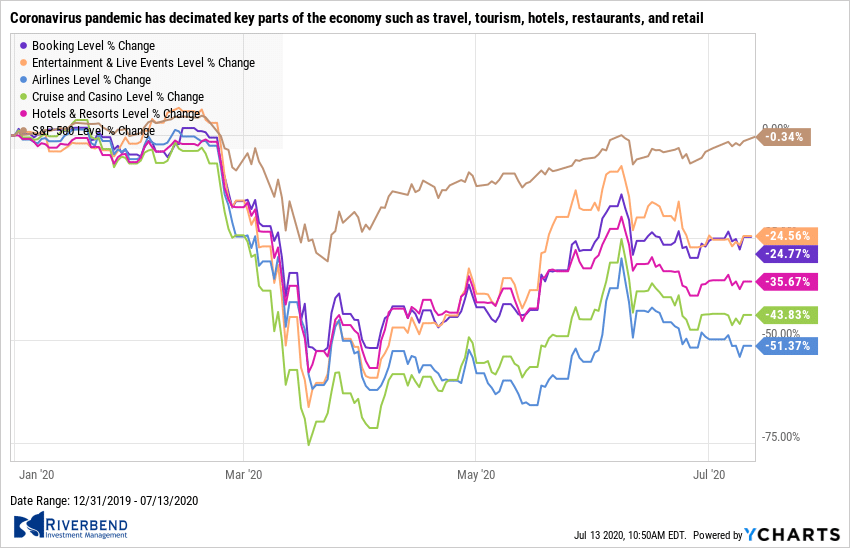 Senior Federal Reserve officials stated unemployment is likely to remain high despite the surge in rehiring and that the central bank may have to do more to help the labor market. San Francisco Fed President Mary Daly noted the coronavirus pandemic has decimated key parts of the economy such as travel, tourism, hotels, restaurants, and retail.
Those industries lost millions of jobs in the early stages of the pandemic, and few have come back so far. In a virtual chat held by the National Association of Business Economists, she stated “I am assuming [unemployment] will level off at someplace we don’t want to be.” Thomas Barkin, president of the Richmond Federal Reserve, concurred. “I don’t believe my favorite restaurant will be back to full staff. I don’t think my favorite retailer will be back to full staff.”
Chart of the Week: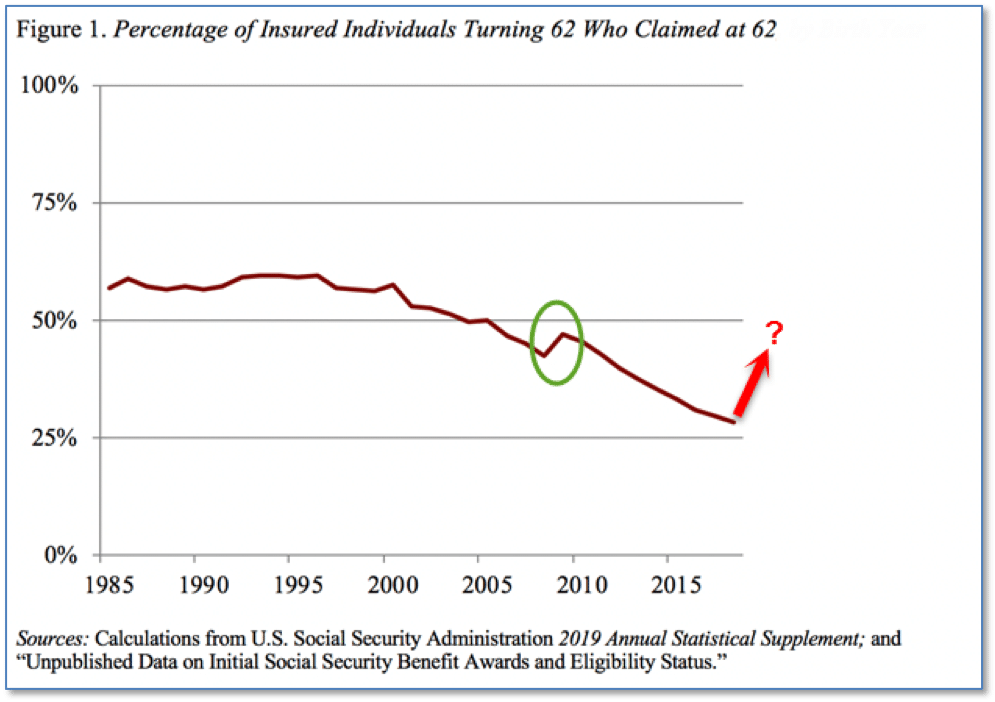
Complications from COVID-19 are known to be more severe in older populations and observers have speculated whether COVID-19 will force or at least encourage older workers to retire as early as they can. Analysts believe the answer is ‘yes’.
For many years, financial advisors have been encouraging pre-retirees to wait as long after age 62 as possible before claiming Social Security benefits, in order to maximize the benefits and extend the wage-earning years. Beginning about the year 2000, a steady decline in the percent of 62 year olds claiming social security benefits began, and has since dropped by about half, from the 60% range to the 30% range.
During the Great Recession, though, the percentage of 62-year-olds claiming Social Security spiked from 42.2% in 2007 to 46.9% in 2009 before again dropping back to the downtrend. Analysts expect this pattern to repeat itself in the wake of COVID-19. In fact, preliminary data from the monthly Current Population Survey shows that an uptick in earliest-possible retirements and social security claims has already begun.
Riverbend Indicators Update:

Each week we post notable changes to the various market indicators we follow.
As a reading of our Bull-Bear Indicator for U.S. Equities (comparative measurements over a rolling one-year timeframe), we remain in Cyclical Bull territory.
Counting-up of the number of all our indicators that are ‘Up’ for U.S. Equities , the current tally is that all four are Positive, representing a multitude of timeframes (two that can be solely days/weeks, or months+ at a time; another, a quarter at a time; and lastly, the {typically} years-long reading, that being the Cyclical Bull or Bear status).
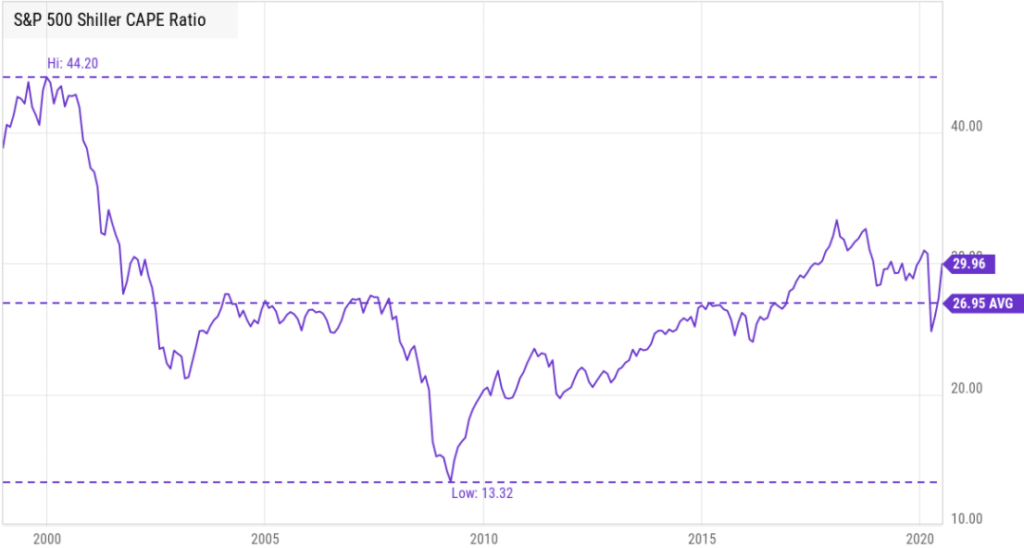
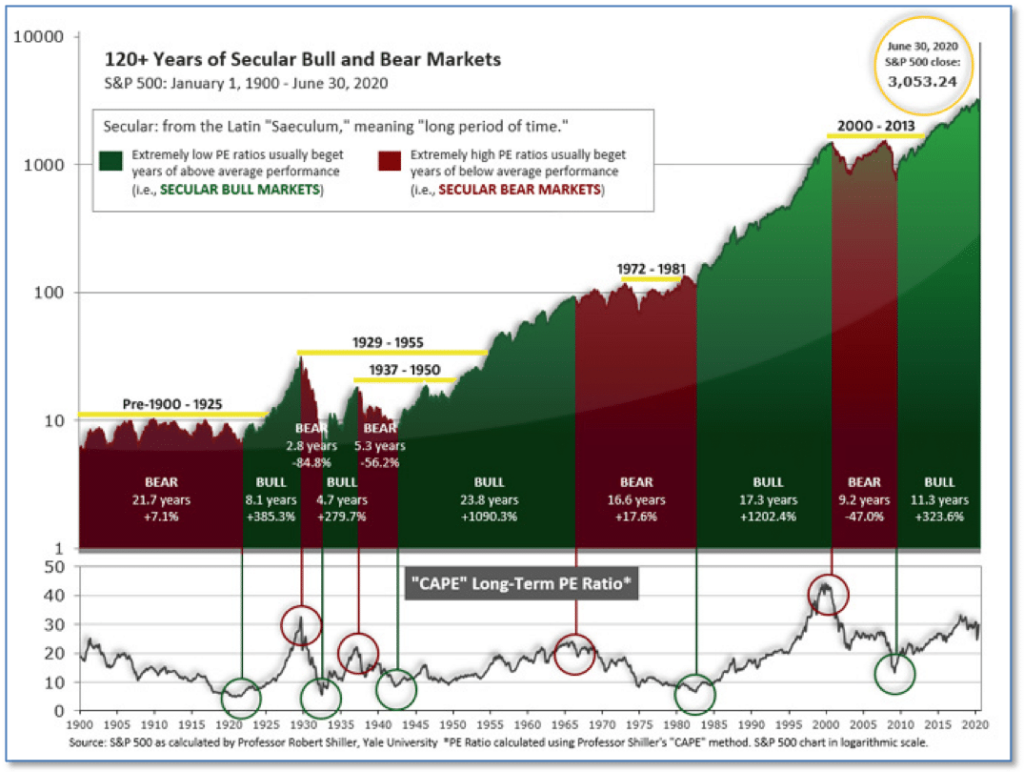 Long Term View – The long-term valuation of the market is commonly measured by the Cyclically Adjusted Price to Earnings ratio, or “CAPE”, which smooths-out shorter-term earnings swings in order to get a longer-term assessment of market valuation.
A CAPE level of 30 is considered to be the upper end of the normal range, and the level at which further PE-ratio expansion comes to a halt (meaning that further increases in market prices only occur as a general response to earnings increases, instead of rising “just because”). The market was recently at that level.
However, historically CAPE valuations can rise much higher. To reach the extreme levels of 2000, the S&P 500 index would need to increase by approximately 50%.
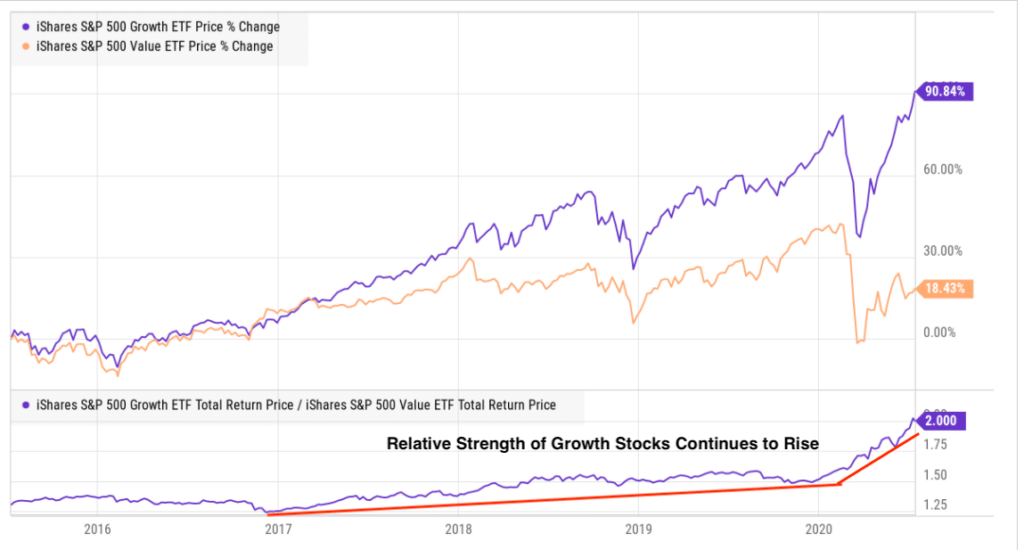
Our models are currently favoring equities with an overweighting in growth names. The relative strength relationship between growth vs value stocks has favored growth names since 2017. Since the March 23rd lows in the US stock market, that relationship has accelerated.
The Week Ahead:
Monday: Chinese Trade Balance USD-Denominated 58.3 bln exp, 62.9 bln prior
Tuesday: German ZEW Economic Sentiment 60.1 exp, 63.4 prior U.S. CPI m/m +0.6% exp,-0.1% prior
Wednesday: U.S. Industrial Production m/m +4.5% exp, +1.4% prior Chinese GDP q/y +2.2% exp, -6.8% prior Chinese Industrial Production y/y +4.4% exp, +4.4% prior
Thursday: U.S. Retail Sales m/m +4.6% exp, +17.7% prior U.S. Philly Fed Manufacturing Index 20.0 exp, 27.5 prior U.S. NAHB Housing Market Index 60 exp, 58 prior
Friday: U.S. Housing Starts 1.17 mln exp, 0.97 mln prior U.S. Building Permits 1.30 mln exp, 1.22 mn prior
[/fusion_text][/fusion_builder_column][/fusion_builder_row][/fusion_builder_container][fusion_builder_container hundred_percent=”no” hundred_percent_height=”no” hundred_percent_height_scroll=”no” hundred_percent_height_center_content=”yes” equal_height_columns=”no” menu_anchor=”” hide_on_mobile=”small-visibility,medium-visibility,large-visibility” status=”published” publish_date=”” class=”” id=”” border_size=”” border_color=”” border_style=”solid” margin_top=”” margin_bottom=”” padding_top=”” padding_right=”” padding_bottom=”” padding_left=”” gradient_start_color=”” gradient_end_color=”” gradient_start_position=”0″ gradient_end_position=”100″ gradient_type=”linear” radial_direction=”center” linear_angle=”180″ background_color=”” background_image=”” background_position=”center center” background_repeat=”no-repeat” fade=”no” background_parallax=”none” enable_mobile=”no” parallax_speed=”0.3″ background_blend_mode=”none” video_mp4=”” video_webm=”” video_ogv=”” video_url=”” video_aspect_ratio=”16:9″ video_loop=”yes” video_mute=”yes” video_preview_image=”” filter_hue=”0″ filter_saturation=”100″ filter_brightness=”100″ filter_contrast=”100″ filter_invert=”0″ filter_sepia=”0″ filter_opacity=”100″ filter_blur=”0″ filter_hue_hover=”0″ filter_saturation_hover=”100″ filter_brightness_hover=”100″ filter_contrast_hover=”100″ filter_invert_hover=”0″ filter_sepia_hover=”0″ filter_opacity_hover=”100″ filter_blur_hover=”0″][fusion_builder_row][/fusion_builder_row][/fusion_builder_container]


