U.S. Markets: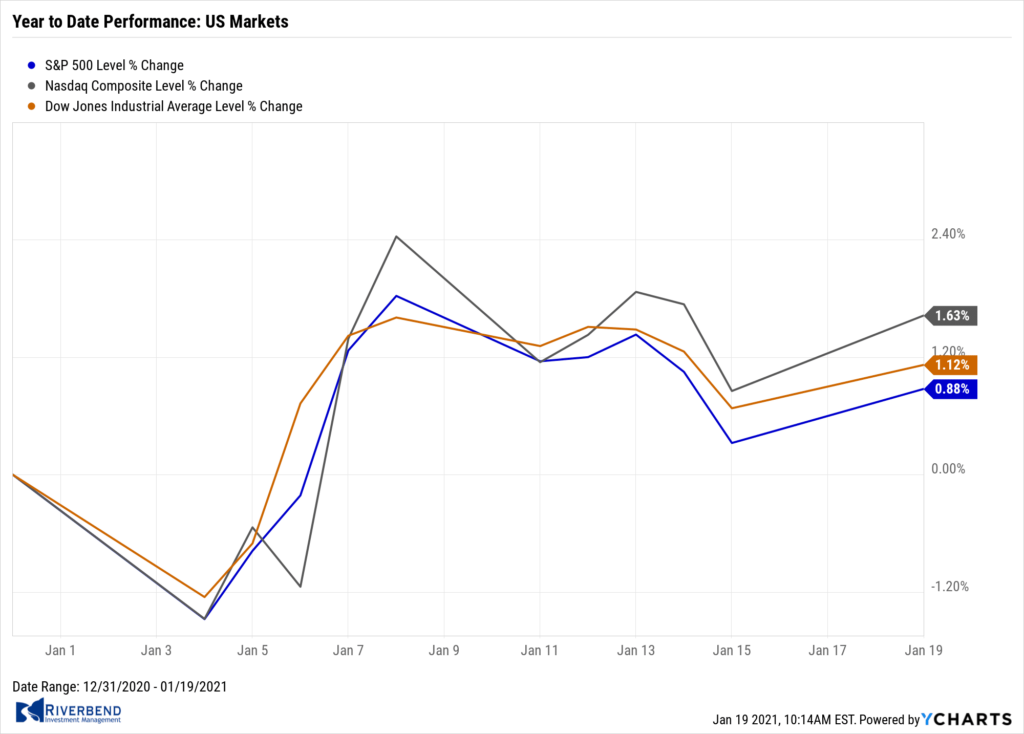
After hitting a fresh record intraday high on Thursday, the major benchmarks finished the week mixed. Energy stocks pulled back sharply at the end of the week but led gains within the S&P 500, helped by a surprisingly large drawdown in domestic oil inventories.
The Dow Jones Industrial Average shed 283 points finishing the week at 30,814, a decline of 0.9%. The technology-heavy NASDAQ Composite fell a steeper -1.5% closing at 12,998.
By market cap, the large cap S&P 500 retreated -1.5%, while the mid cap S&P 400 rose 0.3%, and small caps rallied a market-leading1.8%.
International Markets: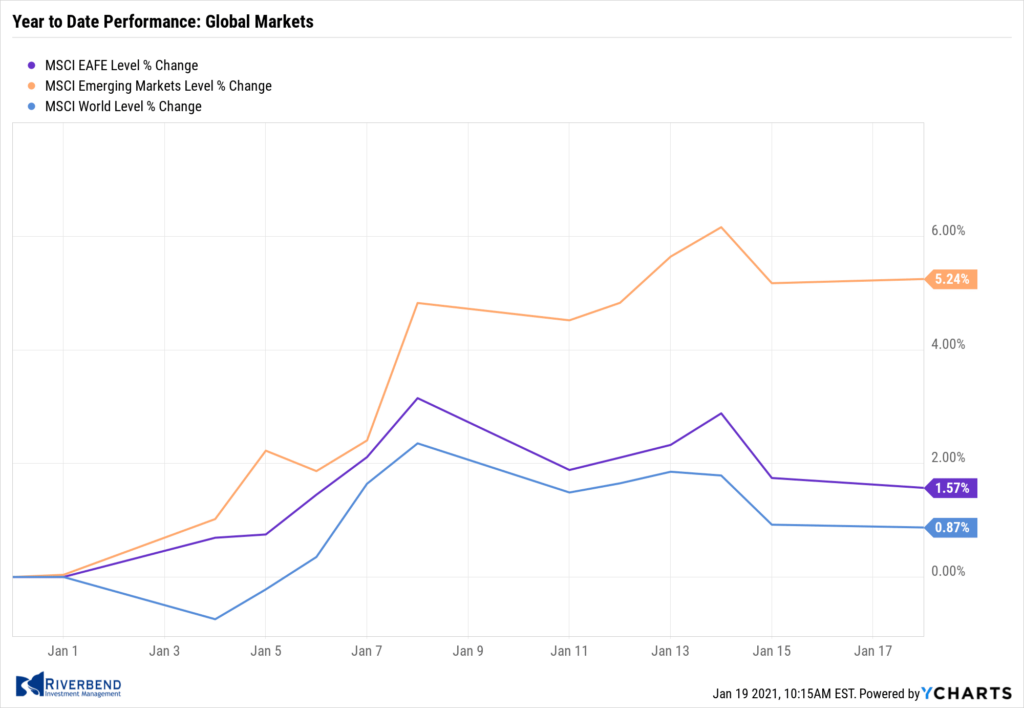
Most international equity markets were down last week. Canada’s TSX retraced -0.7% while the United Kingdom’s FTSE 100 declined -2.0%. France’s CAC 40 and Germany’s DAX retreated -1.7% and -1.9%, respectively.
In Asia, China’s Shanghai Composite ticked down -0.1%, but Japan’s Nikkei closed up for a third consecutive week adding 1.4%.
As grouped by Morgan Stanley Capital International, developed markets gave up -1.8%, while emerging markets retreated -0.7%.
Commodities: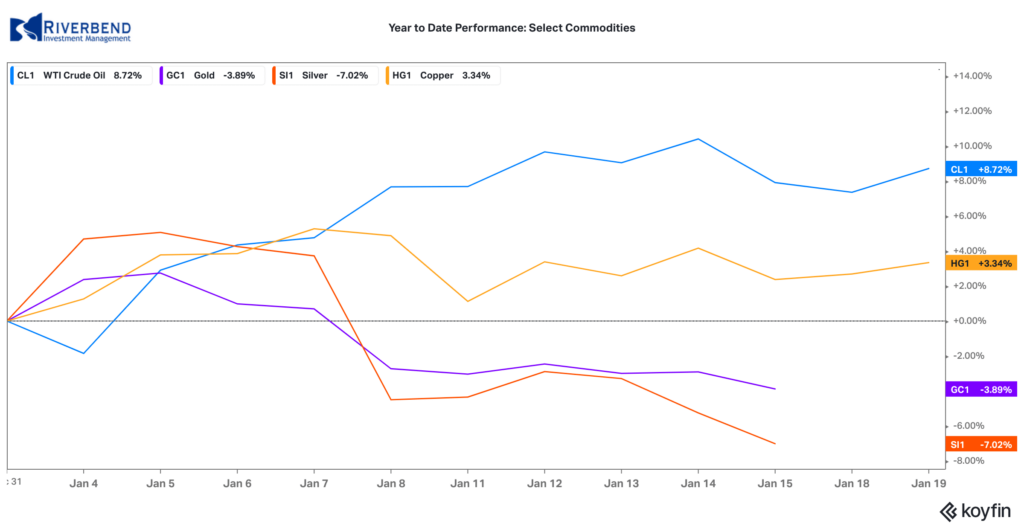
Gold fell for a second week, down -0.3% to $1829.90 per ounce while Silver finished the week up 0.9% to $24.87 per ounce.
Oil rose for a third consecutive week. West Texas Intermediate crude oil finished the week up 0.3% to $52.42 per barrel.
The industrial metal copper, viewed by some analysts as a barometer of global economic health due to its wide variety of uses, finished the week down -2%.
U.S. Economic News: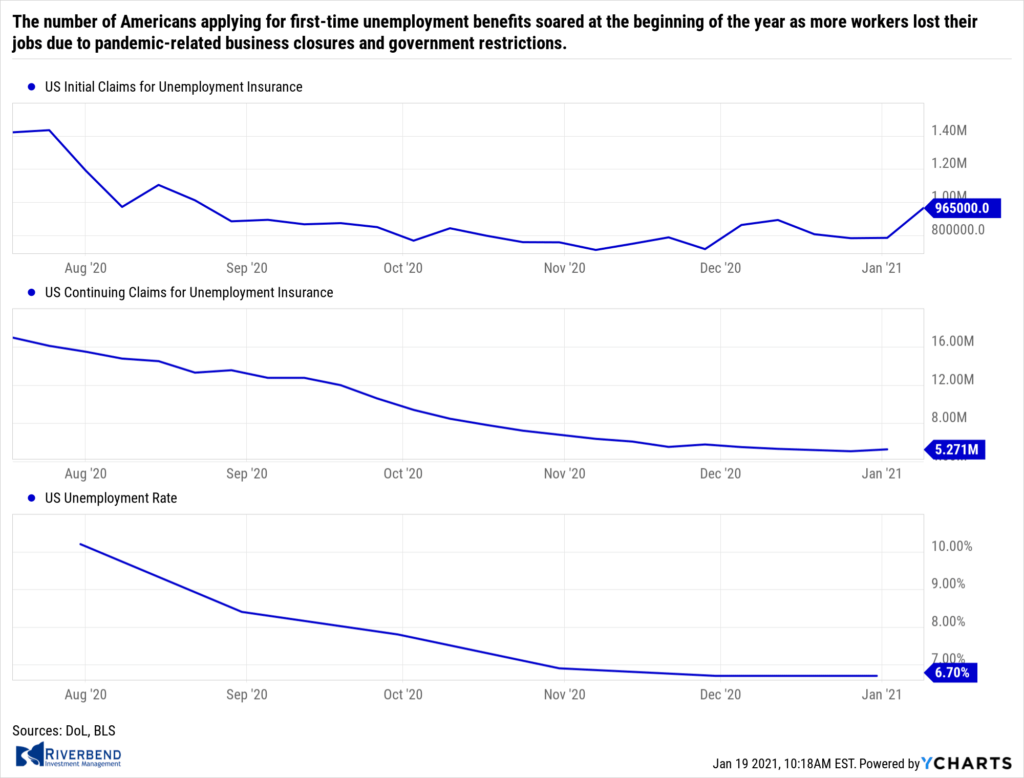
The number of Americans applying for first-time unemployment benefits soared at the beginning of the year as more workers lost their jobs due to pandemic-related business closures and government restrictions. The Labor Department reported initial jobless claims jumped by 181,000 to a seasonally-adjusted 965,000 last week. It was its highest reading since August.
Economists had forecast claims to total 800,000. To put that into perspective, claims had been running in the low 200,000’s before the pandemic took hold in early spring of 2020. Continuing claims, which counts the number of Americans already receiving benefits, rose by 199,000 to 5.271 million. That number is reported with a one-week delay.
The labor market lost momentum in the final months of 2020 as layoffs rose to a five-month high. The Labor Department reported layoffs climbed by almost 300,000 to 1.97 million in November—its highest level since June. At the same time, the number of job openings fell slightly to 6.53 million. Restaurants and hotels were hit the hardest, laying off almost 400,000 employees in November.
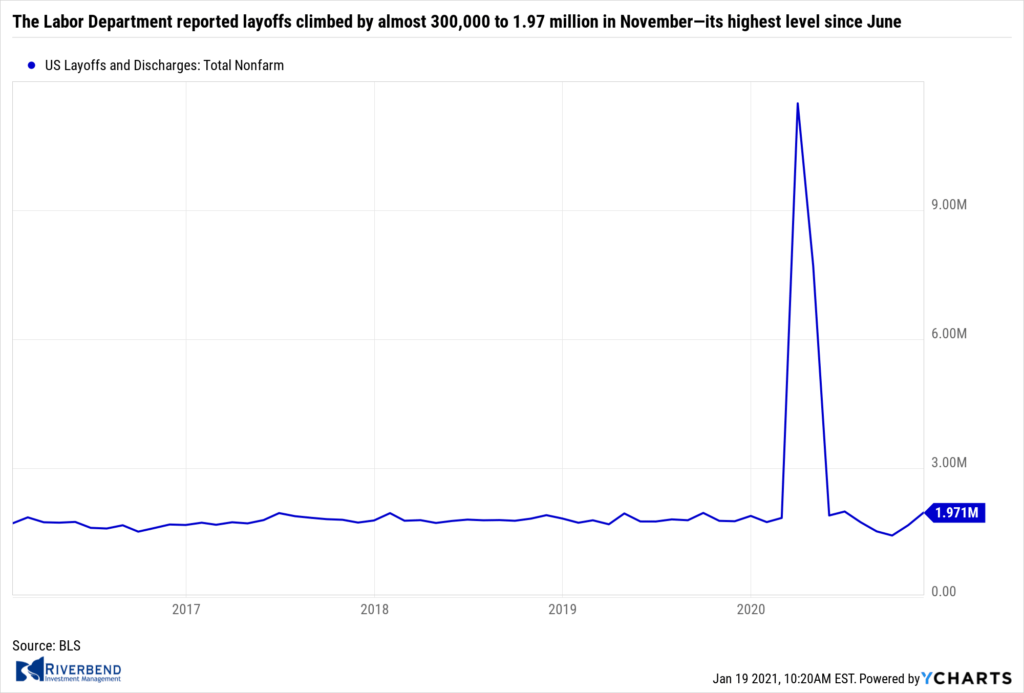 Many states reimposed restrictions on operating hours or the number of customers allowed in stores to combat the spread of coronavirus. The closely-watched “quits rate”, seen by some as a more accurate gauge of the labor market as it is presumed one would only quit a job if a more lucrative one were readily obtained, remained unchanged at 2.5% among private sector employees.
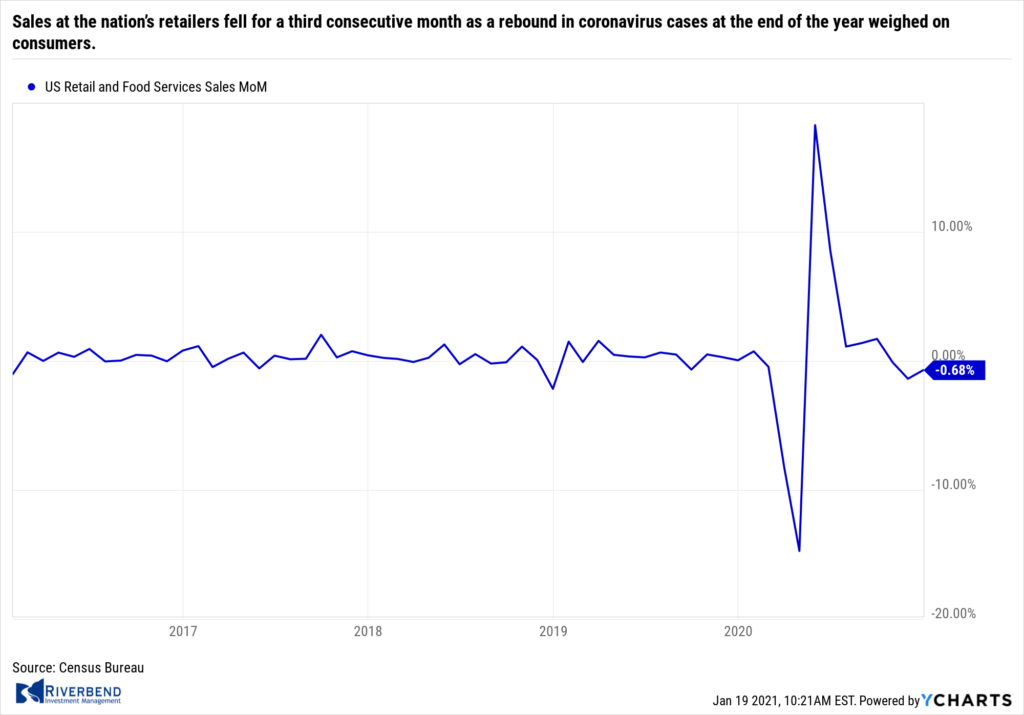 Sales at the nation’s retailers fell for a third consecutive month as a rebound in coronavirus cases at the end of the year weighed on consumers. The Census Bureau reported retail sales dropped 0.7% in December. Economists had expected only a 0.1% decline. Excluding auto dealers and gasoline, retail sales sank a steeper 2.1%.
Surprisingly, internet retailers posted a 5.8% plunge in sales. That category has been one of the standout performers during the pandemic. Bars and restaurants also suffered a 4.5% drop in sales—their third decline in a row. Senior Economists Jennifer Lee at BMO Capital Markets summed up the report succinctly writing “This is a weak handoff for 2021.”
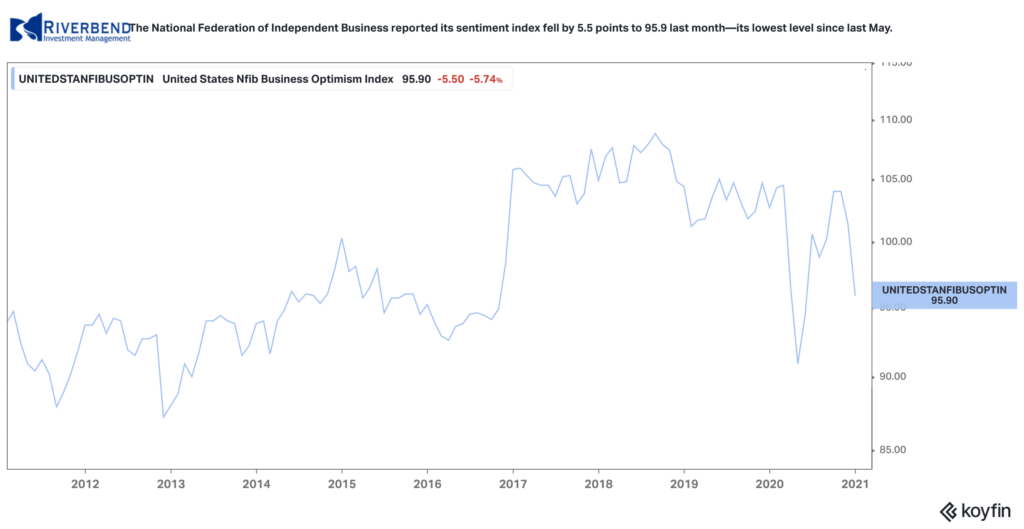 Optimism among the nation’s small business owners slipped to a seven-month low in December after a resurgence in coronavirus cases and Democratic electoral victories implied an impending dramatic shift in economic policy. The National Federation of Independent Business (NFIB) reported its sentiment index fell by 5.5 points to 95.9 last month—its lowest level since last May. Economists had expected just a slight drop to 100.0.
In the report, fewer owners stated now was a good time to expand and more downgraded their sales forecasts for the next three months. NFIB chief economist Bill Dunkelberg stated, “This month’s drop in small-business optimism is historically very large, and most of the decline was due to the outlook of sales and business conditions in 2021.”
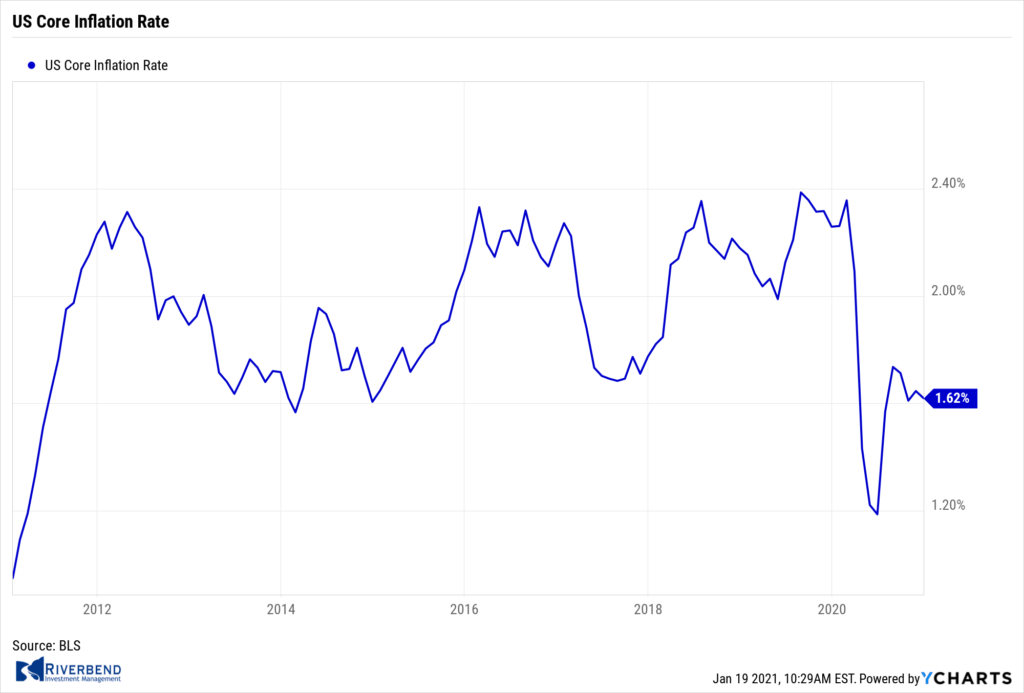
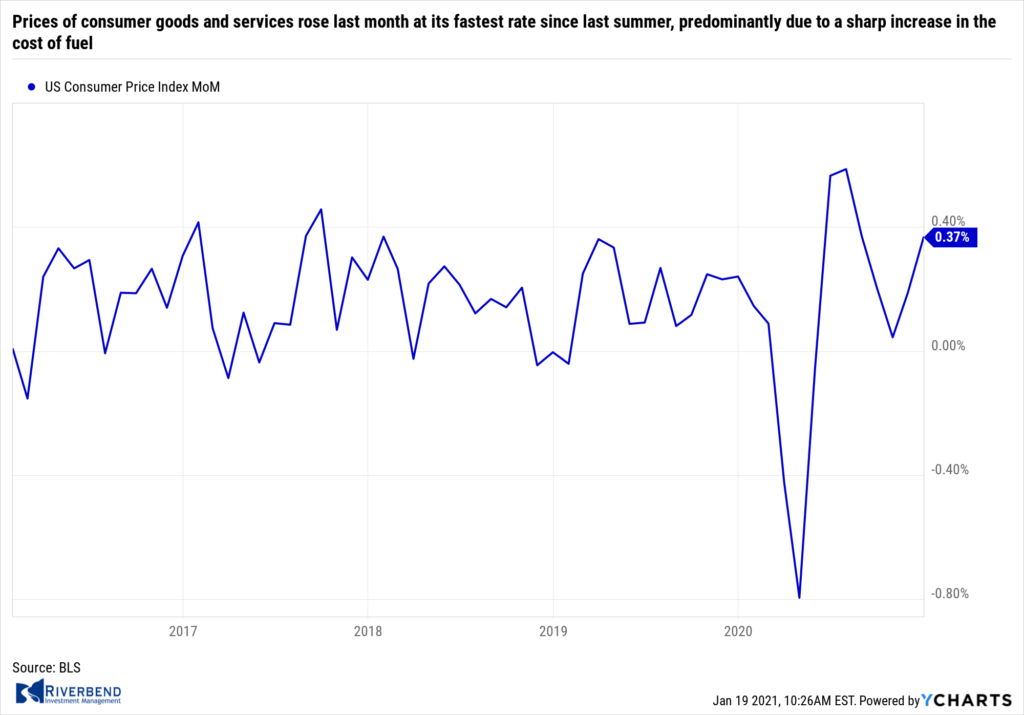 Prices of consumer goods and services rose last month at its fastest rate since last summer, predominantly due to a sharp increase in the cost of fuel, the Bureau of Labor Statistics reported. The government stated the consumer price index advanced 0.4% last month matching economists’ estimates. About 60% of the increase was tied to higher gasoline prices.
The cost of food—groceries and eating out—increased 0.4% last month. Excluding gas and food, the so-called “core rate” of inflation rose a much smaller 0.1%. The core rate of inflation over the past year remained unchanged at 1.6% for the third month in a row.
 Wholesale prices rose in December, primarily due to the increase in the cost of gasoline, but analysts noted few other signs of impending inflation. The government reported the producer price index increased 0.3% in December. Economists had forecast an increase of 0.4%. The cost of gasoline jumped 16%, representing about half of the increase in the price of wholesale goods last month. Prices also rose for iron, steel, meat and other forms of fuel. Over the past 12 months, the rate of wholesale inflation remained unchanged at 0.8%. Meanwhile, the core rate of inflation, which excludes food and energy, rose 0.4% in December. That reading is up 1.1% over the past year.
The Federal Reserve’s “Beige Book”, a collection of anecdotal reports from each of the Fed’s member banks, reported a third of the Fed’s districts experienced flat or declining activity at the end of the year. The majority of districts said economic activity increased only modestly.
In the report, the Philadelphia and Cleveland districts reported declining activity, while activity was flat in St. Louis and Kansas City. An indication that retail inflation may be on the horizon, almost all districts reported modest price increases with many respondents stating they were able to pass some of these increases to consumers.
Chart of the Week: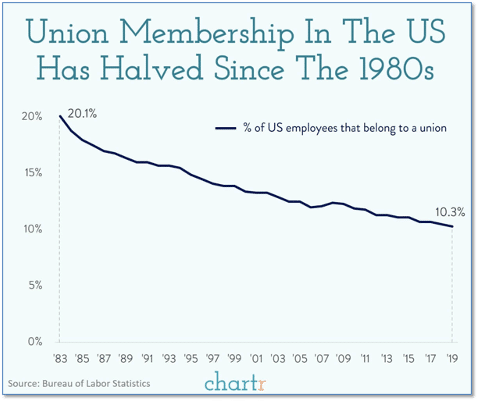
In America’s manufacturing heyday of the 1950’s, more than one-third of all American workers belonged to a union. It was down to 20% in the 1980’s, and last year that number had fallen to just 10% – with the overwhelming majority now made up of teachers, service employees, and public sector employees.
One huge area of the economy that has remained steadfastly union-free is the white-collar tech, and particularly software, sector. Perhaps a portent of change for that industry occurred on January 4th when a group calling itself the Alphabet Workers Union (AWU) emerged from secrecy and formally declared itself a legitimate union of Google employees (Alphabet, Inc. is the parent company of Google). (Data from BLS, chart from chartr.co)
Riverbend Indicators Update:

Each week we post notable changes to the various market indicators we follow.
- As a reading of our Bull-Bear Indicator for U.S. Equities (comparative measurements over a rolling one-year timeframe), we remain in Cyclical Bull territory.
- Counting-up of the number of all our indicators that are ‘Up’ for U.S. Equities, the current tally is that three of four are Positive, representing a multitude of timeframes (two that can be solely days/weeks, or months+ at a time; another, a quarter at a time; and lastly, the {typically} years-long reading, that being the Cyclical Bull or Bear status).
Observations: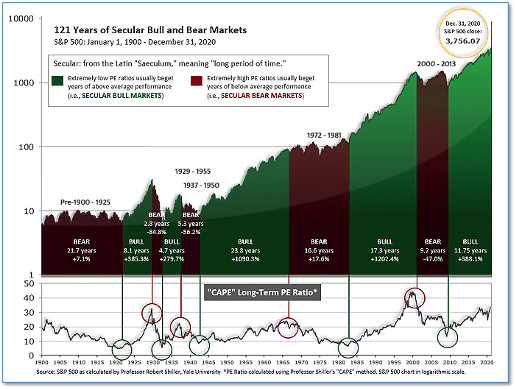
Update to CAPE:
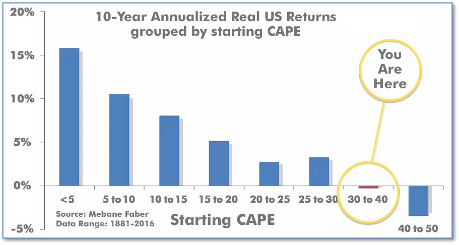
The long-term valuation of the market is commonly measured by the Cyclically Adjusted Price to Earnings ratio, or “CAPE”, which smooths-out shorter-term earnings swings in order to get a longer-term assessment of market valuation.
A CAPE level of 30 is considered to be the upper end of the normal range, and the level at which further PE-ratio expansion comes to a halt (meaning that further increases in market prices only occur as a general response to earnings increases, instead of rising “just because”). The market was recently at that level.
Of course, a “mania” could come along and drive prices higher – much higher, even – and for some years to come. Manias occur when valuation no longer seems to matter, and caution is thrown completely to the wind – as buyers rush in to buy first, and ask questions later.
Two manias in the last century – the “Roaring Twenties” of the 1920s, and the “Tech Bubble” of the late 1990s – show that the sky is the limit when common sense is overcome by a blind desire to buy. But, of course, the piper must be paid, and the following decade or two were spent in Secular Bear Markets, giving most or all of the mania-gains back.
The CAPE is now at 34.26, since 1881, the average annual return for all ten-year periods that began with a CAPE in the 30-40 range has been slightly negative
The Week Ahead:
Monday:
- US Markets Closed
Tuesday:
- German ZEW Economic Sentiment 55.1 exp, 55.0 prior
Wednesday:
- U.S. Inauguration
- UK CPI y/y +0.5% exp, +0.3% prior
- Bank of Canada Rate Statement
- U.S. NAHB Housing Market Index 86 exp, 86 prior
- Australian Employment Change +50k exp, +90k prior
- Bank of Japan Monetary Policy Statement
Thursday:
- ECB Monetary Policy Statement
- U.S. Unemployment Claims 783k exp, 787k prior
- U.S. Philly Fed Manufacturing Index 12.2 exp, 11.1 prior
- U.S. Housing Starts 1.56 mln exp, 1.55 mln prior
- U.S. Building Permits 1.60 mln exp, 1.64 mln prior
Friday:
- German Flash Manufacturing PMI 57.3 exp, 58.3 prior
- French Flash Services PMI 49.1 exp, 49.1 prior
- U.S. Prelim UoM Consumer Sentiment 79.5 exp, 80.7 prior


