U.S. Markets: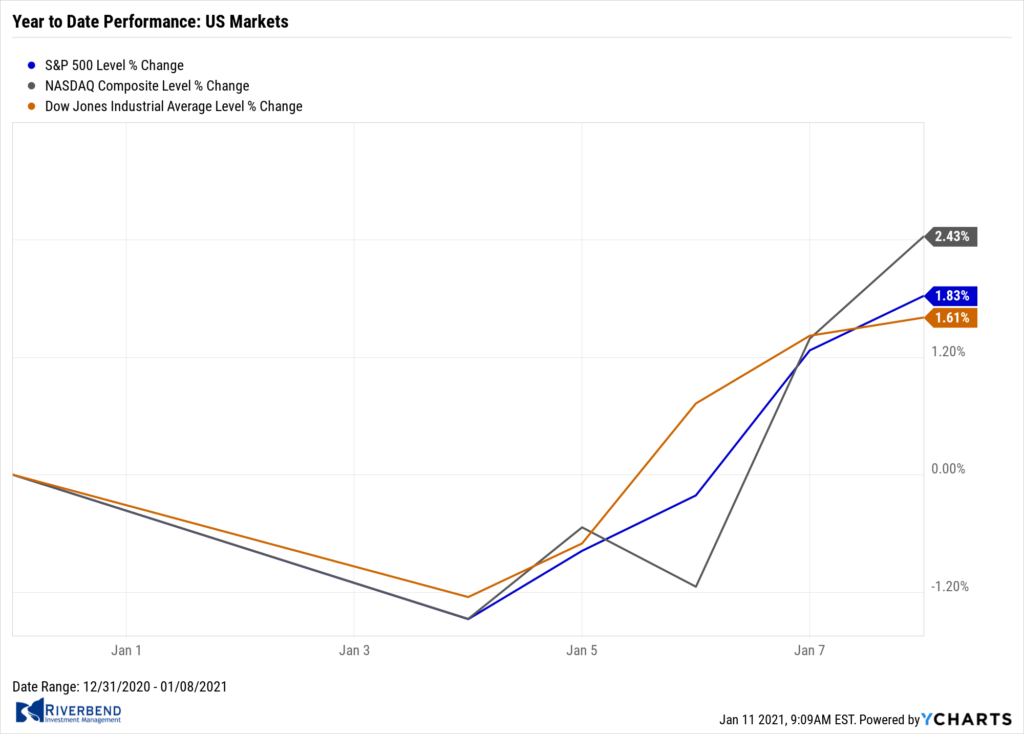
The major U.S. indexes continued their march to record highs despite one of the most politically tumultuous weeks in the nation’s history.
Small caps outperformed large-caps by a wide margin, and energy stocks led the gains within the S&P 500 after Saudi Arabia made a surprise announcement that it was unilaterally cutting oil production by 1 million barrels per day.
The Dow Jones Industrial Average added 491 points, or 1.6%, ending the week at 31,098. The technology-heavy NASDAQ Composite gained 2.4% closing at 13,202.
By market cap, the large cap S&P 500 rose 1.8%, while the mid cap S&P 400 and small cap Russell 2000 surged 4.8% and 5.9%, respectively.
International Markets:
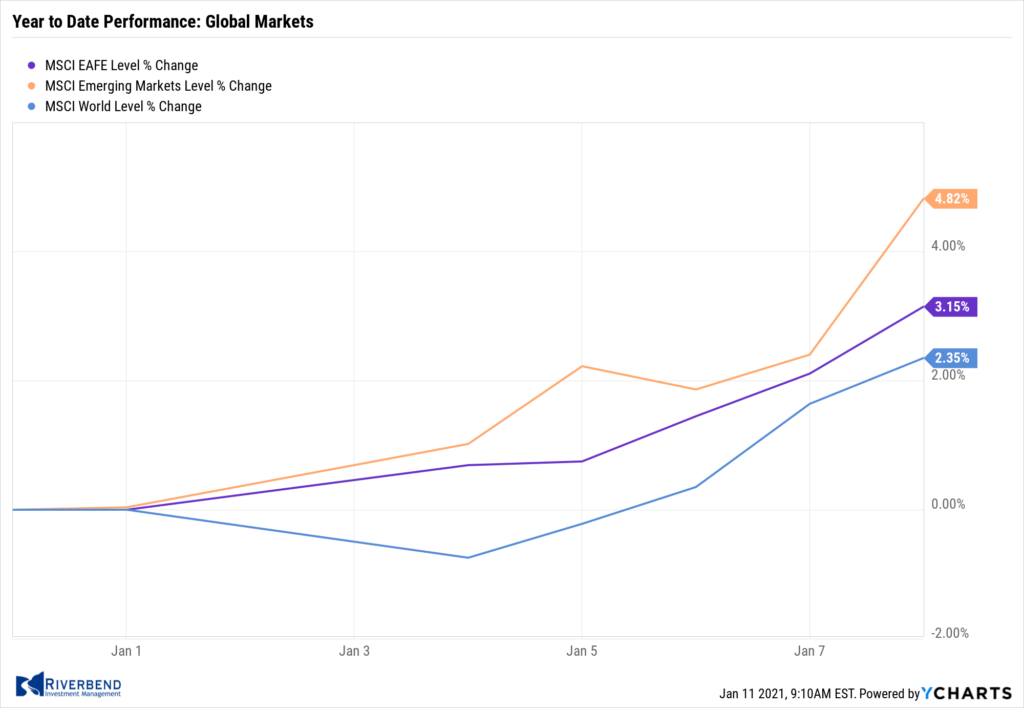
Like the U.S., international markets were a sea of green at the start of the new year.
Canada’s TSX rose 3.5%, while the United Kingdom’s FTSE 100 surged 6.4% in its first week of actual real Brexit.
On Europe’s mainland, France’s CAC 40 and Germany’s DAX added 2.8% and 2.4%, respectively.
In Asia, China’s Shanghai Composite rose 2.8% and Japan’s Nikkei added 2.5%.
As grouped by Morgan Stanley Capital International, developed markets rose 3.8% while emerging markets rallied 5.9%.
Commodities: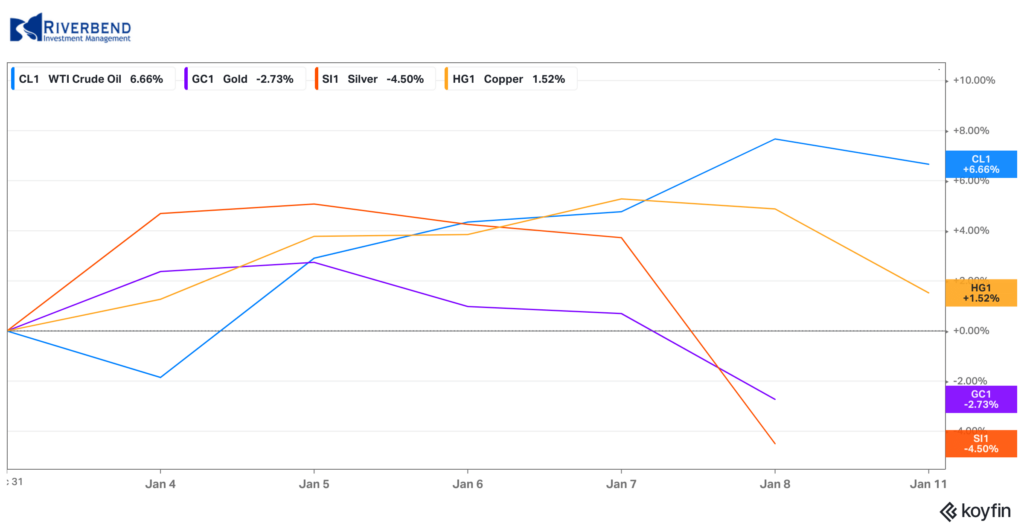
Gold retreated -3.2% last week to $1835.40 an ounce, while Silver fell a steeper -6.7% to $24.64.
Oil continued to recover and is now up 9 out of the last 10 weeks. West Texas Intermediate crude rose 7.7% to $52.24 per barrel.
The industrial metal copper, which is viewed by some analysts as a barometer of world economic health due to its wide variety of uses, gained 4.4%.
U.S. Economic News: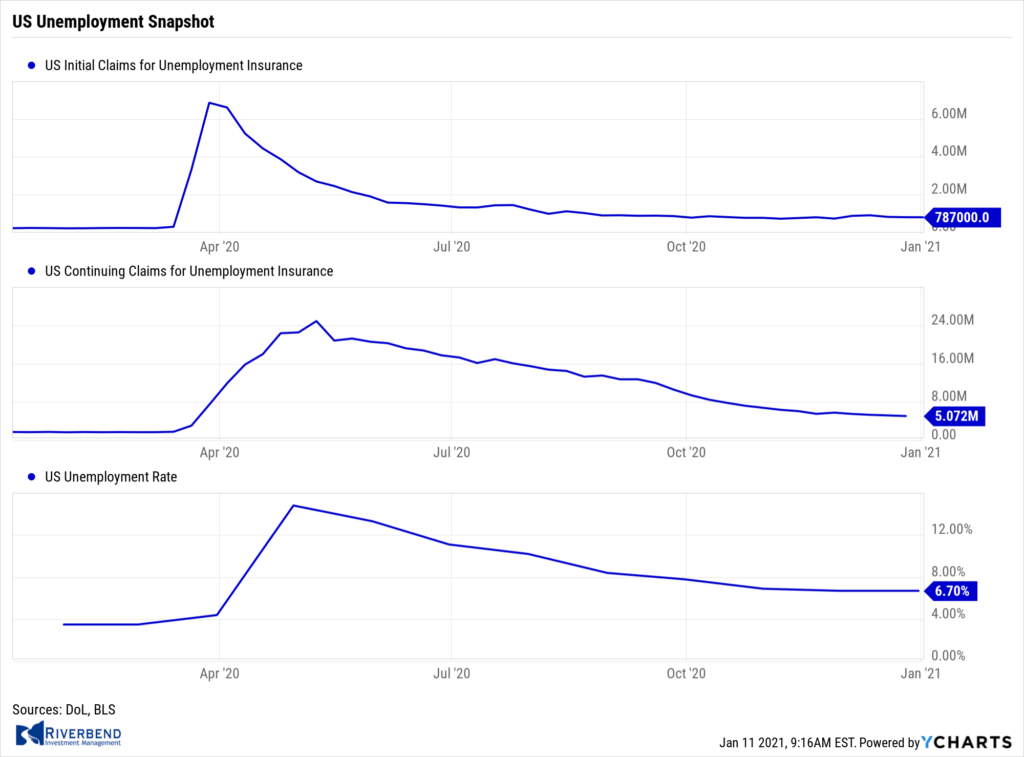
The number of Americans filing for first-time unemployment benefits fell slightly in the first week of the new year, but overall unemployment remained exceedingly high. The Labor Department reported initial jobless claims fell by 3,000 to 787,000 last week. Economists had forecast claims to total 815,000.
After falling to a pandemic low of 711,000 in early November, new jobless claims moved higher again after a record surge in coronavirus cases in December. Continuing claims, which counts the number of people already collecting benefits, declined by 126,000 to 5.07 million—a new pandemic low. That number is reported with a one-week delay.
The U.S. lost jobs for the first time in eight months as a resurgence in coronavirus cases at the end of the year forced businesses to resort to more layoffs. The Bureau of Labor Statistics reported employment in the government and private sector declined by 140,000. In the report, most of the layoffs were concentrated in the restaurant and hospitality sectors that rely largely on crowds of customers. Bars and restaurants shed over 370,000 jobs while jobs in recreation such as theme parks and casinos also declined by 92,000.
On a positive note, hiring rose by 161,000 in white-collar professional occupations and 51,000 in construction. The official unemployment rate remained unchanged at 6.7%. Analysts were mixed following the report. Senior Economist Sal Guatieri at BMO Capital Markets called the report a “major setback for the labor market”, while Chief Economist Chris Low at FHN Financial noted, “This is a pause in the recovery, not a full-on stall.”
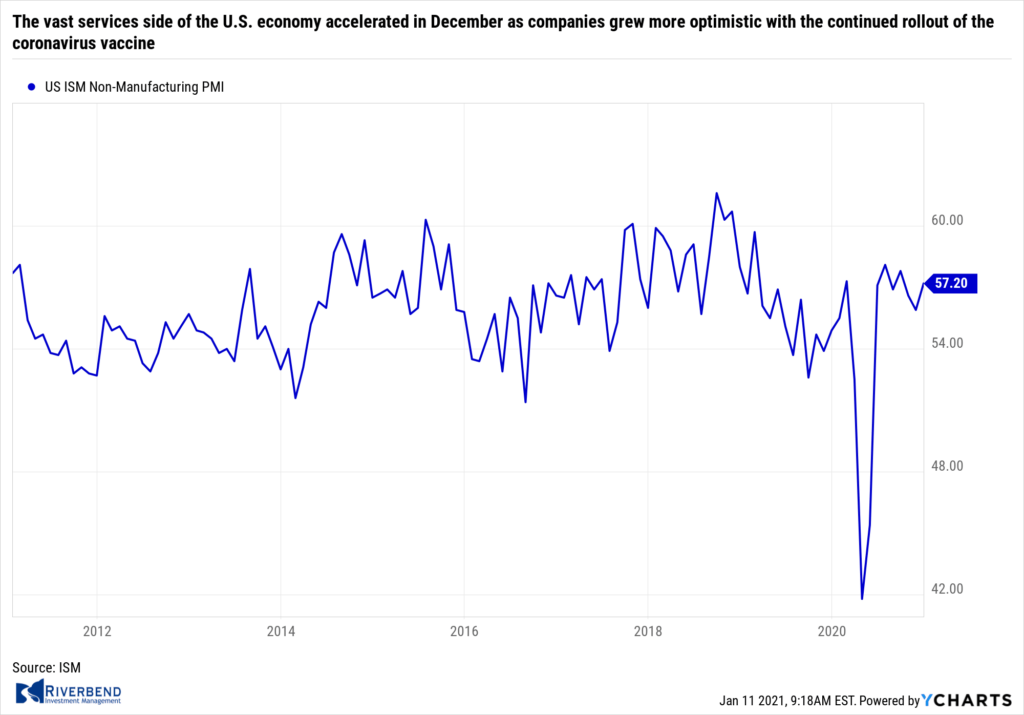 The vast services side of the U.S. economy accelerated in December as companies grew more optimistic with the continued rollout of the coronavirus vaccine. The Institute for Supply Management (ISM) reported its survey of senior executives at non-manufacturing companies rose 1.3 points to a three-month high of 57.2. Readings above 50 indicate that businesses are expanding.
In the report, 14 of the 18 service industries tracked by ISM expanded the same as in November. New orders and production both rose and remained near a pandemic high, but employment fell, turning negative for the first time since August. Anthony Nieves, ISM chairman stated, “Various local- and state-level COVID-19 shutdowns continue to negatively impact companies and industries.”
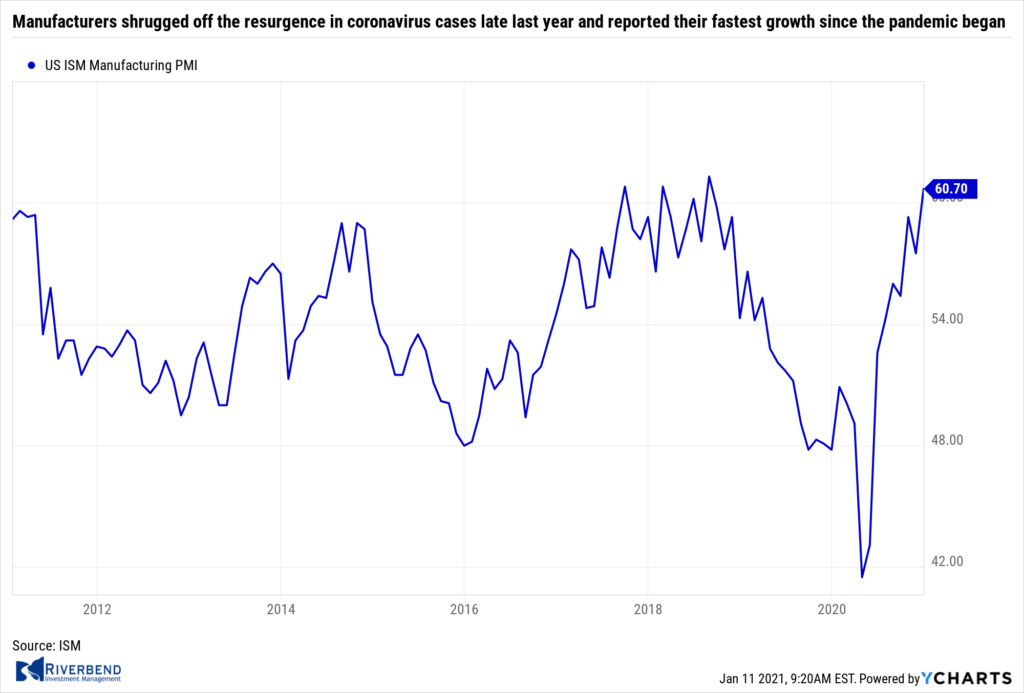 As with Services, Manufacturers shrugged off the resurgence in coronavirus cases late last year and reported their fastest growth since the pandemic began. The Institute for Supply Management (ISM) reported its manufacturing index rose 3.2 points to 60.7 in December—its highest level in almost two and half years. Economists had forecast a reading of just 57.
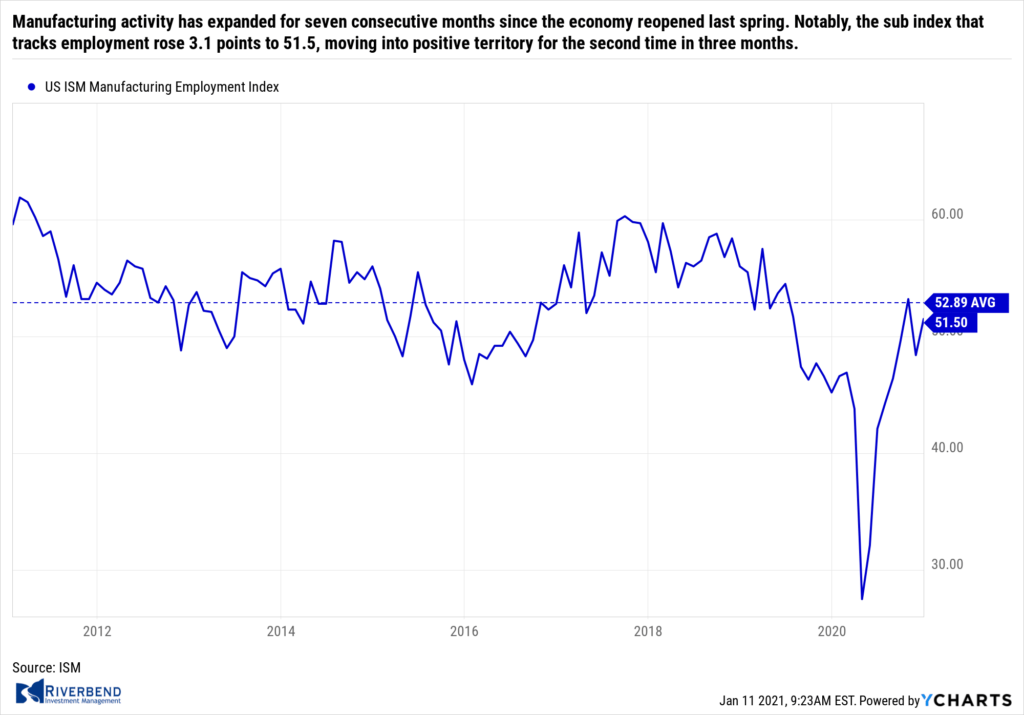 Manufacturing activity has expanded for seven consecutive months since the economy reopened last spring. In the report, new orders climbed 2.8 points to 67.9, while production increased 4 points to 64.8. Notably, the sub index that tracks employment rose 3.1 points to 51.5, moving into positive territory for the second time in three months. Sixteen of the 18 industries tracked by ISM expanded in December, unchanged from the prior month. Amazingly, most companies said sales now exceed pre-crisis levels and they expect even better revenue gains in 2021.
U.S. factory goods orders rose for a seventh consecutive month in November, the Commerce Department reported. Orders for manufactured goods rose 1% in November following a 1.3% gain the prior month. Economists had expected just a 0.8% gain. In the details, orders for long-lasting durable goods rose 1%, while orders for non-durable goods were up 1.1%. Excluding aircraft, orders for non-defense capital goods rose a revised 0.5%–up a tick from the prior estimate.
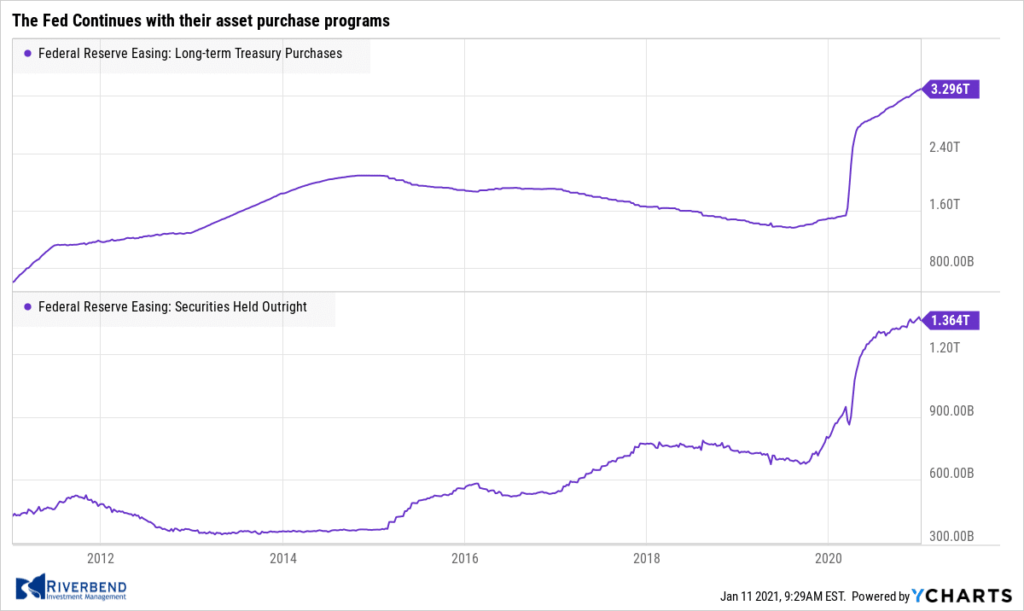 Only a “couple” of the 17 top Federal Reserve officials pushed for the central bank to expand its purchases of longer-term bonds during their meeting in December, minutes from that meeting showed. The Fed has been buying $40 billion of Treasuries per month since June, with the purchases coming across the yield curve. Ahead of the meeting many economists argued that concentrating the purchases on the long-end of the curve would add more stimuli to the economy.
Fed officials “generally judged that the asset purchase program as structured was providing very significant policy accommodation,” according to the minutes. “Some” Fed officials left open the possibility of weighing purchases of Treasuries toward the longer end if necessary, the minutes said. Furthermore, the Fed stated it would continue its asset purchases “until substantial further progress has been made toward reaching the Committee’s maximum employment and price stability goals.” However, there is no mention of what specific numerical criteria or thresholds constitute “substantial progress”.
Chart of the Week: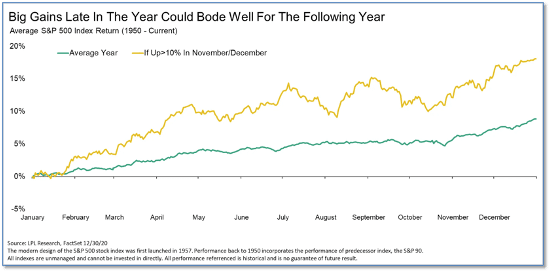
Is a strong year-end rally a portent for returns in the new year that follows? Ryan Detrick, Chief Market Strategist at LPL Financial, says the results of his study of the question could have “bulls smiling” in 2021.
Detrick said a 10% or greater gain in the final two months of the year, which since World War II has occurred 5 times prior to this year, has led to a higher S&P 500 the following year each and every time. Detrick concluded his study with “Once again, strong returns are the playbook historically,”
The chart above (the gold line) shows what a year typically looks like after a 10% or more prior-year November/December rally, compared to an “average” S&P 500 return (the green line).
Riverbend Indicators Update:

Each week we post notable changes to the various market indicators we follow.
- As a reading of our Bull-Bear Indicator for U.S. Equities (comparative measurements over a rolling one-year timeframe), we remain in Cyclical Bull territory.
- Counting-up of the number of all our indicators that are ‘Up’ for U.S. Equities, the current tally is that three of four are Positive, representing a multitude of timeframes (two that can be solely days/weeks, or months+ at a time; another, a quarter at a time; and lastly, the {typically} years-long reading, that being the Cyclical Bull or Bear status).
Observations:
As volatility increased in a market that is a bit overbought, our short-term indicator went to cash. This indicator is meant to be a guide to help identify periods of short-term market volatility.
Looking at the current political turmoil of last week, we can see where this volatility is coming from.
Our intermediate and longer-term indicators remain fully invested as the market is still looking forward to what life will look like post COVID.
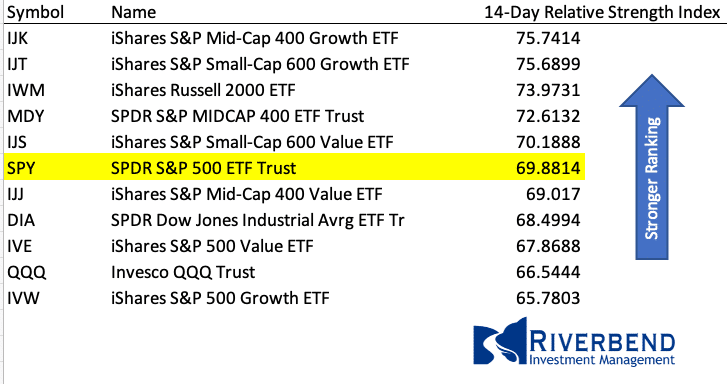
Taking a look at market internals, the talk of aggressive stimulus packages favors small to mid-cap company outlooks and we are seeing that reflected in the relative strength reading of the market:
The Week Ahead:
Monday:
- UK BRC Retail Sales Monitor y/y +5.9% exp, +7.7 prior
Tuesday:
- U.S. Small Business Index 100.7 exp, 101.4 prior
- IBD/TIPP Economic Optimism 50.1 exp, 49.0 prior
- U.S. JOLTS Job Openings N/A exp, 6.65 mln prior
- U.S. 10-year Note Auction 0.95 WI, 2.3% b/c prior
Wednesday:
- Eurozone Industrial Production m/m +0.3% exp, +2.1% prior
- U.S. CPI m/m +0.4% exp, +0.2% prior
- U.S. 30-year Bond Auction 1.67% WI, 2.5 b/c
- China Trade Balance (USD) 72.0 bln exp, 75.4 bln prior
Thursday:
- China New Loans 1250 bln exp, 1430 bln prior
- U.S. Unemployment Claims 783k exp, 787k prior
- U.S. Fed Chair Powell Speaks
Friday:
- Retail Sales U.S. Retail Sales m/m +0.0% exp, -1.1% prior
- U.S. Industrial Production m/m +0.5% exp, +0.4% prior
- U.S. Prelim UoM Consumer Sentiment 79.5 exp, 80.7 prior
(Sources: All index- and returns-data from Yahoo Finance; news from Reuters, Barron’s, Wall St. Journal, Bloomberg.com, ft.com, guggenheimpartners.com, zerohedge.com, ritholtz.com, markit.com, financialpost.com, Eurostat, Statistics Canada, Yahoo! Finance, stocksandnews.com, marketwatch.com, wantchinatimes.com, BBC, 361capital.com, pensionpartners.com, cnbc.com, CNBC, FactSet.)


