[fusion_builder_container hundred_percent=”no” equal_height_columns=”no” menu_anchor=”” hide_on_mobile=”small-visibility,medium-visibility,large-visibility” class=”” id=”” background_color=”” background_image=”” background_position=”center center” background_repeat=”no-repeat” fade=”no” background_parallax=”none” parallax_speed=”0.3″ video_mp4=”” video_webm=”” video_ogv=”” video_url=”” video_aspect_ratio=”16:9″ video_loop=”yes” video_mute=”yes” overlay_color=”” video_preview_image=”” border_size=”” border_color=”” border_style=”solid” padding_top=”” padding_bottom=”” padding_left=”” padding_right=””][fusion_builder_row][fusion_builder_column type=”1_1″ layout=”1_1″ background_position=”left top” background_color=”” border_size=”” border_color=”” border_style=”solid” border_position=”all” spacing=”yes” background_image=”” background_repeat=”no-repeat” padding_top=”” padding_right=”” padding_bottom=”” padding_left=”” margin_top=”0px” margin_bottom=”0px” class=”” id=”” animation_type=”” animation_speed=”0.3″ animation_direction=”left” hide_on_mobile=”small-visibility,medium-visibility,large-visibility” center_content=”no” last=”no” min_height=”” hover_type=”none” link=””][fusion_text]
U.S. Markets: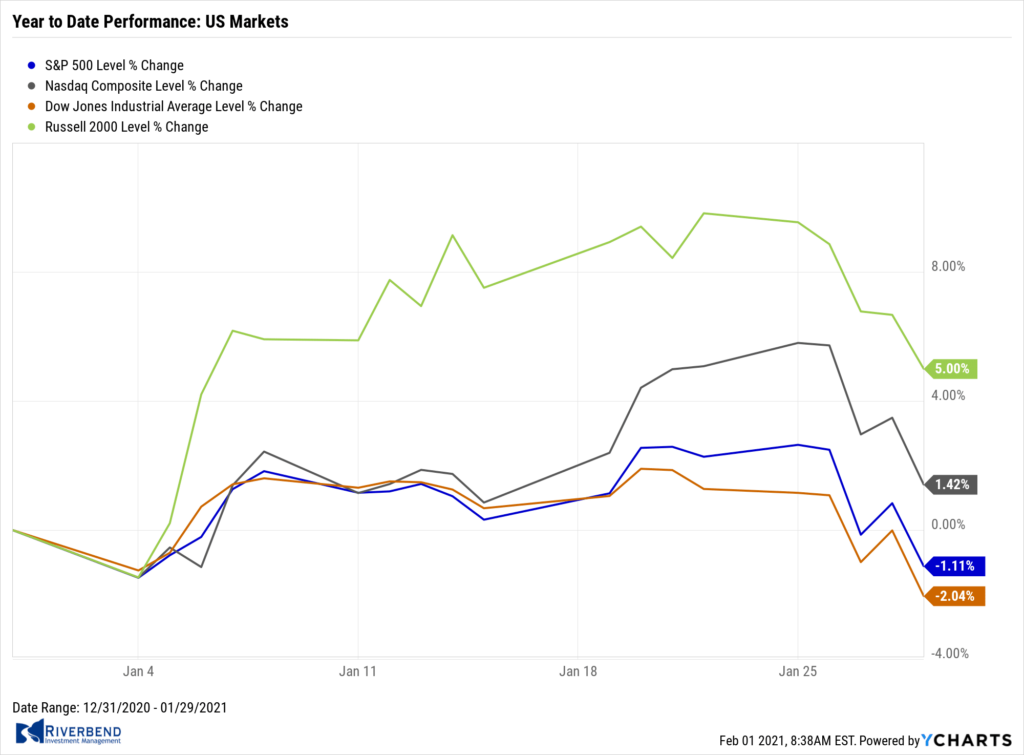
Stocks declined sharply last week amid much higher volatility and trading volumes. Large caps held up marginally better than mid-cap and small-cap shares.
The Dow Jones Industrial Average shed over 1000 points last week closing at 29,983 – a decline of 3.3%. The technology-heavy NASDAQ Composite gave up most of last week’s gains finishing down -3.5%.
By market cap, the large cap S&P 500 fell -3.3%, while the mid-cap S&P 400 and small-cap Russell 2000 retreated -5.0% and -4.4% respectively.
International Markets: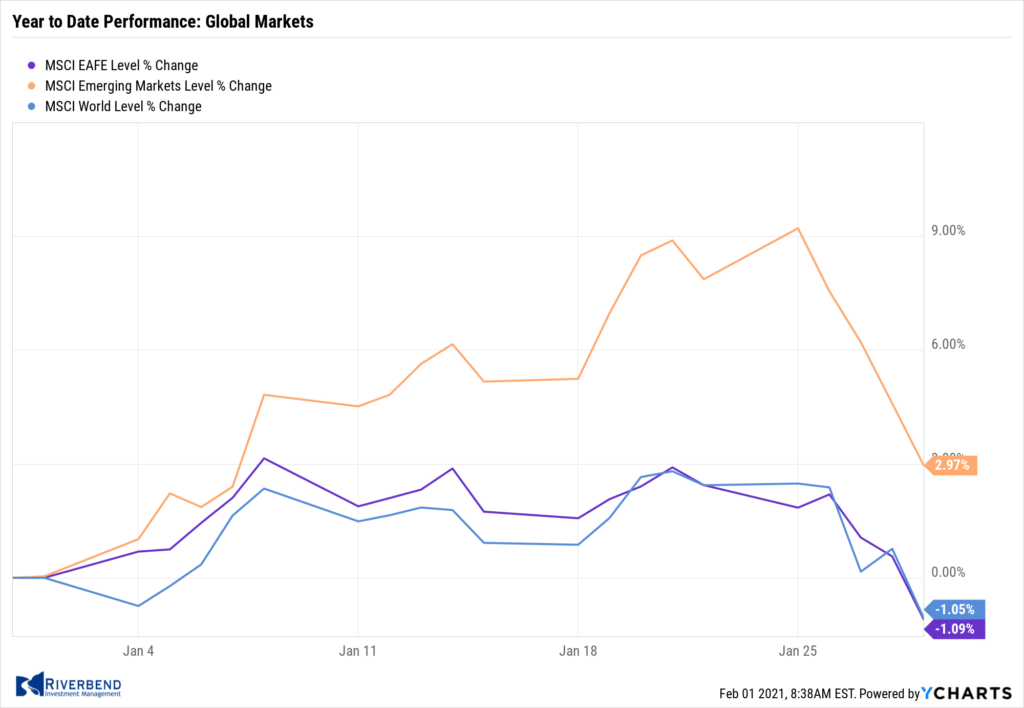
International markets finished the week in a sea of red. Canada’s TSX fell -2.9% and the United Kingdom’s FTSE 100 retreated -4.3%.
On Europe’s mainland, France’s CAC 40 and Germany’s DAX declined ‑2.9% and -3.2%, respectively. In Asia, China’s Shanghai Composite and Japan’s Nikkei each fell -3.4%.
As grouped by Morgan Stanley Capital International, developed markets gave up -3.7% while emerging markets fell -4.5%.
Commodities: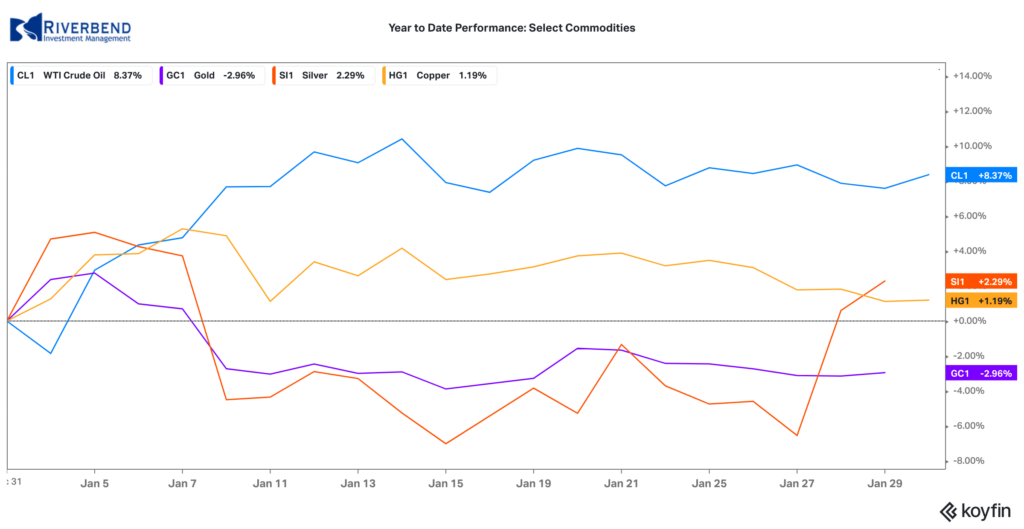
Precious metals ended the week mixed. Gold ticked down -0.3% to $1850.30 per ounce, while Silver rose 5.3% to $26.91.
Oil finished down for a second week. West Texas Intermediate crude closed at $52.20 per barrel, a decline of -0.1%.
The industrial metal copper, viewed by some analysts as a barometer of world economic health due to its wide variety of uses, finished the week down -1.9%.
U.S. Economic News: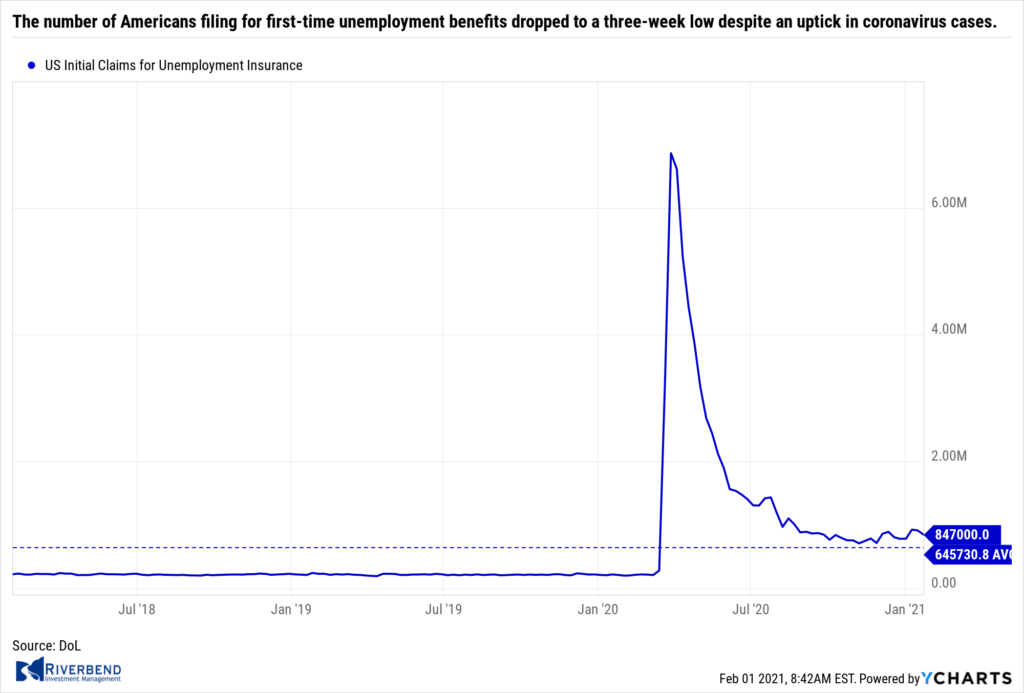
The number of Americans filing for first-time unemployment benefits dropped to a three-week low despite an uptick in coronavirus cases. The Labor Department reported initial jobless claims fell by 67,000 to a seasonally-adjusted 847,000 last week. Economists had forecast claims to total 875,000.
Before the pandemic, new claims were running in the low 200,000s and they had never risen by more than 695,000 in any one week. Meanwhile, the number of people already collecting state jobless benefits declined by 203,000 to a seasonally adjusted 4.77 million. That’s the lowest level since the pandemic began.
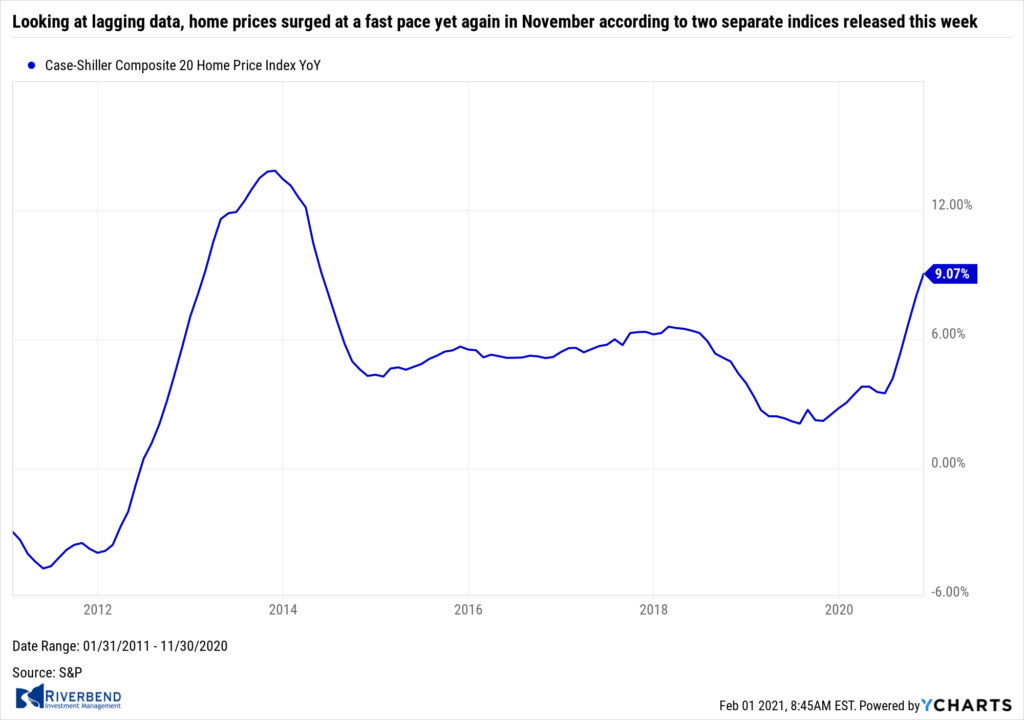 Home prices surged at a fast pace yet again in November according to two separate indices released this week. The S&P CoreLogic Case-Shiller 20-city home price index posted a 9.1% year-over-year gain in November – a 1.1% increase from the previous month. On a monthly basis, the index increased 1.5% between October and November. Across the country, the broader Case-Shiller national price index showed a 9.5% gain year-over-year, up 8.4% from the prior month.
Prices rose in at least 19 of the 20 large cities tracked by Case-Shiller. Detroit, which is typically included in the 20-city index, was again excluded because of issues collecting data during previous coronavirus-related shutdowns. Phoenix experienced the largest price increase for the 18th consecutive month with a 13.8% year-over-year increase, followed by Seattle (12.7%) and San Diego (12.3%).
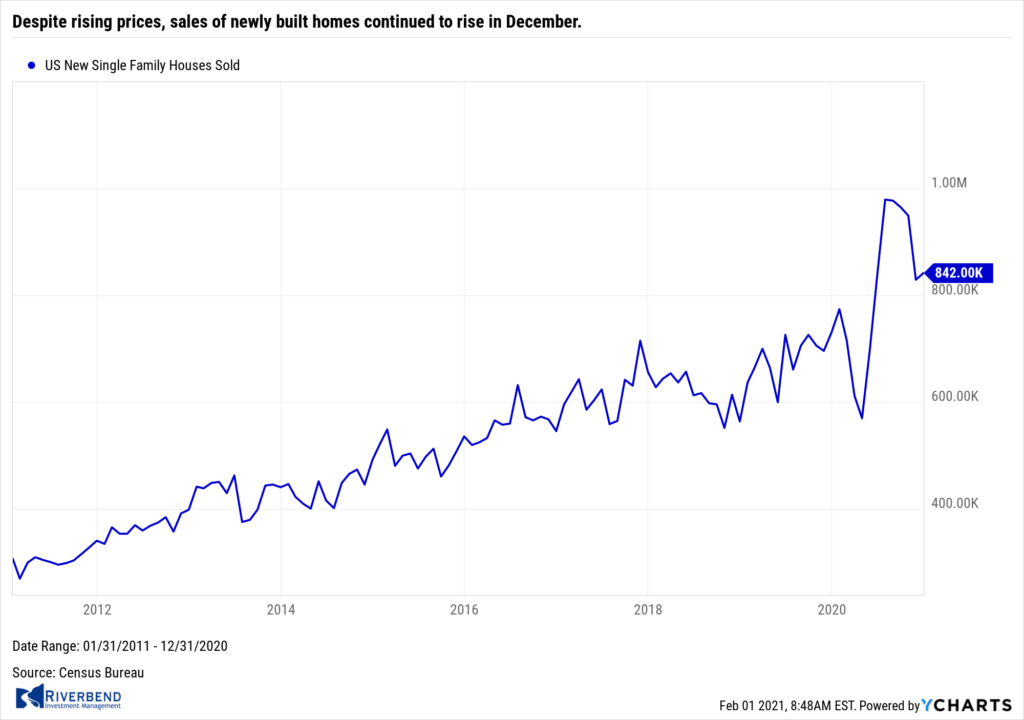 Despite rising prices, sales of newly built homes continued to rise in December. The Census Bureau reported new home sales occurred at a seasonally-adjusted annual rate of 842,000 last month. That was a 1.6% increase over November’s reading. Analysts had expected an annual rate of 875,000. Compared to 2019, December’s numbers were up roughly 15% year-over-year.
Gains varied by part of the country, led by a 30.6% increase in the Midwest, but sales in the Northeast and South fell on a monthly basis, by 6.1% and 5.1% respectively. Inventory rose slightly to a 4.3-month supply. A six-month supply of homes is generally considered indicative of a balanced market. The median price of new homes for sale was $355,900, up 8% from 2019.
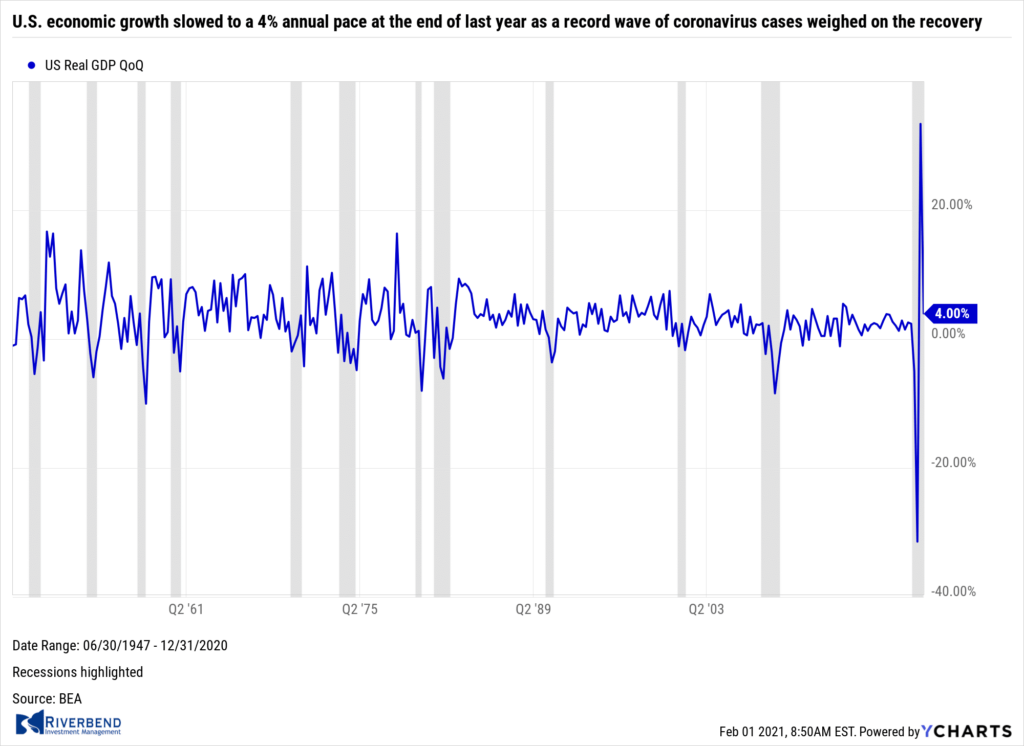 U.S. economic growth slowed to a 4% annual pace at the end of last year as a record wave of coronavirus cases weighed on the recovery. It followed a 33.4% surge in the previous quarter, which reflected the reopening of the economy and massive fiscal and monetary stimulus. But with COVID cases and deaths spiking since the fall, partial shutdowns in some industries and states, and brewing social unrest around the presidential election, the economic recovery lost momentum at yearend. Jim Baird, chief investment officer at Plante Moran Financial Advisors summed it up stating, “The bottom line is that the economy remains in a delicate spot.”
Confidence among the nation’s consumers recovered a bit in January as the number of coronavirus cases and fatalities continued to decline. The Conference Board reported its index of consumer confidence rose 2.2 points to 89.3 this month, after two months of declines. Last month’s reading was the lowest in five months. Economists had forecast a further decline to 88. Other measures of confidence, including the consumer-sentiment survey and daily report by Morning Consult, also recovered in January. Consumer confidence is still far below pre-pandemic levels, however. The index stood at 132.6 before the viral outbreak last February.
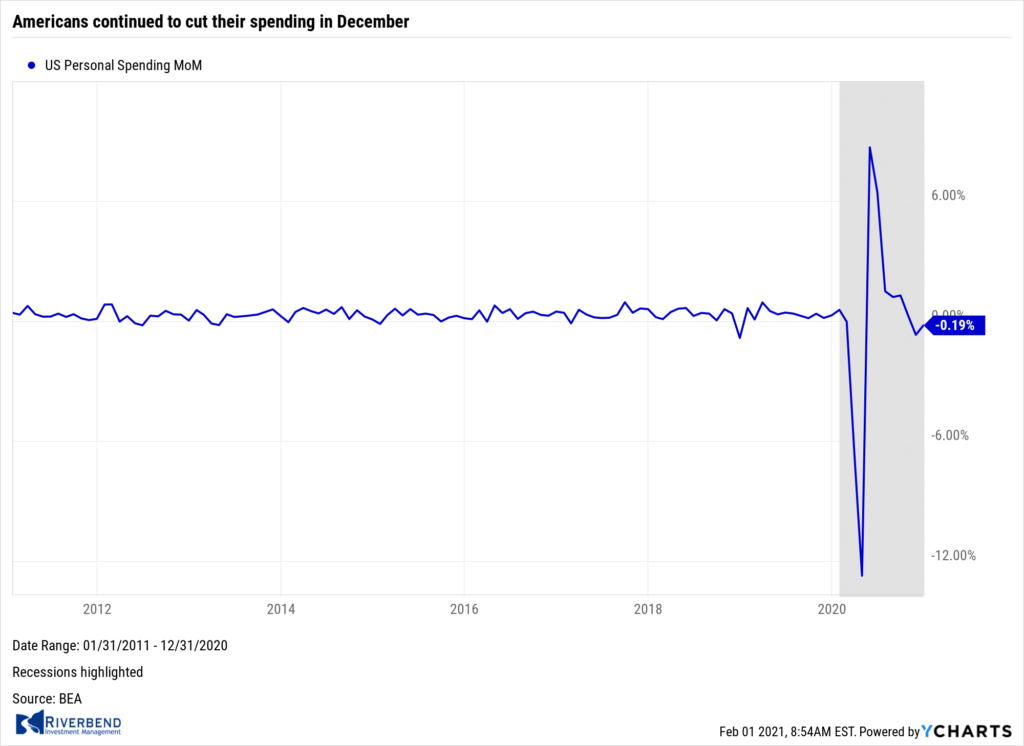 Americans continued to cut their spending in December, for the second month. The Commerce Department reported consumer spending declined 0.2% last month. On a positive note, spending didn’t fall as much as expected. Economists had forecast a 0.4% drop. Spending fell the most in December on recreation goods and vehicles, groceries, liquor and services such as dining out. Americans also cut spending on non-essentials.
Despite the decline, at least one analyst is optimistic of a rebound in spending in the first quarter of 2021. U.S. economist Andrew Hunter at Capital Economics stated, “The recent wave of virus infections and restrictions on activity ensured that consumption ended last year on a weak note, but there are a number of reasons to expect spending to rebound sharply in the first few months of this year.”
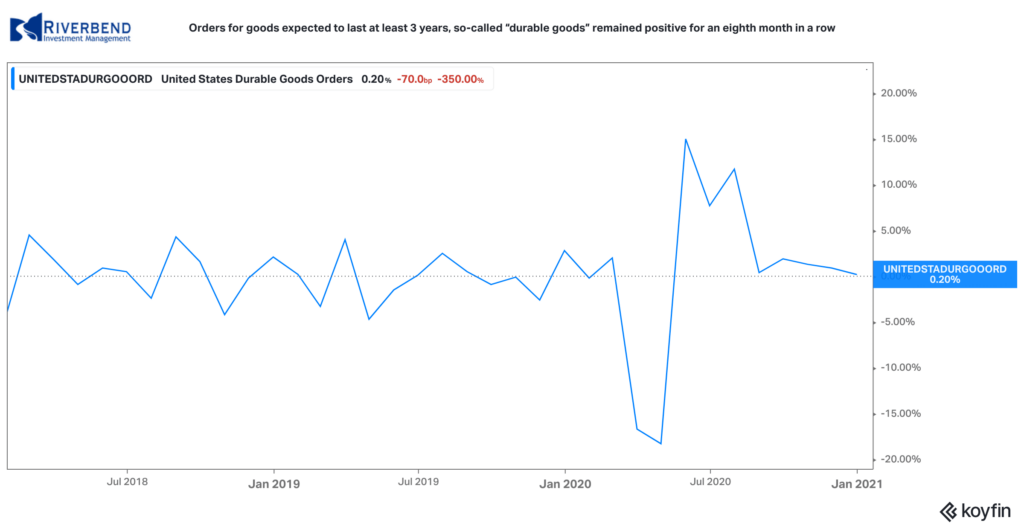 Orders for goods expected to last at least 3 years, so-called “durable goods” rose for an eighth month in a row. Orders rose 0.2% in December, below economists’ estimates, but analysts stated it was still a solid report. The drag stemmed predominantly from a slump in new aircraft orders.
Excluding transportation and transportation, core orders rose a fairly robust 0.6%. Orders for new cars and trucks increased 1.4% in the final month of 2020. Auto sales have held up pretty well during the pandemic as car buyers took advantage of ultra-low rates to lock in good deals. Jennifer Lee, senior economist at BMO Capital Markets stated, “This report shows firm upward momentum for business investment as the longest year ever came to an end.”
Chart of the Week: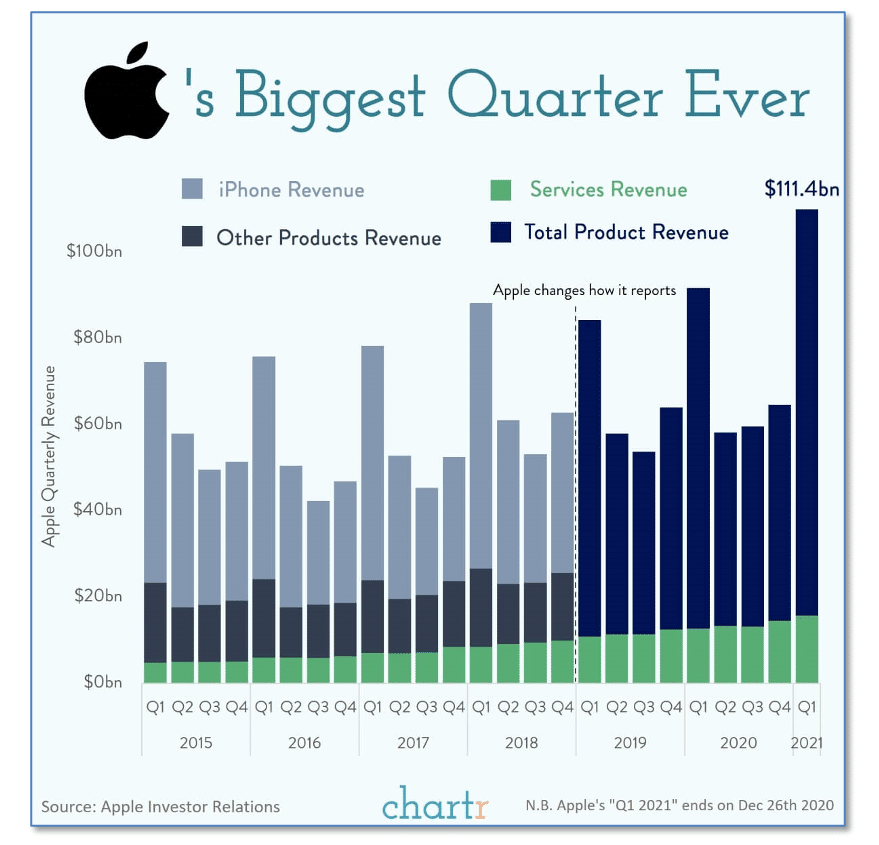
Amidst all the drama and non-stop news coverage this week surrounding the war between the Reddit WallStreetBets crowd and several hedge funds over GameStop and a handful of other heavily-shorted stocks, Apple posted its biggest quarter ever – and hardly anyone noticed.
Apple reported it brought in $111 billion of revenue in the final quarter of 2020. The Services business, which includes Apple Music, the App Store, Apple Pay, Apple TV, iCloud and more, was a bright spot for Apple, growing 24% year-over-year, but it was actually robust sales in China that really helped Apple’s revenue over the top to its first-ever $100-billion-plus quarter.
Riverbend Indicators Update:

Each week we post notable changes to the various market indicators we follow.
- As a reading of our Bull-Bear Indicator for U.S. Equities (comparative measurements over a rolling one-year timeframe), we remain in Cyclical Bull territory.
- Counting-up of the number of all our indicators that are ‘Up’ for U.S. Equities, the current tally is that three of four are Positive, representing a multitude of timeframes (two that can be solely days/weeks, or months+ at a time; another, a quarter at a time; and lastly, the {typically} years-long reading, that being the Cyclical Bull or Bear status).
Observations:
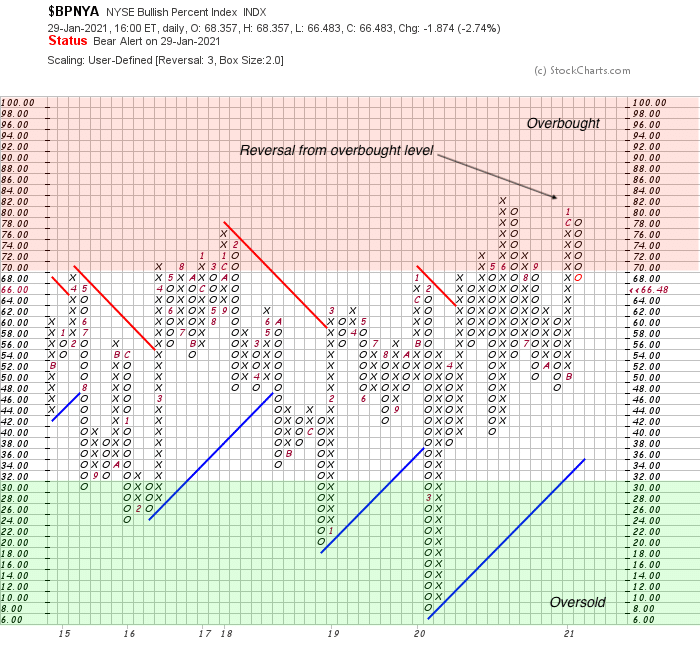
I was asked the other day, why one of our market indicators has remained negative. One of the reasons is that particular indicator reflects how overbought or oversold the market is in the short term.
Last week, the US equity market pulled back from overbought levels:
Of course, this brings up the question: “Is it time to enter a wealth preservation mode?”
One relationship that I find useful when studying the health of the market is that between stocks and short term bonds. If we take a look at the relative strength relations between the S&P 500 and short term US treasuries, we can see a change in relative strength when emotional selling enters the market:
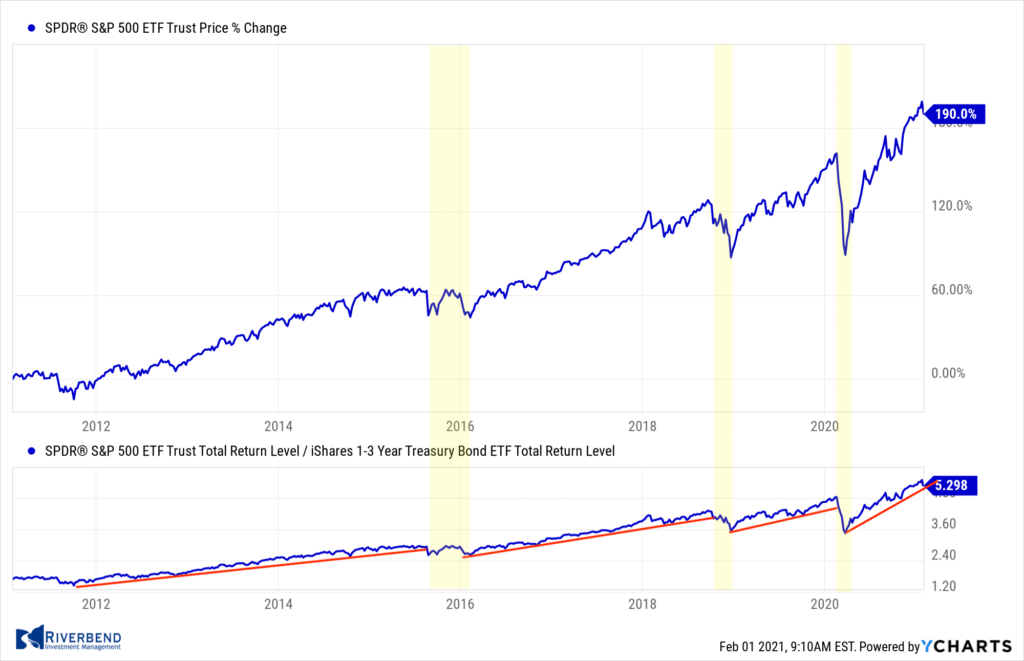
Here at Riverbend, we use this concept to build formulas that help us study this relationship closer and keep an eye out for breakdowns in this relationship. For example: If we take a universe that includes the major market indices plus the S&P 500 sector indices, then remove sectors that have secondary attributes (like energy, which is tied to commodity values), we can rank the strength of the market vs short term US treasuries.
In this example, I am using the distance between 20 and 200-day moving averages to demonstrate rising strength. (You can read more about this concept here: Moving Average Distance as a Predictor of Equity Returns)
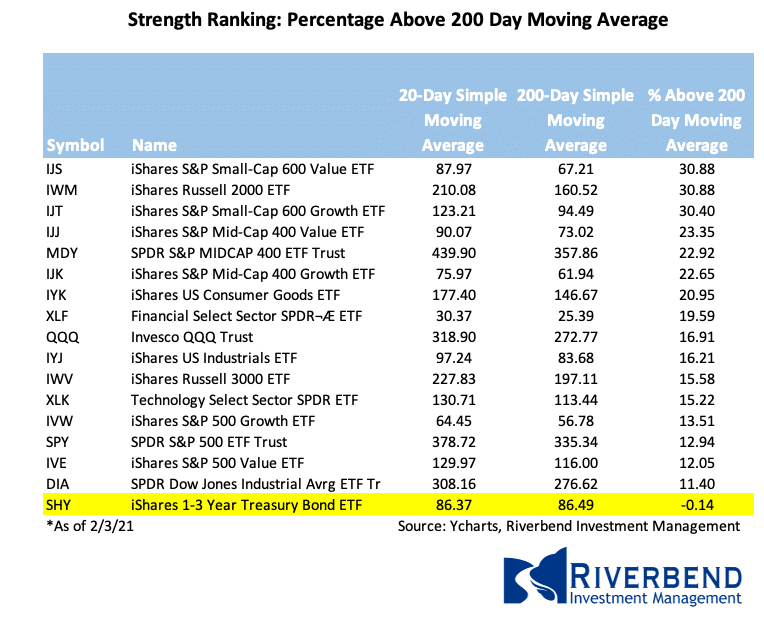
(Correction: The wrong table was posted. 2/3/21: replaced with correct version)
Currently, I am not seeing any breakdowns in this relationship.
If this relationship does breakdown, we will allocate portfolios accordingly to help preserve portfolio values in our client’s accounts.
But for now, this pullback looks like a typical, garden variety, short-term pullback.
The Week Ahead:
Monday:
- U.S. ISM Manufacturing PMI 60.0 exp, 60.7 prior
Tuesday:
- U.S. IBD/TIPP Economic Optimism 51.0 exp, 50.1 prior
- U.S. Wards Total Vehicle Sales 16.1 mln exp, 16.3 mln prior
Wednesday:
- Eurozone CPI Flash Estimate y/y +0.4% exp, -0.3% prior
- U.S. ADP Non-Farm Employment Change +50k exp, -123k prior
- U.S. ISM Services PMI 56.7 exp, 57.2 prior
Thursday:
- U.S. Prelim Unit Labor Costs q/q 3.6% exp, -6.6% prior
- U.S. Unemployment Claims 850k exp, 847k prior
- U.S. Factory Orders m/m +0.7% exp, +1.0% prior
Friday:
- German Factory Orders m/m -1.2% exp, +2.3% prior
- U.S. Non-Farm Employment Change +55k exp, -150k prior
- U.S. Unemployment Rate 6.7% exp, 6.7% prior
- U.S. Average Hourly Earnings m/m +0.3% exp, +0.8% prior
[/fusion_text][/fusion_builder_column][/fusion_builder_row][/fusion_builder_container]


