U.S. Markets: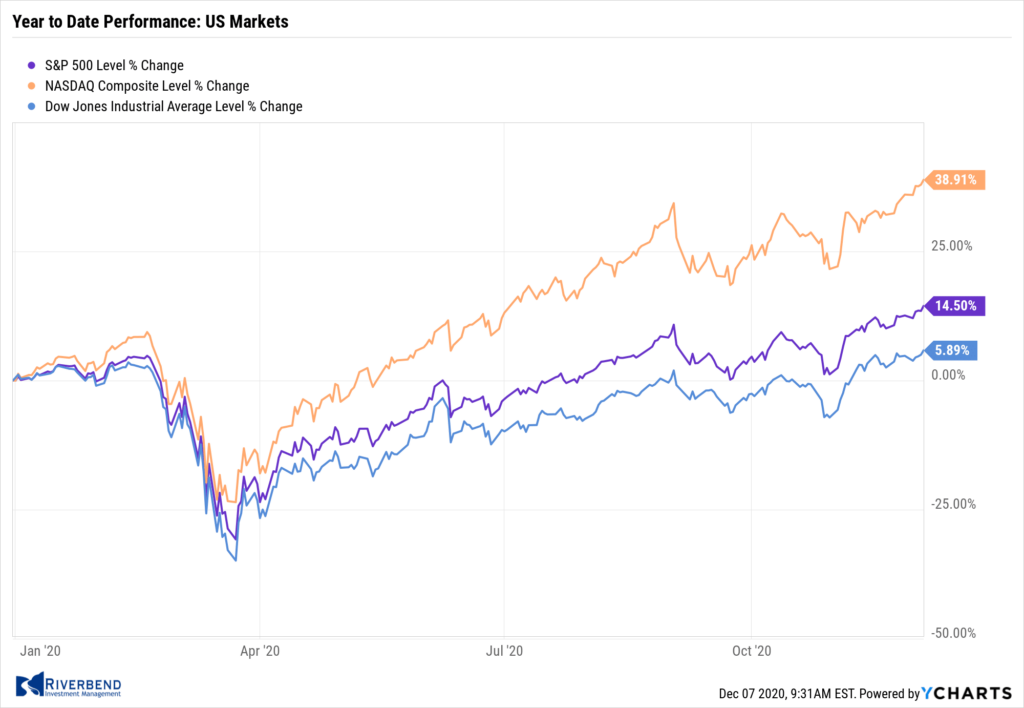
U.S. stocks reached further into record territory with all of the major benchmarks touching new intraday highs by Friday.
The Dow Jones Industrial Average cleared 30,000 points ending the week at 30,218, up 1.0%.
The technology-heavy NASDAQ Composite had its third consecutive week of gains adding 2.1%.
By market cap, the large cap S&P 500 gained 1.7%, while the mid cap S&P 400 and small cap Russell 2000 rose 1.8% and 2.0%, respectively.
International Markets:
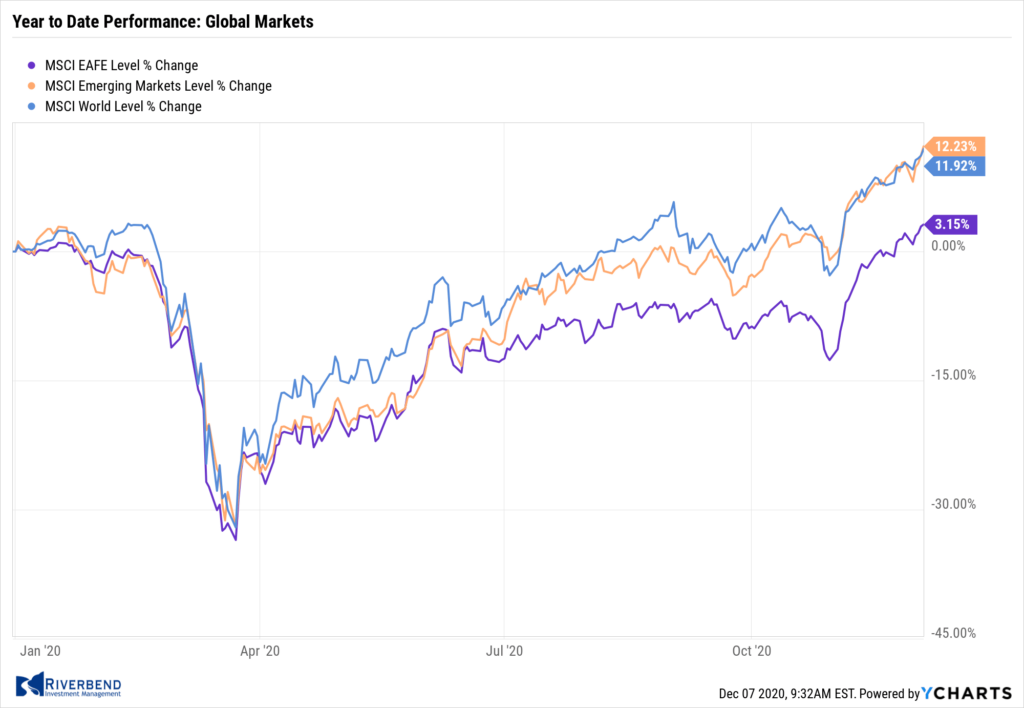
International markets were mostly positive for the week. Canada’s TSX rose for a fourth consecutive week adding 0.7%, while across the Atlantic the United Kingdom’s FTSE 100 rallied 2.9%.
On Europe’s mainland, France’s CAC 40 gained 0.2%, but Germany’s DAX retreated -0.3%.
In Asia, China’s Shanghai Composite and Japan’s Nikkei rose 1.1% and 0.4%, respectively.
As grouped by Morgan Stanley Capital International, developed markets added 1.2% while emerging markets rose 1.6%.
Commodities: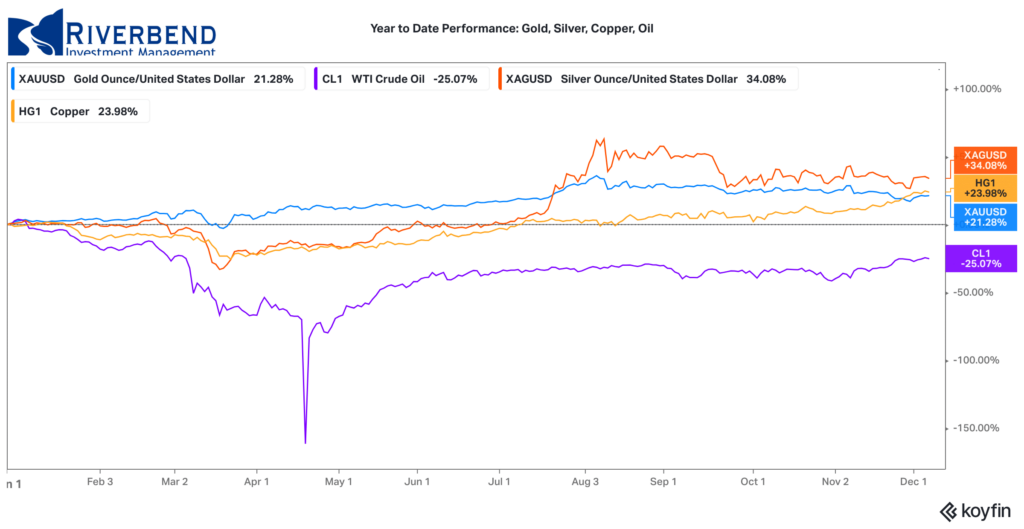
After three consecutive down weeks, Gold managed to finish to the upside rising 2.9% to $1840 per ounce. Similarly, silver surged 7.1% to $24.25 per ounce.
Crude oil rose for a fifth straight week, up 1.6% to $46.26 per barrel.
The industrial metal copper, viewed by some analysts as a barometer of world economic health due to its wide variety of uses, also rose for a fifth consecutive week adding 3.1%.
U.S. Economic News: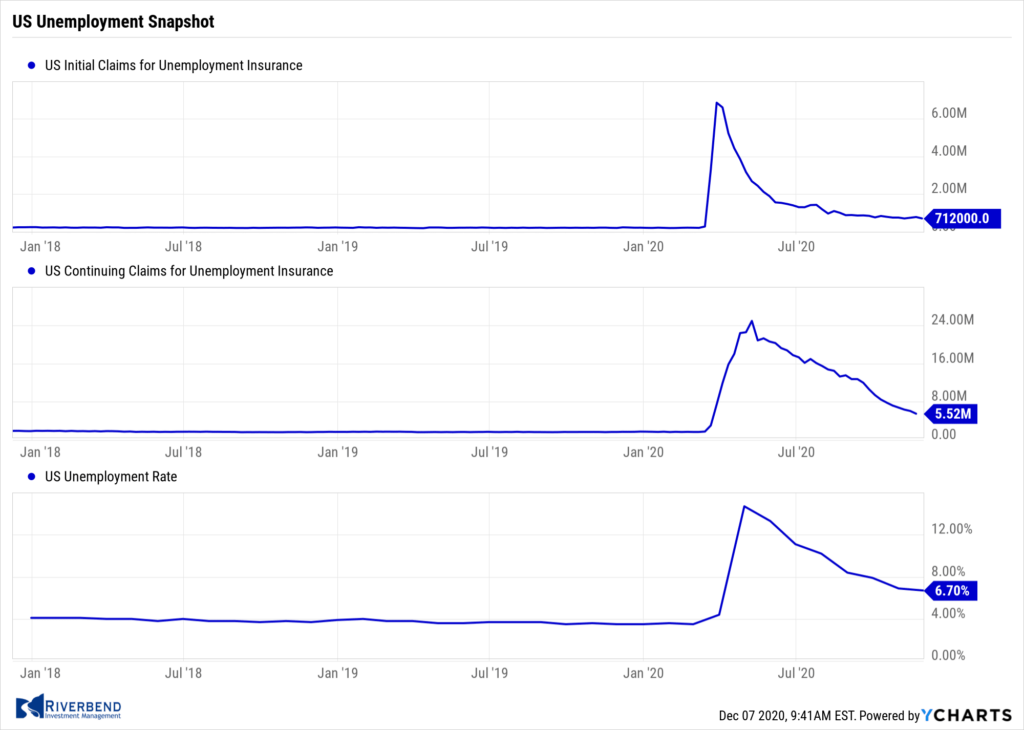
The number of Americans filing first-time unemployment benefits fell last week, but overall layoffs remained stubbornly high. The Labor Department reported initial jobless claims dropped a seasonally-adjusted 75,000 to 712,000 in the seven days ended November 28. Economists had forecast claims to total 780,000.
Though welcome, the latest decline is unlikely to dispel worries about rising layoffs and a slowdown in hiring following a resurgence of coronavirus cases. Analysts noted another 288,701 people applied for benefits through a temporary federal relief program. The combined number of new state and federal jobless claims still hasn’t dropped below 1 million a week since the start of the pandemic more than eight months ago.
The pace of hiring slowed in November as COVID cases increased. The Bureau of Labor Statistics reported non-farm payrolls rose by 245,000, far below the consensus of 440,000. The unemployment rate declined 0.2% to 6.7%, matching the consensus. Private payrolls had their smallest gain in the past seven months, increasing by 344,000. A full labor market recovery remains a long way off. To date, the labor market has recovered about 60% of the private sector jobs that were lost in March and April.
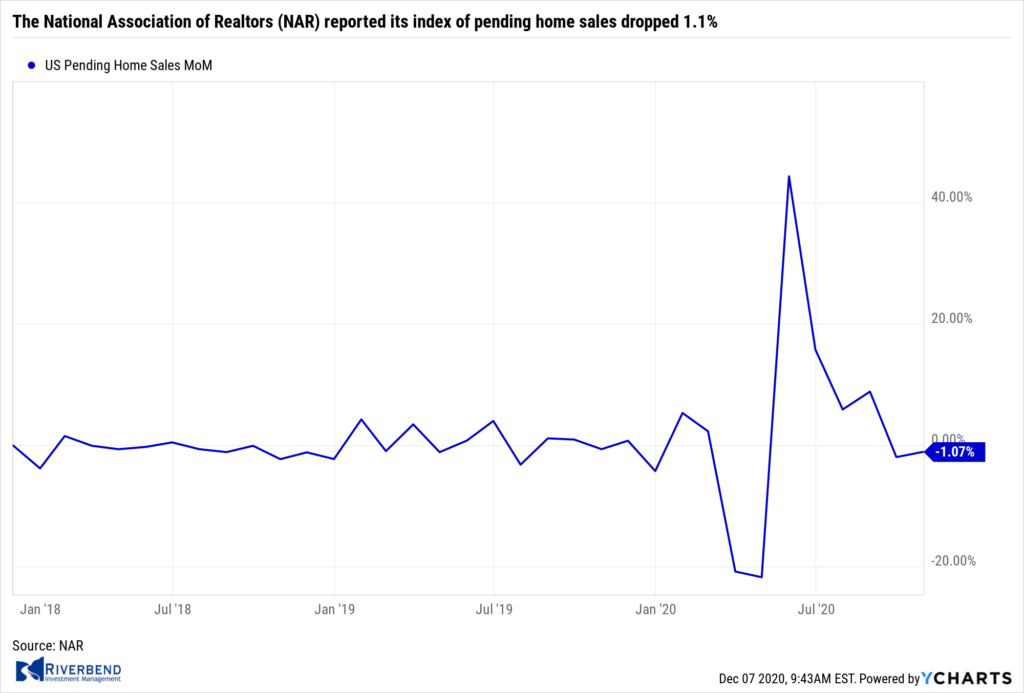
A measure of housing demand fell further in October as higher prices continued to discourage would-be buyers. The National Association of Realtors (NAR) reported its index of pending home sales dropped 1.1% in its latest reading, following a 2.2% decline in September.
The South was the only major region to post an increase, though just barely. Pending home sales posted their biggest decline in the Northeast. Record low mortgage rates and an increase in migration out of major cities have boosted home sales during the pandemic making the housing market a surprising bright spot for the economy.
However, the spike in demand has pushed up prices discouraging potential buyers. Lawrence Yun NAR’s chief economist, “The housing market is still hot, but we may be starting to see rising home prices hurting affordability.”
 The vast services side of the U.S. economy expanded at its strongest pace in more than five years according to data analytics firm Markit. IHS Markit reported its Services Purchasing Managers’ Index (PMI) jumped 2.5 points to 58.4 last month. Chris Williamson, Chief Business Economist at IHS Markit stated, “November saw US business activity surge higher at a rate not seen since early-2015 as companies enjoyed sharply rising demand for goods and services.” Williamson noted confidence had picked up considerably with encouraging news on vaccines and significantly reduced political uncertainty following the presidential election.
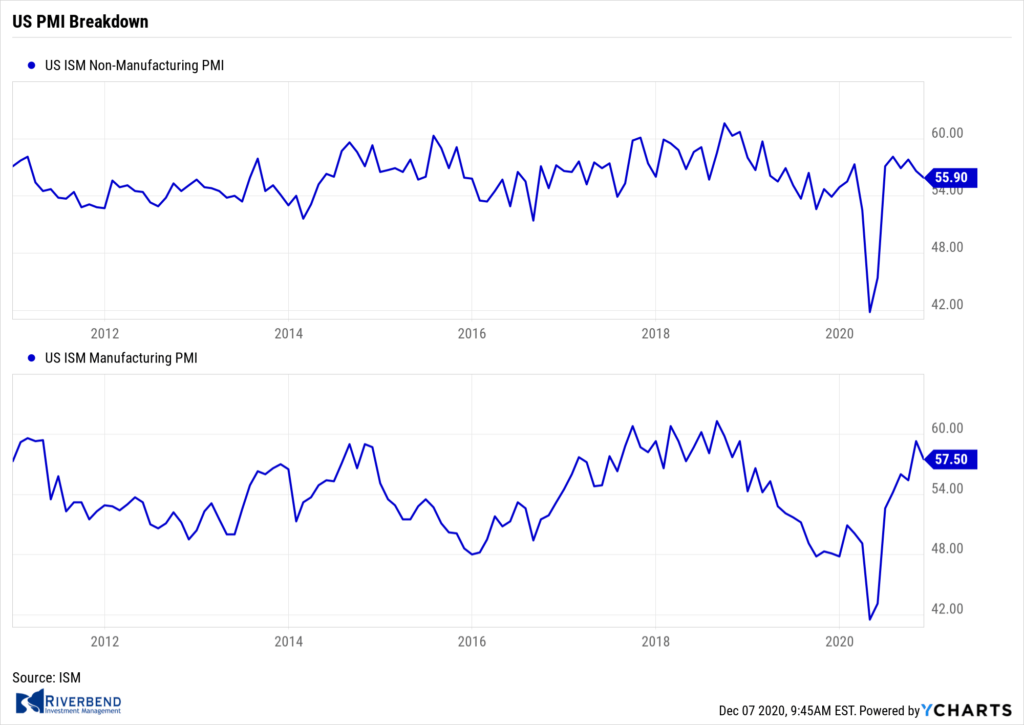
Manufacturing activity expanded in November for the seventh month in a row, but a re-emergence of coronavirus shuttered some plants and led to the loss of some workers. The Institute for Supply Management (ISM) said its manufacturing index fell to 57.5% in November from an almost two-year high of 59.3% in the prior month.
Economists had expected a reading of 58%. Although readings over 50% indicate growth, companies encountered more struggles in November with worker absenteeism, temporary plant closures, and an inability to fill open jobs.
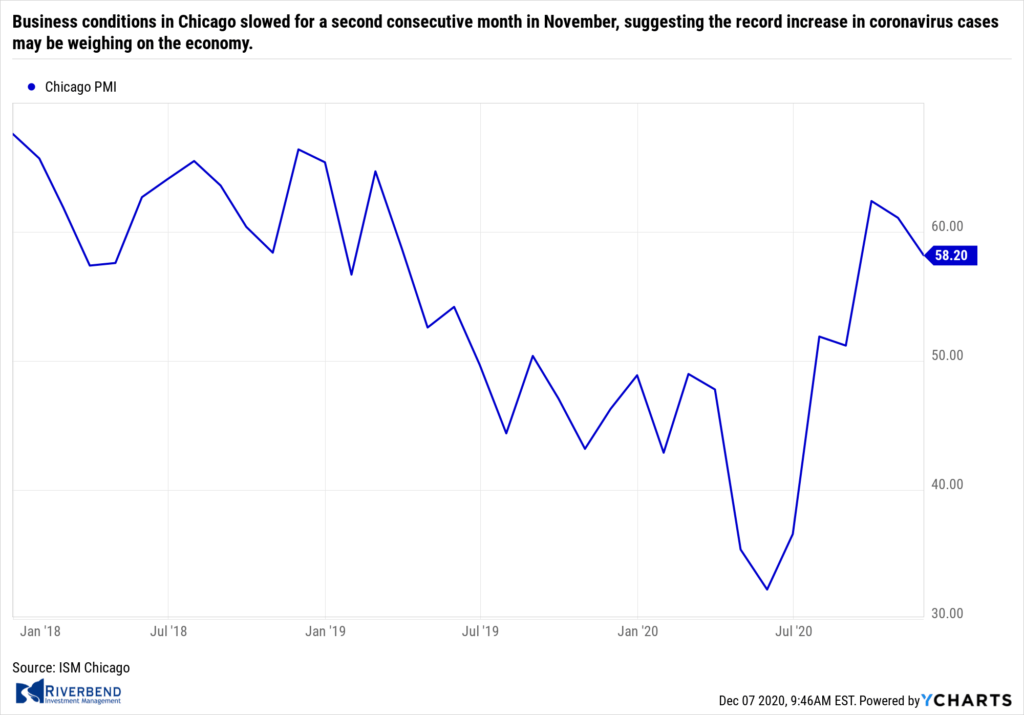
Business conditions in the Windy City slowed for a second consecutive month in November, suggesting the record increase in coronavirus cases may be weighing on the economy. The Institute for Supply Management reported its Purchasing Managers Index for Chicago dropped 2.9 points to 58.2 last month.
Wall Street economists had forecast the index would drop to just 59. Although readings above 50 indicate expanding conditions, the index sits at a three-month low. Despite the positive readings, business conditions still haven’t returned to normal.
The Federal Reserve’s ‘Beige Book’, a collection of anecdotal information from each of the Federal Reserve’s member banks, showed several regions of the country are experiencing little or no economic growth.
The Federal Reserve’s ‘Beige Book’, a collection of anecdotal information from each of the Federal Reserve’s member banks, showed several regions of the country are experiencing little or no economic growth. The Philadelphia Fed and three of the four Fed banks in the Midwest found that economic activity in their regions showed “little or no growth.”
While still positive, business contacts said their optimism has waned as the pandemic spread rapidly across the country. The sharp rise in COVID-19 cases sparked labor supply problems, including absenteeism and attrition, the survey found. Many districts said they fear employment levels would fall over the winter before recovering.
Chart of the Week: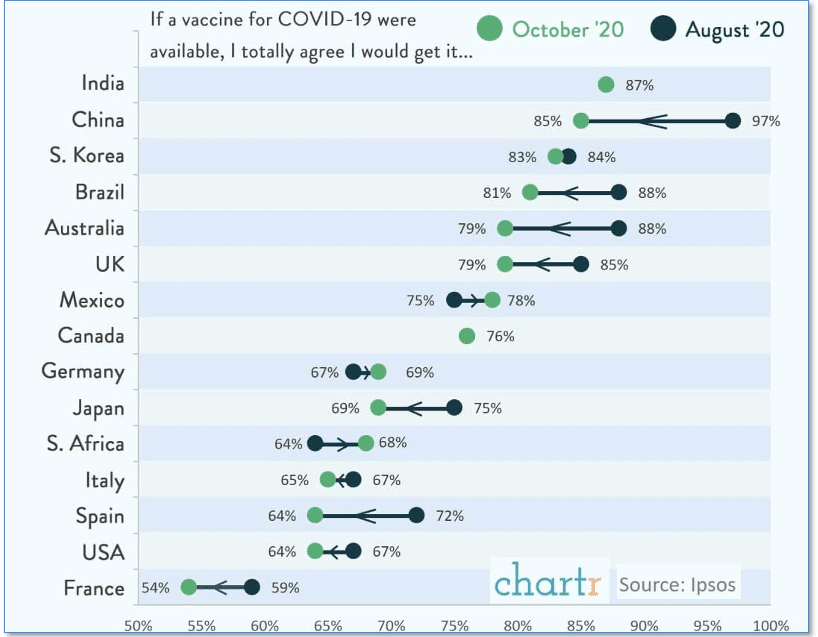
If a vaccine for COVID-19 were available right now, would you get it?
If you aren’t quite sure, you’re not alone—more than a third of Americans stated the same thing.
Analytics firm Ipsos looked at survey data from around the world and found that western Europeans and Americans were the least likely to jump at the chance to get a vaccine—about 65%, with the French population being the most skeptical at just 54%.
In contrast, India and China led the way with the percentage of people ready to get the vaccine right now. Over 85% of Chinese and 87% of Indians were ready to roll up their sleeves at the first opportunity.
A curious feature of the data is that most countries exhibited a decrease in the number of citizens eager to get vaccinated between surveys taken in August and again in November. (Data from Ipsos, chart from chartr.co)
Riverbend Indicators Update:

Each week we post notable changes to the various market indicators we follow.
- As a reading of our Bull-Bear Indicator for U.S. Equities (comparative measurements over a rolling one-year timeframe), we remain in Cyclical Bull territory.
- Counting-up of the number of all our indicators that are ‘Up’ for U.S. Equities, the current tally is that four of four are Positive, representing a multitude of timeframes (two that can be solely days/weeks, or months+ at a time; another, a quarter at a time; and lastly, the {typically} years-long reading, that being the Cyclical Bull or Bear status).
Observations:
One of the organizations I belong to, NAAIM (National Association of Active Investment Advisors), publishes a weekly survey of its members and how much exposure they have to US equity markets.
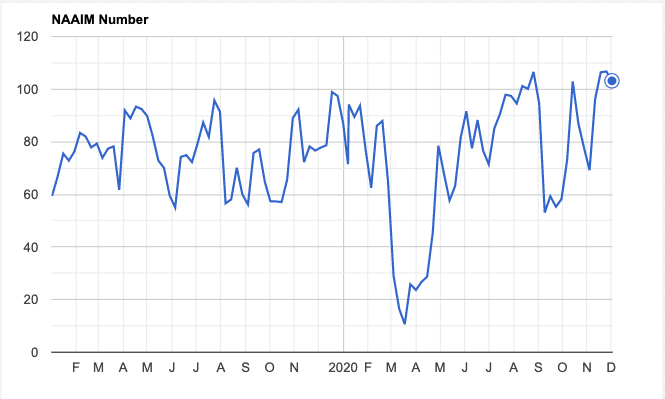
Source: NAAIM
NAAIM member firms who are active money managers are asked each week to provide a number which represents their overall equity exposure at the market close on a specific day of the week, currently Wednesdays.
Responses can vary widely as indicated below. Responses are tallied and averaged to provide the average long (or short) position of all NAAIM managers, as a group.
Range of Responses:
200% Leveraged Short
100% Fully Short
0% (100% Cash or Hedged to Market Neutral)
100% Fully Invested
200% Leveraged Long
Over the past 3 weeks, active investment managers in the NAAIM survey have carried a leveraged long position.
Using the backtest engine provided by the folks at Sentimentrader shows that, historically, this is a good sign for equities:
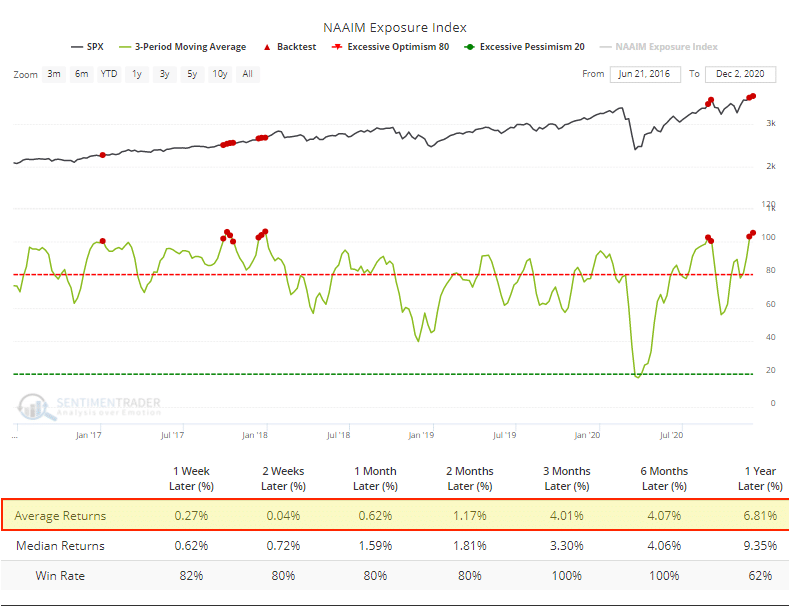
Source: Riverbend Investment Management, NAAIM, Sentimentrader
The Week Ahead:
Monday:
- U.S. Consumer Credit m/m 17.6 bln exp, 16.2 bln prior
Tuesday:
- German ZEW Economic Sentiment 45.2 exp, 39.0 prior
- U.S. NFIB Small Business Index 102.6 exp, 104.9 prior
Wednesday:
- German Trade Balance 17.0 bln exp, 17.8 bln prior
- U.S. JOLTs Job Openings 6.30 mln exp, 6.44 mln prior
- U.S. 10-year Note Auction 0.96% WI, 2.3 b/c prior
Thursday:
- UK Industrial Production m/m +0.3% exp, +0.5% prior
- ECB Monetary Policy Statement
- French Industrial Production m/m +0.4% exp, +1.4% prior
- U.S. CPI m/m +0.1% exp, 0.0% prior
- U.S. Core CPI m/m +0.1% exp, +0.0% prior
- U.S. Unemployment Claims 723k exp, 712k prior
Friday:
- U.S. Core PPI m/m +0.2% exp, +0.1% prior
- U.S. Prelim UoM Consumer Sentiment 76.1 exp, 76.9 prior


