U.S. Markets: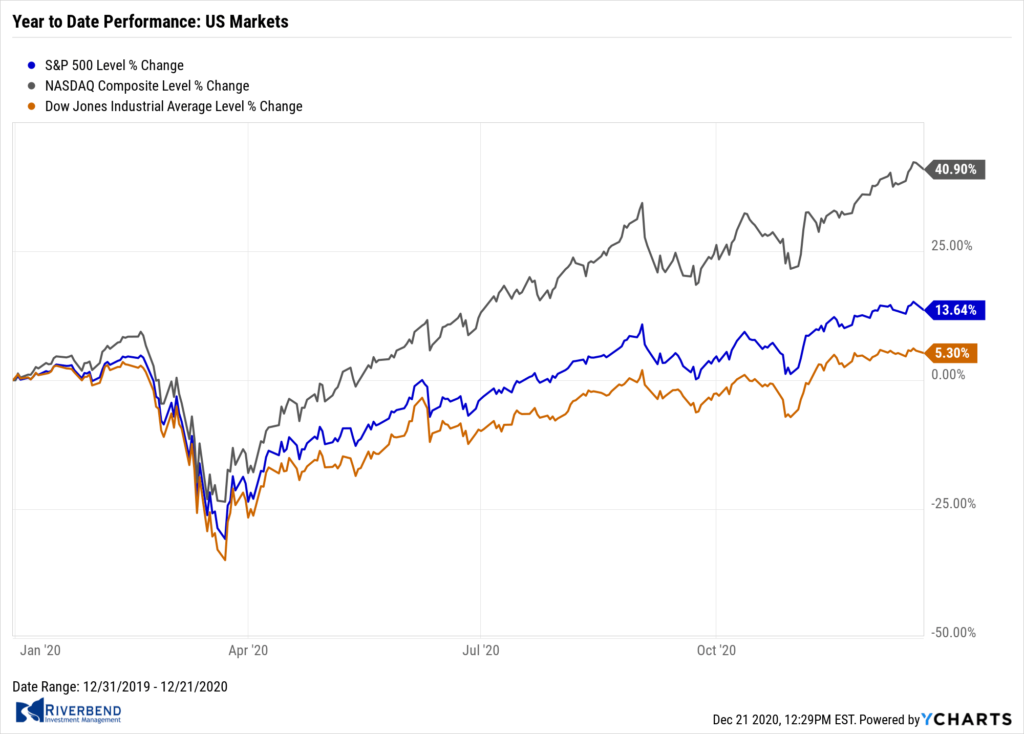
The major U.S. indexes reached record highs as expectations grew for the passage of another federal coronavirus relief package.
Information technology stocks outperformed within the S&P 500 Index, while energy stocks lagged despite oil prices touching nine-month highs.
The Dow Jones Industrial Average added 133 points finishing the week at 30,179, a gain of 0.4%.
The technology-heavy NASDAQ Composite rebounded 3.1% ending the week at 12,756.
By market cap, the large cap S&P 500 added 1.3%, while the mid cap S&P 400 and small cap Russell 2000 added 2.1% and 3.0%, respectively.
International Markets: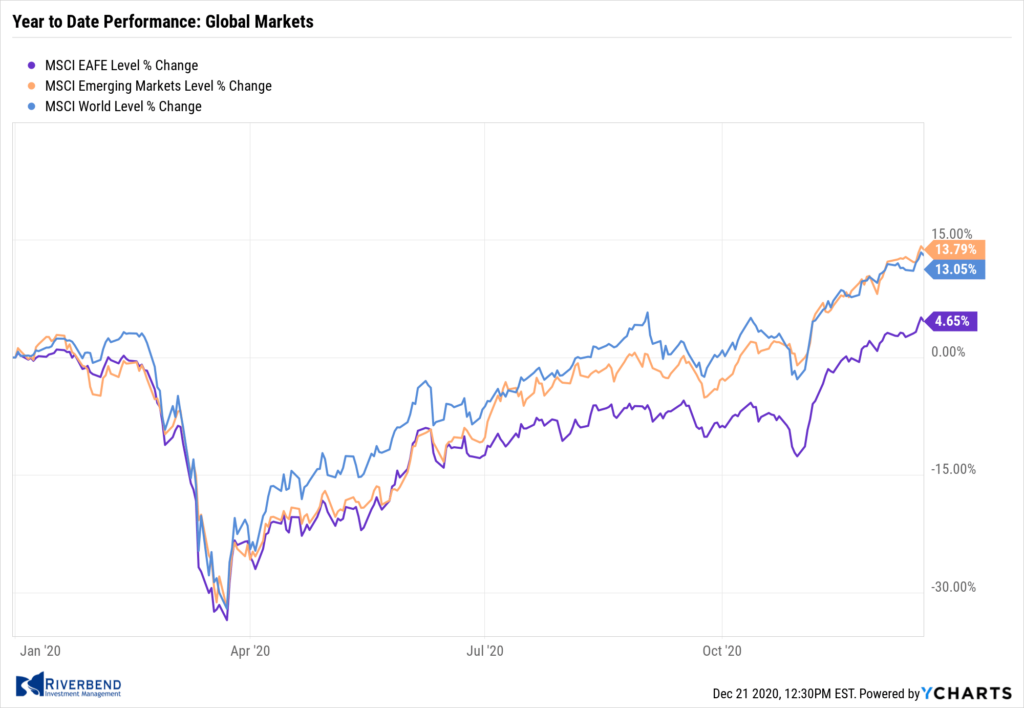
Canada’s TSX ticked down -0.1%, while across the Atlantic the United Kingdom’s FTSE 100 retreated -0.3%.
On Europe’s mainland France’s CAC 40 rose 0.4%, while Germany’s DAX vaulted 3.9%.
In Asia, China’s Shanghai Composite rallied 1.4% and Japan’s Nikkei added 0.4%.
As grouped by Morgan Stanley Capital International, developed markets added 1.7% and emerging markets rose 1.6%.
Commodities: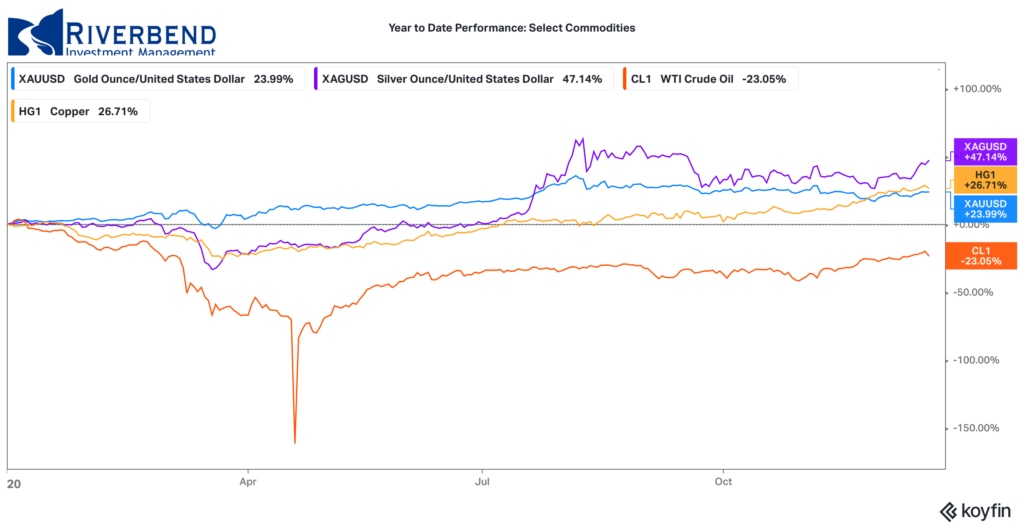
Precious metals enjoyed a week of solid gains. Gold rose 2.5% to $1888.90 per ounce, while Silver surged 8.1% to $26.03 per ounce.
Crude oil continued its rally off of pandemic lows. West Texas Intermediate crude oil climbed for a seventh consecutive week to $49.24—a gain of 5.7%.
The industrial metal copper, viewed by some analysts as a barometer of world economic health due to its wide variety of uses, also had its seventh week of gains rising 3.0%.
U.S. Economic News: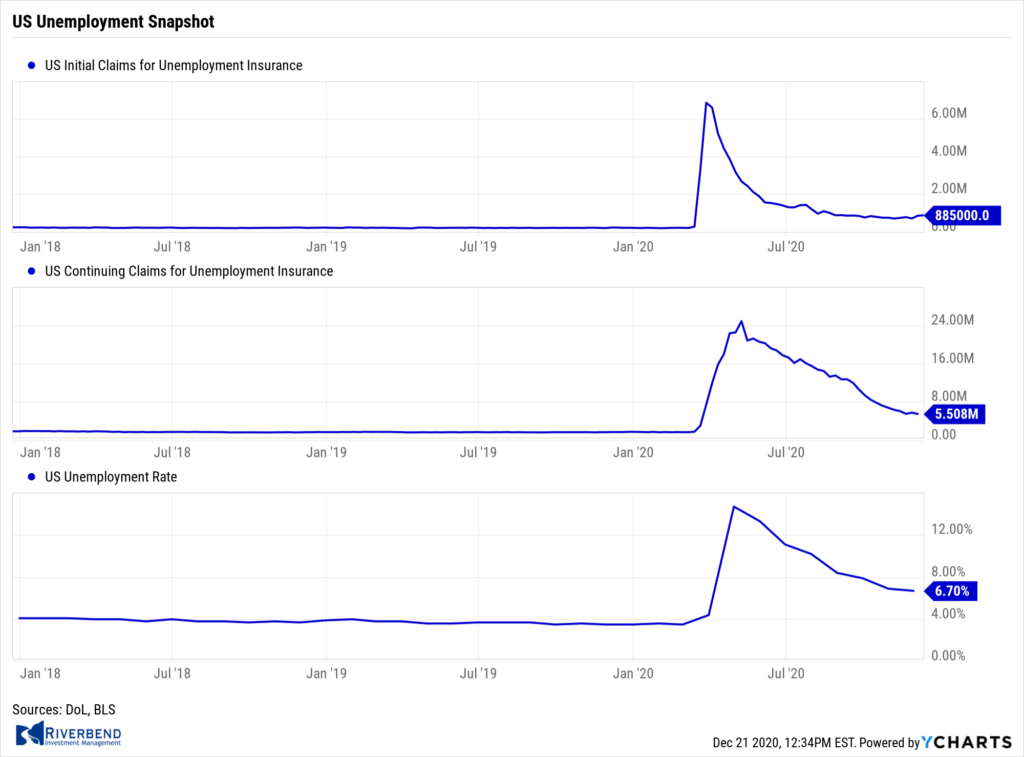
The number of Americans filing first-time claims for unemployment benefits hit a nearly 4-month high as a resurgence in the coronavirus triggered more layoffs. The Labor Department reported initial jobless claims climbed by 23,000 to 885,000 last week. Economists had expected new claims to fall to 818,000.
On a positive note, continuing claims, which counts the number of people already receiving benefits, fell by 273,000 to a seasonally-adjusted 5.51 million in the week ended December 5th. That’s a new pandemic low.
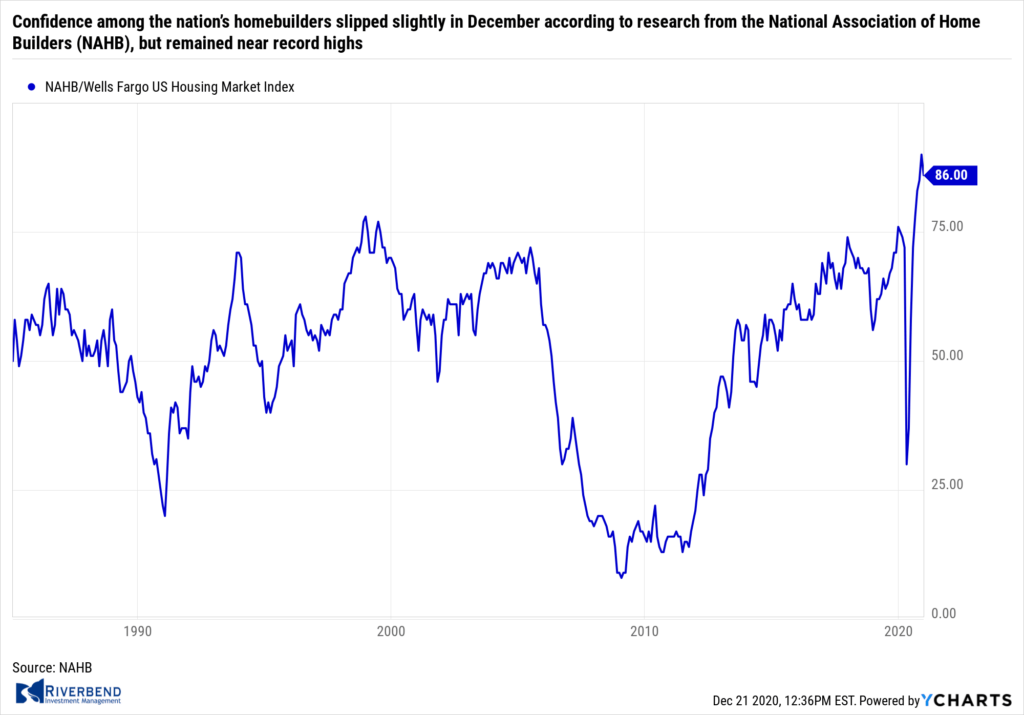 Confidence among the nation’s homebuilders slipped slightly in December according to research from the National Association of Home Builders (NAHB), but remained near record highs. The NAHB reported its monthly confidence index dropped four points to a reading of 86. This was the index’s first decline following three consecutive months of record highs. Even with December’s decline, the figure represents the second-highest reading in the index’s history.
In the report, the three main indicators that guide the overall index all decreased by four points from November’s reading. The index that measures sentiment regarding prospective buyer traffic came in at 73. The index of expectations for future sales over the next six months dropped to 85, and the gauge of current single-family home sales slipped to 92. Sentiment also declined across all parts of the country. The index fell by three points in Northeast, Midwest and South, and by two points in the West.
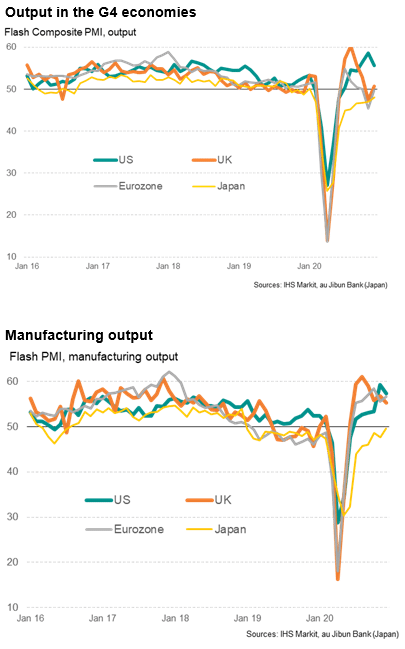
 A pair of preliminary surveys of U.S. businesses added to evidence that the economy is slowing in the wake of the resurgence of coronavirus. Analytics firm IHS Markit reported its “flash” survey of executives at services companies such as restaurants, health care providers, and financial firms fell 3.1 points to 55.3 this month. Although numbers over 50 indicate expansion, it was the weakest reading in three months.
A similar survey of manufacturers ticked down 0.2 points to 56.5. Chris Williamson, chief business economist at IHS Markit stated, “While vaccine developments mean some of the cloud caused by the pandemic should lift as we head through 2021, rising case numbers continue to darken the near-term outlook.”
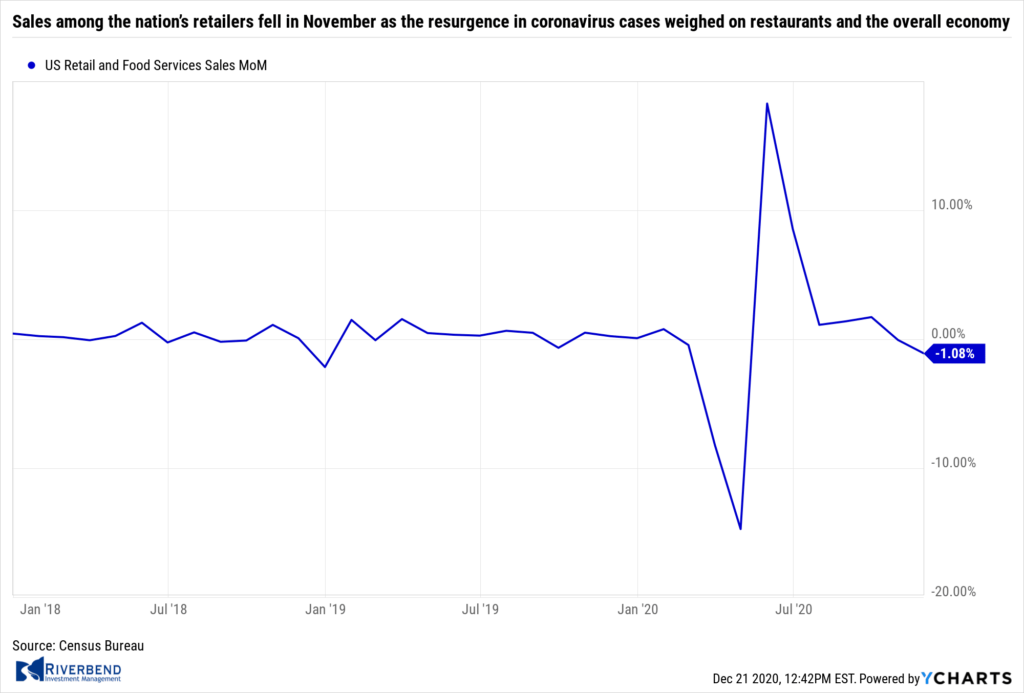 Sales among the nation’s retailers fell in November as the resurgence in coronavirus cases weighed on restaurants and the overall economy. The Census Bureau reported retail sales fell 1.1% last month, further than the 0.4% economists had predicted. Restaurants, auto dealers, gas stations, and department stores all reported lower sales.
The only segments to post higher sales were grocers, home centers, and internet retailers. Still, sales are up 29% from a year earlier because of an explosion in online shopping, accelerating a trend that’s been going on for years. The big losers in the transition have been traditional department stores. Sales sank 7.7% last month in that category.
 December marked the third consecutive month of slowing business activity in the New York region, according to the latest survey from the New York Fed. The NY Fed’s Empire State business conditions index slipped to 4.9 this month, down from 6.3 in November. Economists were expected a reading of 7.2. The Empire State index has fallen steadily after hitting 17 in September.
In the details, the new-orders index inched down 0.3 points to 3.4 in December while shipments rose 5.8 points to 12.1. Optimism about the six-month outlook rose 2.4 points to 36.3, suggesting firms remain optimistic about future conditions. Analysts aren’t expecting the sharp rebound in manufacturing to continue into the new year.
Oren Klachkin, lead U.S. economist at Oxford Economics stated, “Manufacturing’s strong performance this year isn’t likely to be repeated in 2021. An end to the health crisis is slowly coming into view, and we expect that less buoyant demand, some lingering Covid-related supply chain disruptions, and less stimulative fiscal policy will constrain manufacturing activity next year.”
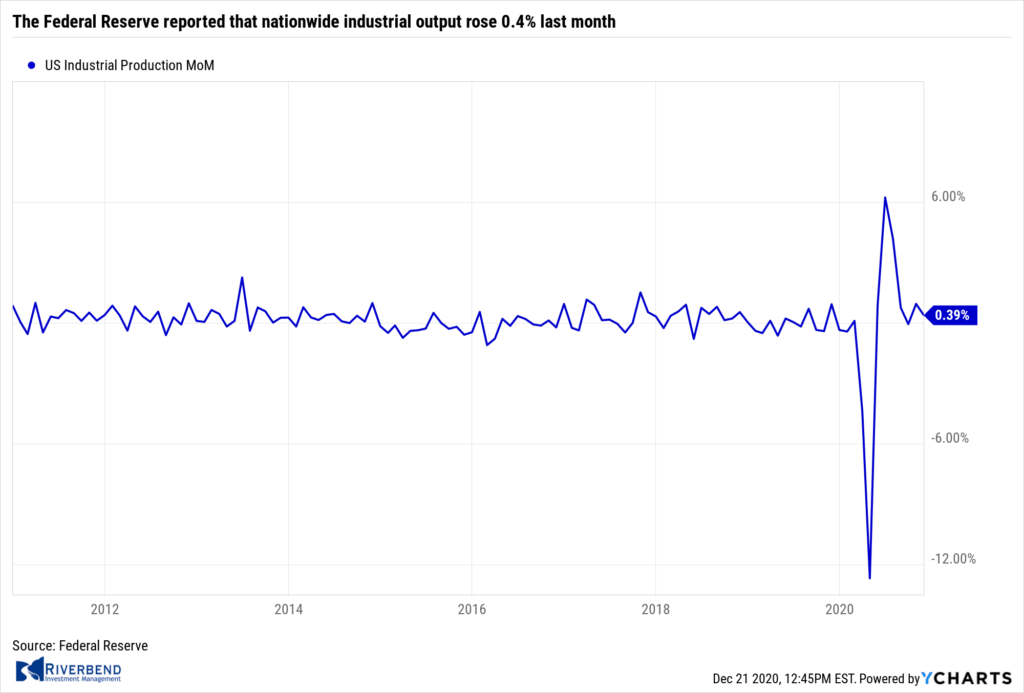 The Federal Reserve reported that nationwide industrial output rose 0.4% last month. Economists had expected an increase of just 0.2%. In the report, manufacturing activity advanced 0.8% last month, led by a strong 5.3% gain in motor vehicles and parts. However, utilities output declined 4.3% as warmer-than-usual temperatures reduced demand. Mining production and oil drilling rose 2.3% in November, following a 0.7% decline the prior month.
Analysts Michael Gapen, chief economist at Barclay’s and Gus Faucher, chief economist at PNC Financial Services Group, both put out research notes expecting manufacturing output to jump once the COVID-19 vaccine is widely available.
 The Federal Reserve announced it will keep buying bonds until it sees “substantial progress” in returning the economy to healthy growth and “stable” 2% inflation. At the conclusion of its two-day policy meeting, the central bank said it would continue to buy at least $80 billion per month of Treasury bonds and $40 billion of agency mortgage-backed securities. Previously the Fed had said the purchases would only continue through the “coming months”.
The Fed did not change its program to expand its purchases of more longer-dated paper, as some economists and traders had anticipated. With its policy interest rates pinned at zero, changes in asset purchases are one of the last remaining tools for Fed officials. “These asset purchases help foster smooth market functioning and accommodative financial conditions, thereby supporting the flow of credit to households and businesses,” the Fed statement said.
Chart of the Week:
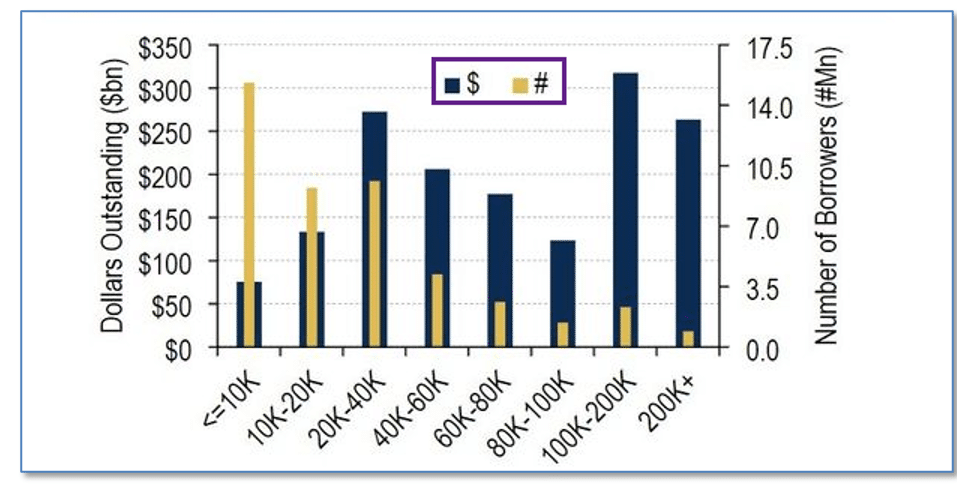 As President-elect Joe Biden prepares to take his place in the White House, calls for canceling all or at least a portion of U.S. student loans have risen to a fever pitch. With data from the U.S. Department of Education, analysts at Bank of America (BofA) found that only a relatively small group of borrowers owe the biggest chunks of debt—just 3.5 million borrowers owe more than $300 billion.
Each borrower in that group owes between $100,000 and $200,000. However, the biggest number of borrowers is found among those who owe less than $10,000.
So the largest number of borrowers, by far, could be helped by a forgiveness of, say, the first $10,000 of student debt. This might also avoid some of the “moral hazard” that would accompany outright forgiveness of larger debts. (Chart from Bank of America, Data from Department of Education)
Riverbend Indicators Update:

Each week we post notable changes to the various market indicators we follow.
- As a reading of our Bull-Bear Indicator for U.S. Equities (comparative measurements over a rolling one-year timeframe), we remain in Cyclical Bull territory.
- Counting-up of the number of all our indicators that are ‘Up’ for U.S. Equities, the current tally is that four of four are Positive, representing a multitude of timeframes (two that can be solely days/weeks, or months+ at a time; another, a quarter at a time; and lastly, the {typically} years-long reading, that being the Cyclical Bull or Bear status).
Observations:
Is the US stock market overbought?
In some areas of the market, the answer is yes. However, as we near the start of 2021, we are starting to see a rotation out of COVID winners into the areas of the market that were hit the hardest during 2020.
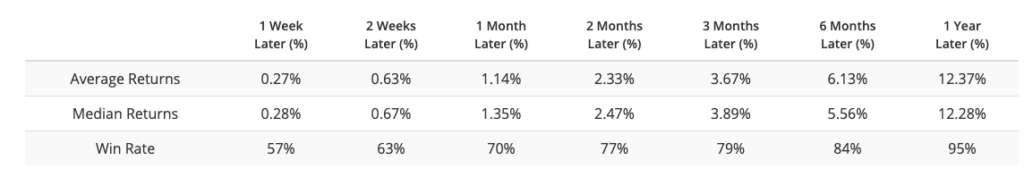
Of interest: when we take a look at the current breadth of the market vs a historical lookback (going back to 1962) and compare times with similar readings, we see that the market may still have room to move much higher. The average return of the S&P 500 during this lookback scenario had an average gain of 12.37% a year later.
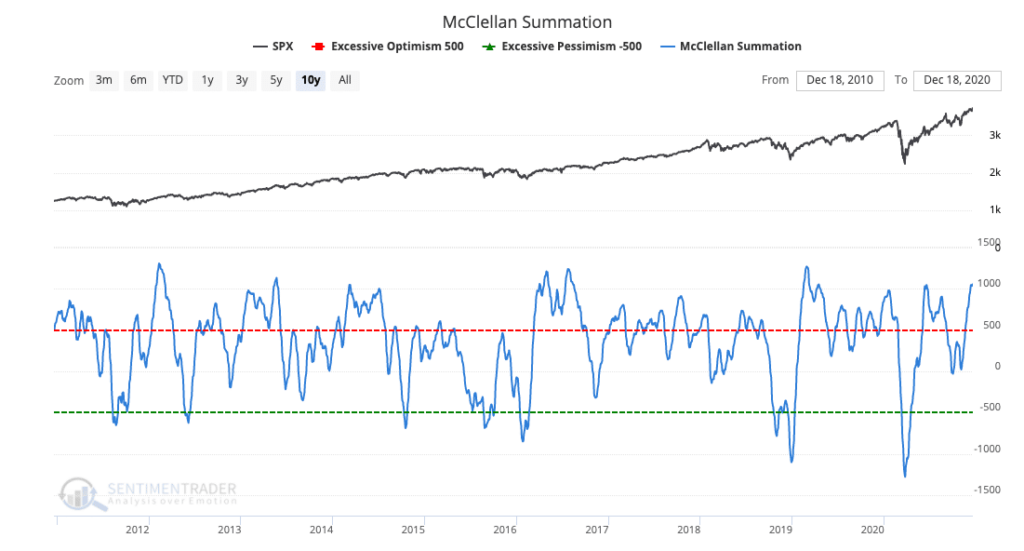
Source: Riverbend Investment Management, Sentimentrader
The Week Ahead:
Monday:
- Australia Retail Sales m/m +2.5% exp, +1.4% prior
Tuesday:
- U.S. CB Consumer Confidence 97.5 exp, 96.1 prior
- U.S. Existing Home Sales 6.70 mln exp, 6.85 mln prior
- Richmond Manufacturing Index 12 exp, 15 prior
Wednesday:
- U.S. Durable Goods Orders m/m +0.6% exp, +1.3% prior
- U.S. Core Durable Goods Orders m/m +0.5% exp, +1.3% prior
- U.S. Personal Spending -0.2% exp, +0.5% prior
- U.S. Personal Income -0.3% exp, -0.7% prior
- U.S. Flash Manufacturing PMI 56.0 exp, 56.7 prior
- U.S. Unemployment Claims 862k exp, 885k prior
- U.S. New Home Sales 990k exp, 999k prior
- UoM Consumer Sentiment (revision) 81.0 exp, 81.4 prior
Thursday:
- Japan Retail Sales y/y +1.8% exp, +6.4% prior
Friday: Market Closed


