[fusion_builder_container hundred_percent=”no” equal_height_columns=”no” menu_anchor=”” hide_on_mobile=”small-visibility,medium-visibility,large-visibility” class=”” id=”” background_color=”” background_image=”” background_position=”center center” background_repeat=”no-repeat” fade=”no” background_parallax=”none” parallax_speed=”0.3″ video_mp4=”” video_webm=”” video_ogv=”” video_url=”” video_aspect_ratio=”16:9″ video_loop=”yes” video_mute=”yes” overlay_color=”” video_preview_image=”” border_size=”” border_color=”” border_style=”solid” padding_top=”” padding_bottom=”” padding_left=”” padding_right=””][fusion_builder_row][fusion_builder_column type=”1_1″ layout=”1_1″ background_position=”left top” background_color=”” border_size=”” border_color=”” border_style=”solid” border_position=”all” spacing=”yes” background_image=”” background_repeat=”no-repeat” padding_top=”” padding_right=”” padding_bottom=”” padding_left=”” margin_top=”0px” margin_bottom=”0px” class=”” id=”” animation_type=”” animation_speed=”0.3″ animation_direction=”left” hide_on_mobile=”small-visibility,medium-visibility,large-visibility” center_content=”no” last=”no” min_height=”” hover_type=”none” link=””][fusion_text]
U.S. Markets: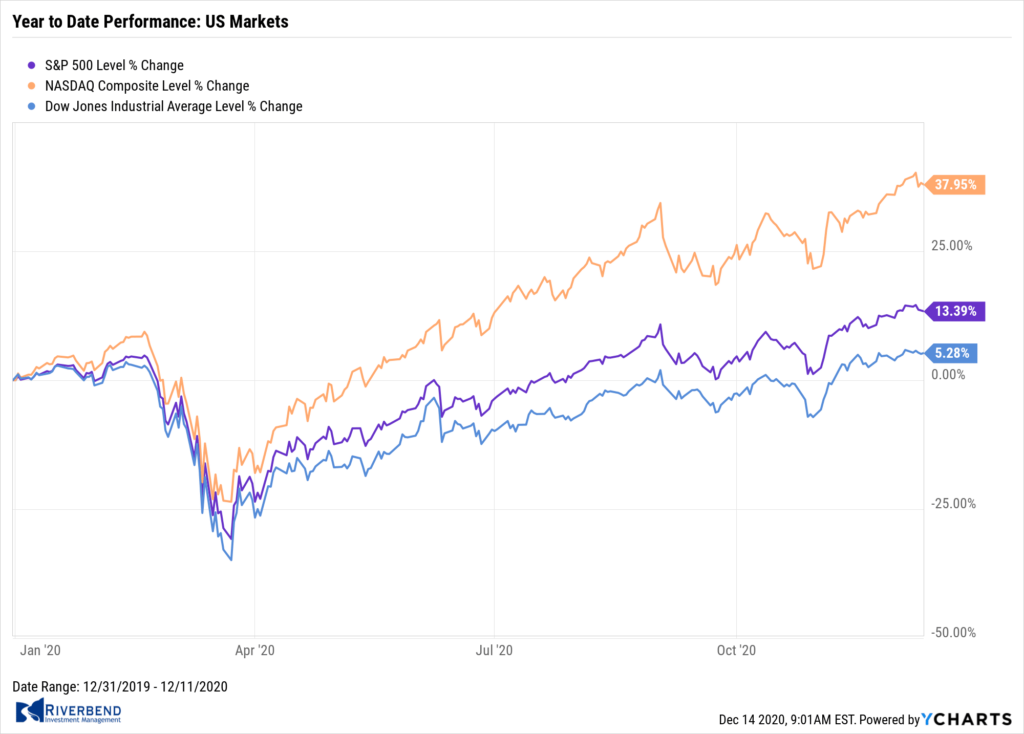
The major U.S. indexes hit new highs during the week, but pulled back to end the week mixed.
The small cap Russell 2000 outpaced the large cap S&P 500 for the fifth consecutive week, recording a modest gain.
Within the S&P 500 the energy sector continued to outperform by a wide margin as international (Brent) oil prices crossed $50 per barrel for the first time since the onset of the coronavirus pandemic.
The Dow Jones Industrial Average finished the week down -172 points to 30,046—a decline of -0.6%. The technology-heavy NASDAQ Composite retreated -0.7%.
By market cap, the S&P 500 ended the week down 1.0%, while the midcap S&P 400 ticked down -0.2%, and the small cap Russell 2000 finished the week up 1.0%.
International Markets: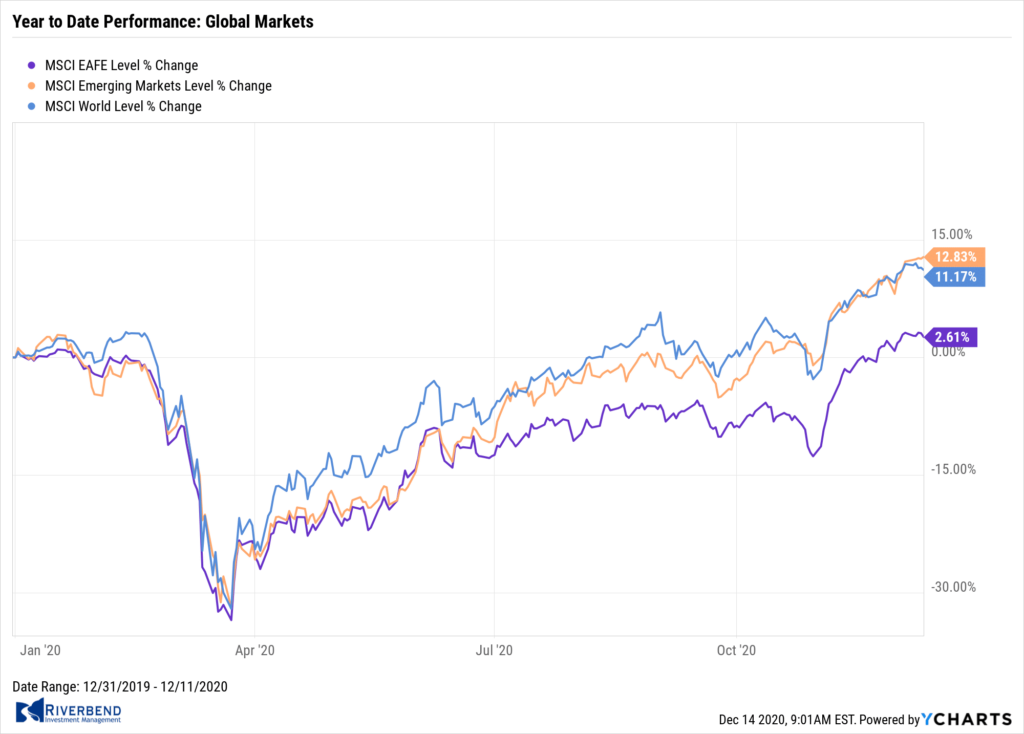
Canada’s TSX ended the week up 0.2%, but all other major international markets finished in the red.
The United Kingdom’s FTSE 100 ticked down -0.1%, while on Europe’s mainland France’s CAC 40 and Germany’s DAX declined -1.8% and -1.4%, respectively.
In Asia, China’s Shanghai Composite ended down -2.8%. Japan’s Nikkei gave up -0.4%.
As grouped by Morgan Stanley Capital International, developed markets retreated ‑0.5%, and emerging markets fell -0.3%.
Commodities: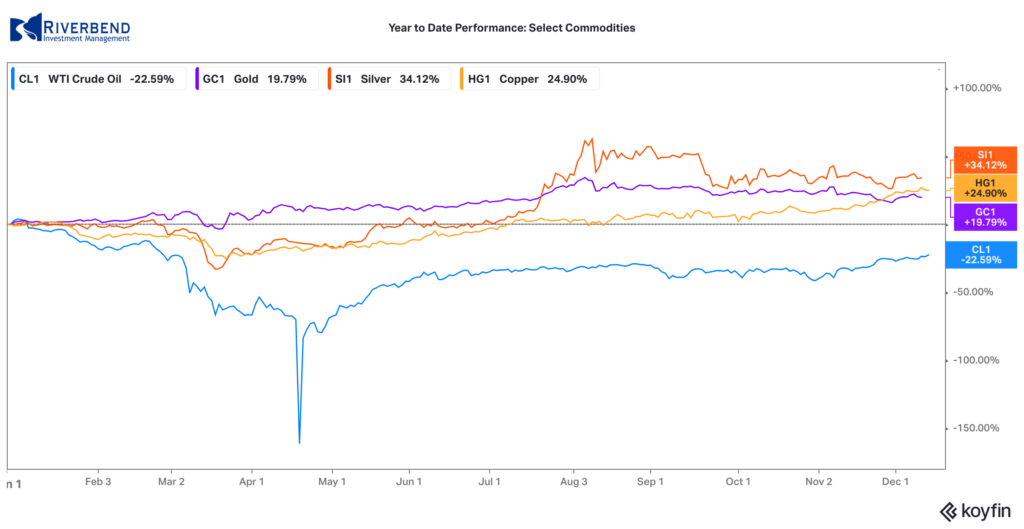
Precious metals were mixed on the week. Gold managed to close up for a second consecutive week, adding 0.2% to $1843.60 an ounce, while Silver retreated -0.7% to $24.09 an ounce.
West Texas Intermediate crude oil climbed for a sixth consecutive week closing at $46.57 per barrel, a gain of 0.7%.
The industrial metal copper, viewed by some analysts as a barometer of world economic health due to its wide variety of uses, also rose for a sixth week up 0.1%.
U.S. Economic News: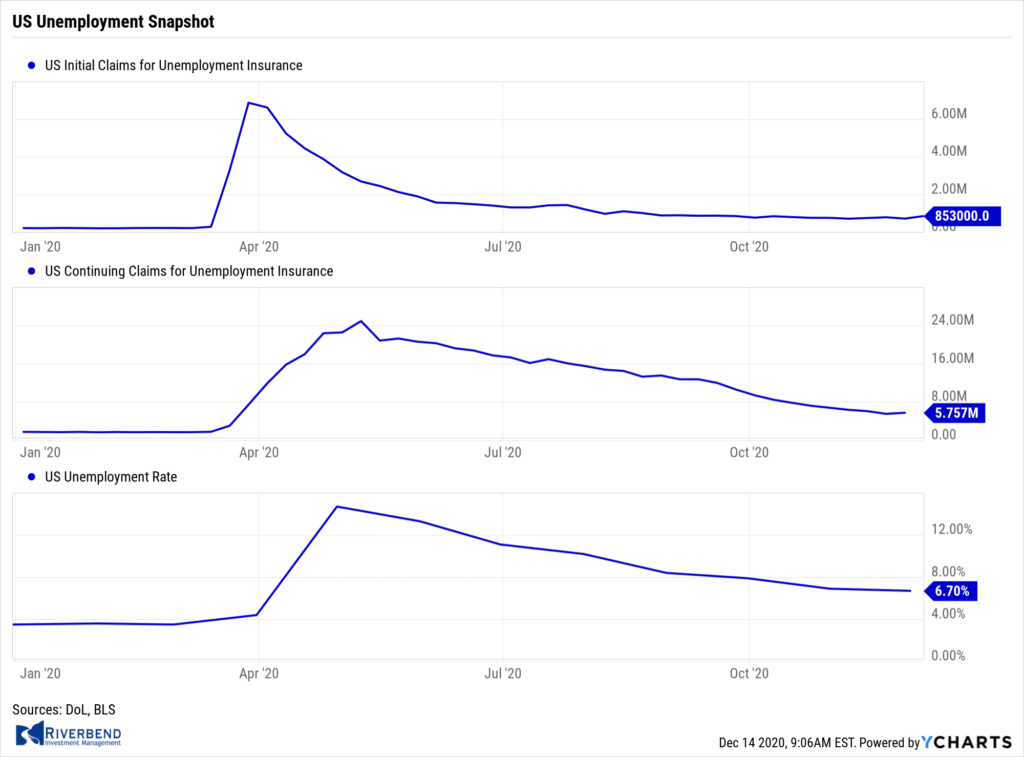
The Bureau of Labor Statistics reported new applications for unemployment benefits jumped to a nearly three-month high last week after a record surge in coronavirus cases and filing delays tied to the Thanksgiving holiday. Initial jobless claims surged by 137,000 to 853,000. Economists had expected new claims to total a seasonally adjusted 720,000. New jobless claims rose the most in the states of California, Texas, Illinois and New York where coronavirus cases have risen again.
Continuing claims, which counts the number of Americans already receiving benefits, climbed by 230,000 to a seasonally-adjusted 5.76 million. Analysts noted the increase doesn’t bode well for an improving jobs picture going into December. Robert Frick, corporate economist at Navy Federal Credit Union stated, “Given Covid-19 cases and deaths are now regularly setting new highs, these reports put into question job growth in December, especially given the rapid slowdown in growth in November.”
The number of job openings in the United States rose slightly, but the number of Americans being laid off rose even faster the Labor Department reported. Job openings ticked up to 6.65 million from 6.45 million in October, with about 5.8 million people being hired. However, separations—layoffs, firings, and retirements, rose as well to 5.1 million. By sector, job openings rose the most in health care and manufacturing, while retail declined the most. Retailers have continued to be one of the sectors hardest hit by the pandemic. Furthermore, retailers are expected to hire fewer people this holiday season. The “quits” rate, rumored to be closely watched by the Federal Reserve as providing a more accurate reading of the status of the labor market, remained unchanged at 2.4% among private-sector employees.
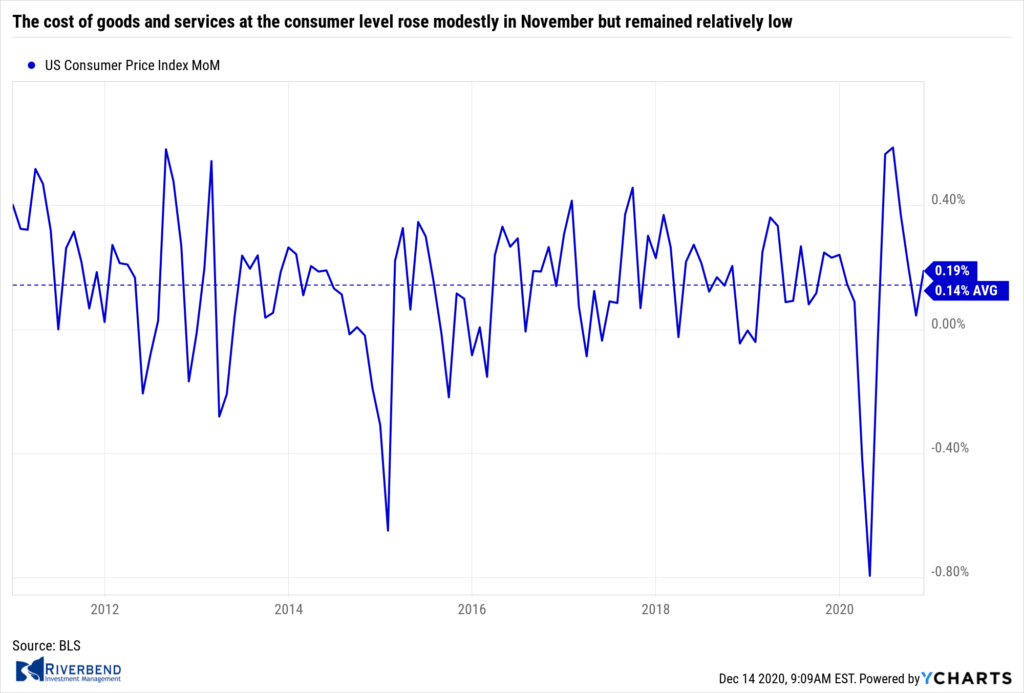 The cost of goods and services at the consumer level rose modestly in November but remained relatively low. The Bureau of Labor Statistics reported the consumer price index increased 0.2% in November, a tick above economists’ estimates. The pace of inflation over the past year remained unchanged at 1.2%. For reference, consumer inflation had been running at a much higher 2.3% just prior to the pandemic outbreak. A separate measure of inflation that strips out the often-volatile food and energy categories known as the “core rate” also rose 0.2% last month. The core rate has risen 1.6% in the past year.
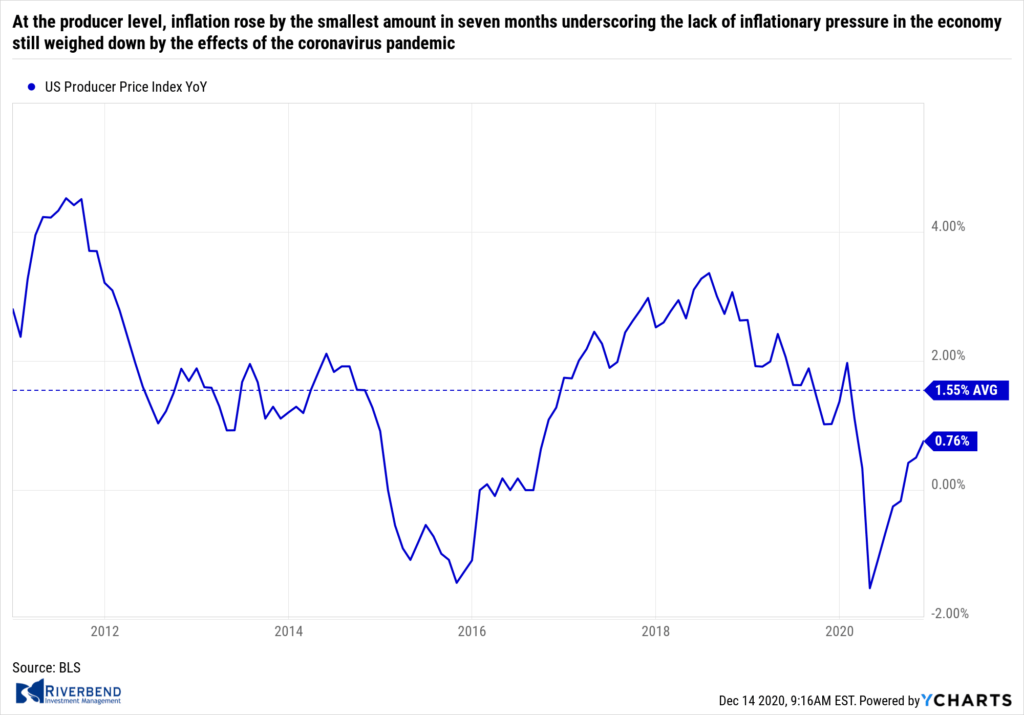
At the producer level, inflation rose by the smallest amount in seven months underscoring the lack of inflationary pressure in the economy still weighed down by the effects of the coronavirus pandemic. The Labor Department reported the Producer Price Index ticked up 0.1% this week, matching forecasts. Over the past year, wholesale inflation is up just 0.8%. That number had been growing at an annual rate of 2% in January—shortly before the coronavirus pandemic emerged. Higher prices for goods, mainly energy, were the biggest contributor to the increase in wholesale costs last month, the government said. Another measure of wholesale inflation that’s less prone to sharp swings, known as the core rate, also increased 0.1% last month. The core rate has risen just 0.9% in the past year, a tick higher than in October.
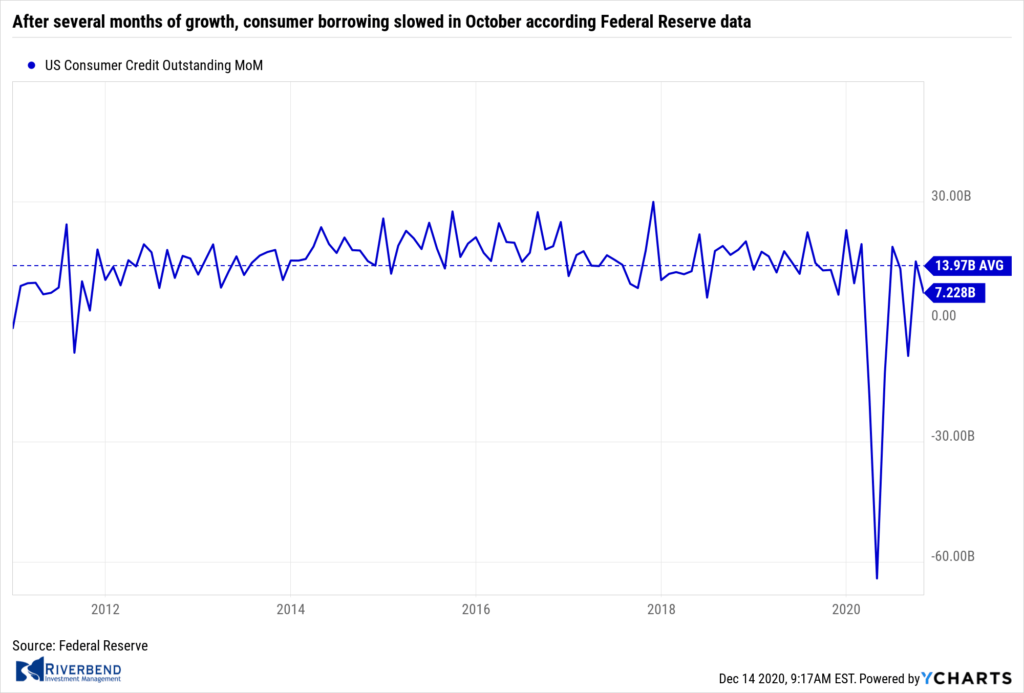
After several months of growth, consumer borrowing slowed in October according Federal Reserve data. Total consumer credit increased by $7.2 billion bringing annual growth to 2.1%. That was down from a $15 billion gain in September. Economists had expected the strength in September to continue estimating a $17 billion increase. Revolving credit, like credit cards, fell 6.7% in October after a 3.2% jump in the prior month. Non-revolving credit, typically auto and student loans, rose at a 4.8% rate after a 4.7% rate in September. Separate data from the New York Fed found that credit-card balances fell by $10 billion in the third quarter after a record $76 billion decline in the second quarter. The data does not include mortgage loans, which is the largest component of household debt. Mortgage originations came in at $1 trillion in the third quarter, the second largest quarterly increase on record, the New York Fed said.
Chart of the Week: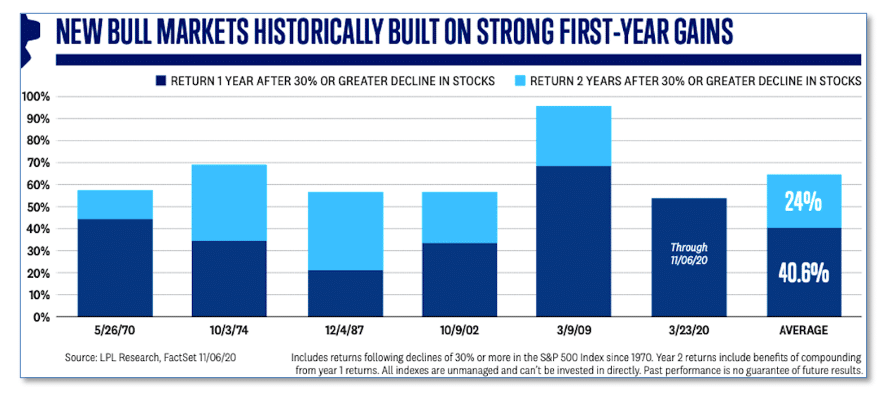
Almost all major U.S. stock indexes have hit all-time highs recently, prompting the question “how much longer can this go on?”
Analysts at LPL Financial addressed this question in its latest 2021 market outlook and it is good news for market bulls.
LPL analysts write: “Reviewing some of the previous major bear market lows—most recently in March 2009—reveals that stocks tended to add gains well after the initial surge.”
As seen in the chart above, the 2nd year gains (shown in light blue) following a decline of 30% or more continue to be strong, averaging an additional 24%, and none were negative going back to 1970. (Data from FactSet, chart from LPL Research)
Riverbend Indicators Update:

Each week we post notable changes to the various market indicators we follow.
- As a reading of our Bull-Bear Indicator for U.S. Equities (comparative measurements over a rolling one-year timeframe), we remain in Cyclical Bull territory.
- Counting-up of the number of all our indicators that are ‘Up’ for U.S. Equities, the current tally is that four of four are Positive, representing a multitude of timeframes (two that can be solely days/weeks, or months+ at a time; another, a quarter at a time; and lastly, the {typically} years-long reading, that being the Cyclical Bull or Bear status).
Observations:
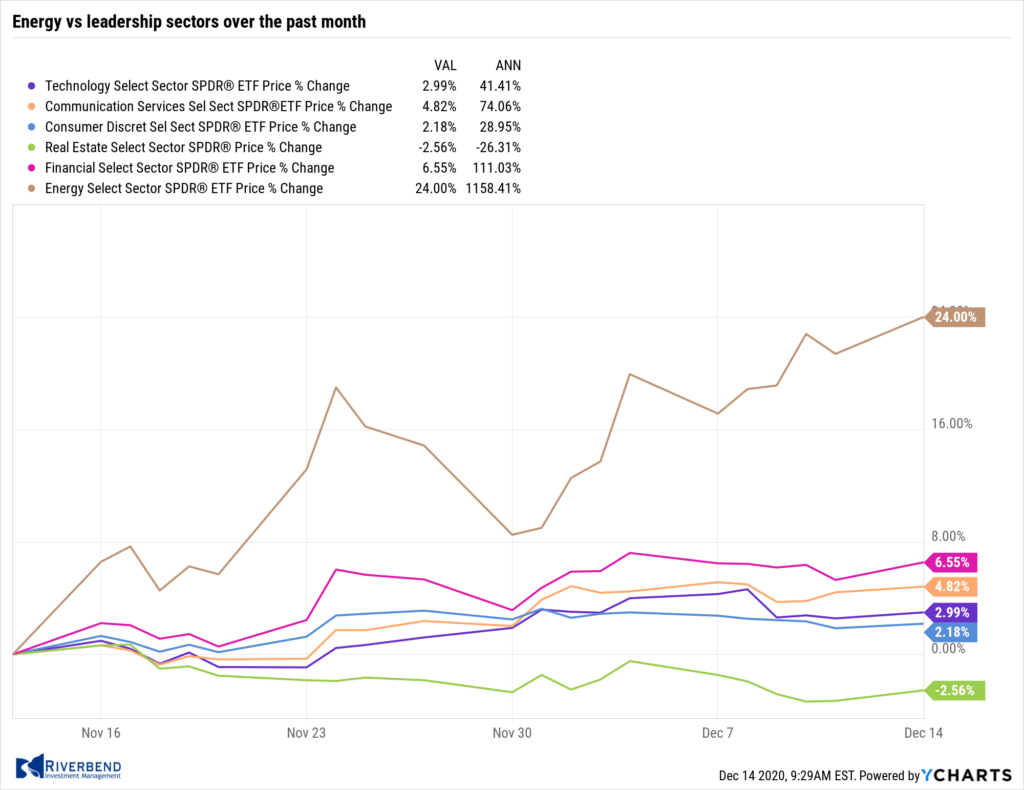
The big story in the markets has been how the energy sector is trying to catch up.
The energy sector tried to play catch up earlier in the summer as COVID restrictions loosened up. Now, traders are looking forward to next year — hoping the US economy will quickly re-open as the COVID vaccine is distributed:
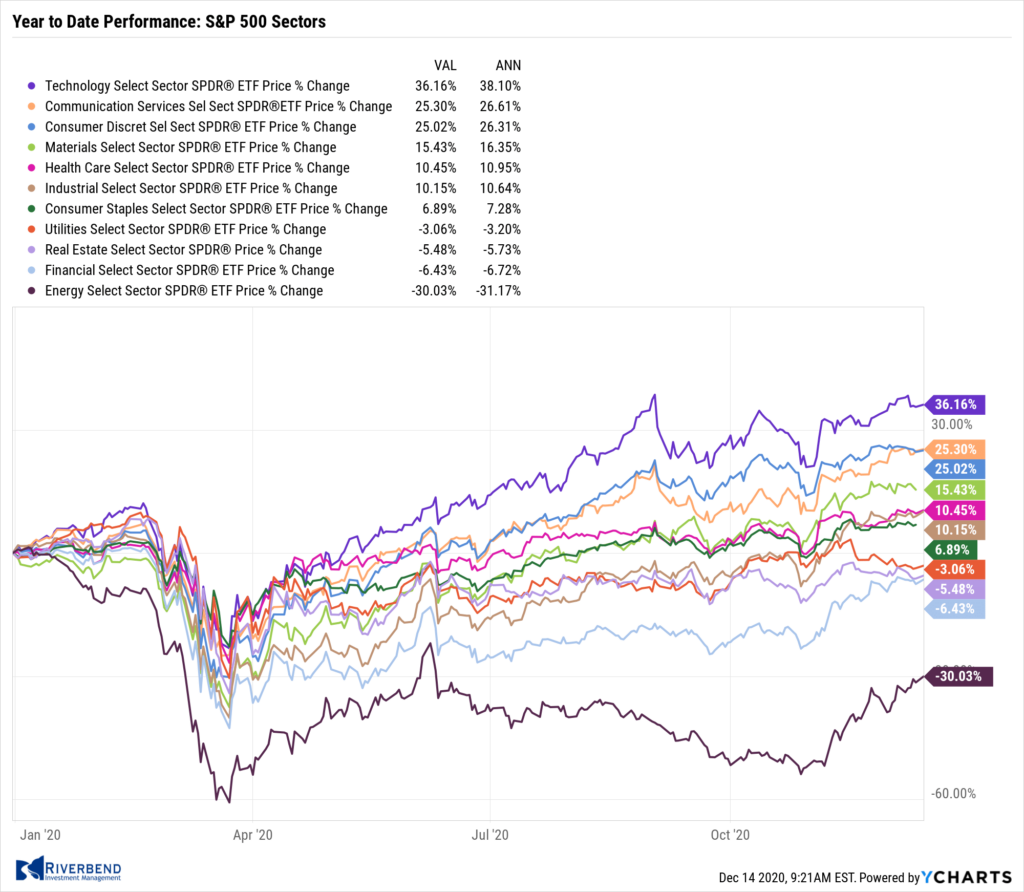
Interestingly, the energy catch up trade has not negatively impacted this year’s leadership sectors. This may be an indication that there is still a lot of money sitting on the sidelines, waiting to enter the market.
The Week Ahead:
Monday:
- China Industrial Production y/y +7.0% exp, +6.9% prior
- China Retail Sales y/y +5.1% exp, +4.3% prior
Tuesday:
- Empire State Manufacturing Index 6.9 exp, 6.3 prior
- U.S. Industrial Production m/m +0.3% exp, +0.1% prior
Wednesday:
- French Flash Services PMI 39.1 exp, 38.8 prior
- German Flash Manufacturing PMI 56.2 exp, 57.8 prior
- U.S. Retail Sales m/m -0.2% exp, +0.2% prior
- U.S. Flash Manufacturing PMI 56.0 exp, 56.7 prior
- U.S. Flash Services PMI 55.9 exp, 58.4 prior
- U.S. NAHB Housing Market Index 88 exp, 90 prior
- Federal Reserve Statement and Economic Projections
Thursday:
- U.S. Unemployment Claims 780k exp, 853k prior
- U.S. Housing Starts 1.53 mln exp, 1.53 mln prior
- U.S. Building Permits 1.55 mln exp, 1.54 mln prior
Friday:
- U.S. CB Leading Index m/m +0.4% exp, +0.7% prior
[/fusion_text][/fusion_builder_column][/fusion_builder_row][/fusion_builder_container]


