U.S. Markets: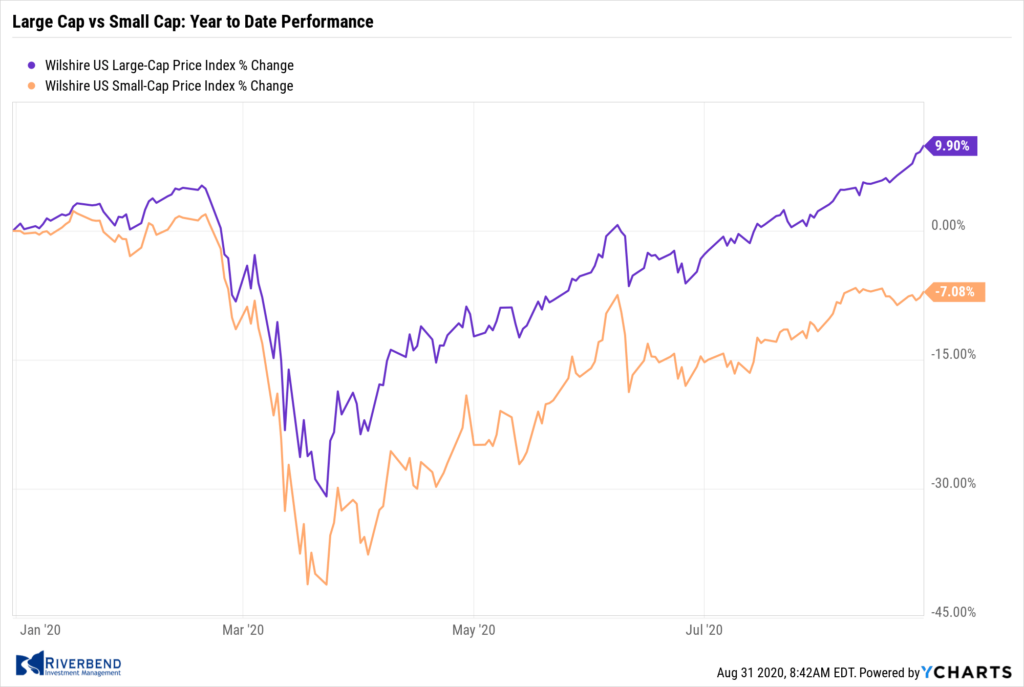
U.S. stocks continued to grind higher on largely positive news flow about potential vaccines and treatments for COVID-19. Continuing the recent prevailing trend, higher-valuation growth stocks outperformed lower-priced value companies and large-cap companies easily outpaced small-caps.
The Dow Jones Industrial Average added 724 points finishing the week at 28,654, a gain of 2.6%. The technology-heavy NASDAQ Composite rose for a fifth consecutive week, gaining 3.4%.
By market cap, the large cap S&P 500 added 3.3%, while the mid cap S&P 400 and small cap Russell 2000 indexes finished up 1.9% and 1.7%, respectively.
International Markets: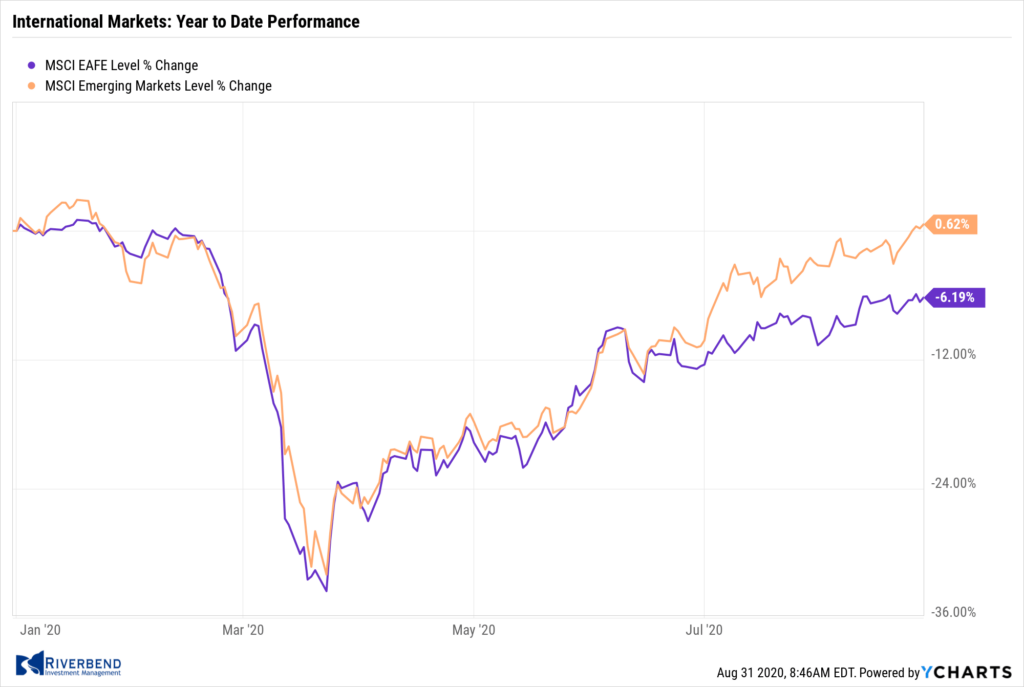
Canada’s TSX rose 1.1%, while the United Kingdom’s FTSE 100 finished down for a second week, giving up -0.6%.
On Europe’s mainland, France’s CAC 40 and Germany’s DAX gained 2.2% and 2.1%, respectively, while Italy’s Milan FTSE added 0.7%.
In Asia, China’s Shanghai Composite rose 0.7%. Japan’s Nikkei declined for a second week, finishing down -0.2%.
As grouped by Morgan Stanley Capital International, developed markets rose 1.6%, while emerging markets rose 2.9% – the fifth consecutive week of gains for emerging markets.
Commodities: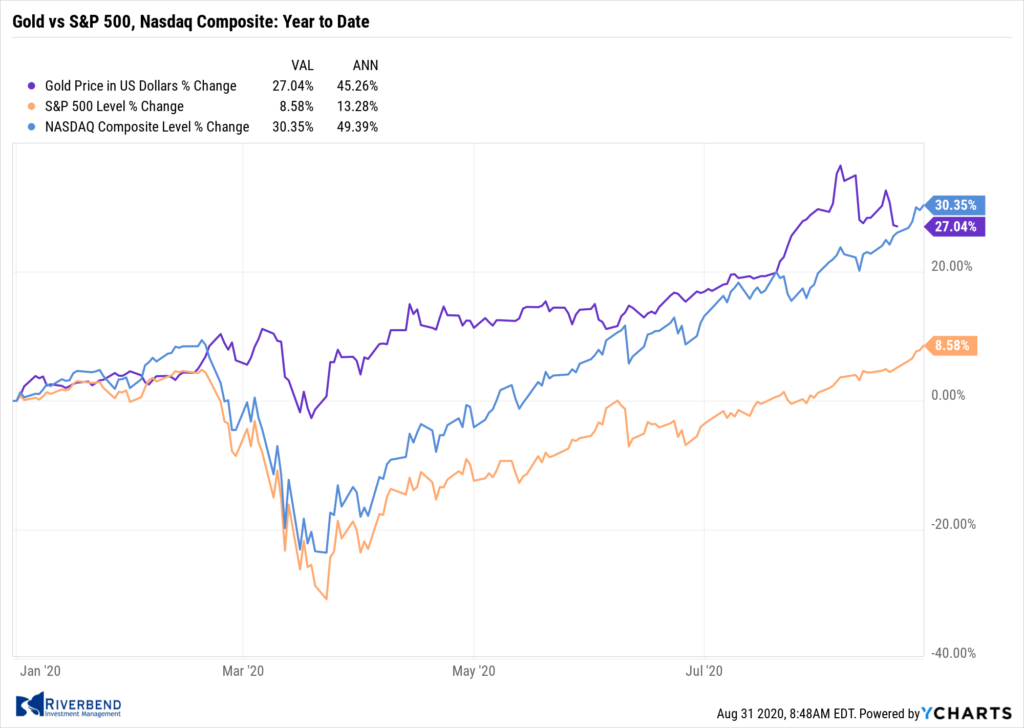
Precious metals finished the week to the upside. Gold rose $27.90 to $1974.90 an ounce, a gain of 1.4%. Silver had its second week of gains, rising 4% to $27.79 an ounce.
Oil rose for a fourth consecutive week, rising 1.5% to $42.97 a barrel for West Texas Intermediate crude.
The industrial metal copper, seen by analysts as a barometer of global economic health due to its wide variety of uses, rose 3.5% – its third consecutive week of gains.
U.S. Economic News:
The number of Americans seeking first-time unemployment benefits fell last week, resuming its downward trend. The Labor Department reported initial jobless claims declined by 98,000 to 1 million matching the consensus forecast.
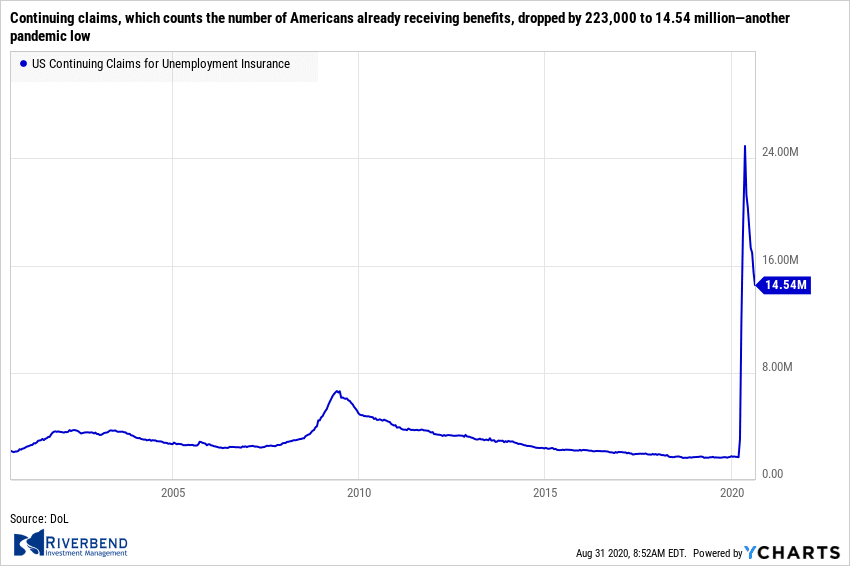 Continuing claims, which counts the number of Americans already receiving benefits, dropped by 223,000 to 14.54 million—another pandemic low. It was its fourth straight decline.
Rubeela Farooqi, chief U.S. economist at High Frequency Economics wrote in a note to clients, “The risk of permanent damage to the labor market remains high, which will slow the pace of recovery. The return to pre-pandemic levels of prosperity is set to be an uncertain and prolonged process.”
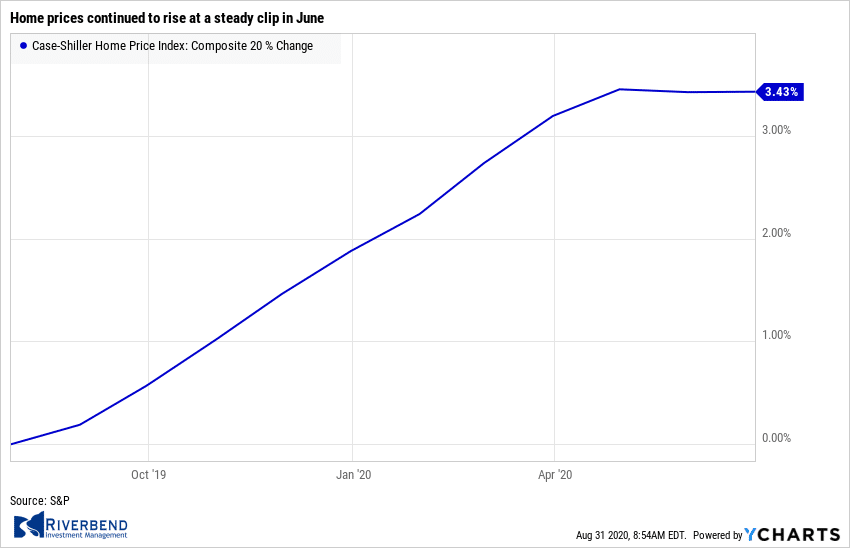 Home prices continued to rise at a steady clip in June, according to the latest data from S&P Case-Shiller. The S&P CoreLogic Case-Shiller 20-city price index is up 3.5% compared to the same time last year. That’s down a tick from the previous month. On a monthly basis, the index increased 0.2% between May and June. Separately, the national index showed a 4.3% increase in home prices across the country over the past year. That remained unchanged from the rate of price growth in May.
In the report, Phoenix continued to lead all nationwide with a 9% annual price gain in May, followed by Seattle (up 6.5%) and Tampa (up 5.9%). Craig Lazzara, managing director and global head of index investment strategy at S&P Dow Jones Indices, wrote in the report, “As has been the case for the last several months, prices were particularly strong in the Southeast and West, and comparatively weak in the Midwest and (especially) Northeast.”
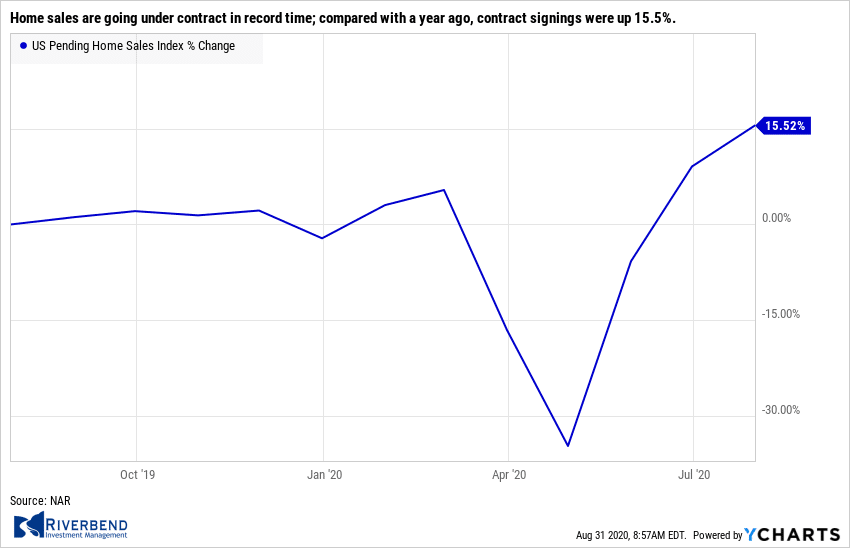 The number of homes in which a contract has been signed but not yet closed rose last month according to the latest data from the National Association of Realtors (NAR). The NAR reported pending home sales rose 5.9% in July compared to June. It was the third consecutive increase in pending home sales. Furthermore, home sales are going under contract in record time, the trade group reported.
Compared with a year ago, contract signings were up 15.5%. “We are witnessing a true V-shaped sales recovery as homebuyers continue their strong return to the housing market,” Lawrence Yun, the National Association of Realtors’ chief economist, said in the report.
Sales of new single-family homes increased for the third consecutive month, the U.S. Census Bureau reported. New single-family home sales rose 14% in July to a seasonally-adjusted annual rate of 901,000. Compared with the same time last year, new home sales were up 36%.
Economists had expected a median pace of new home sales of 790,000. The surge in sales was driven by a nearly 59% increase in the Midwest month-over-month. Sales also increased on a monthly basis in the South and the West, but fell by 23% in the Northeast. The median sales price in July was $330,600, up 7% from a year ago.
The inventory of new homes fell to just 299,000, representing a 4-month supply. That’s down from a 4.6-month supply in June. A 6-month supply is generally considered a balanced housing market.
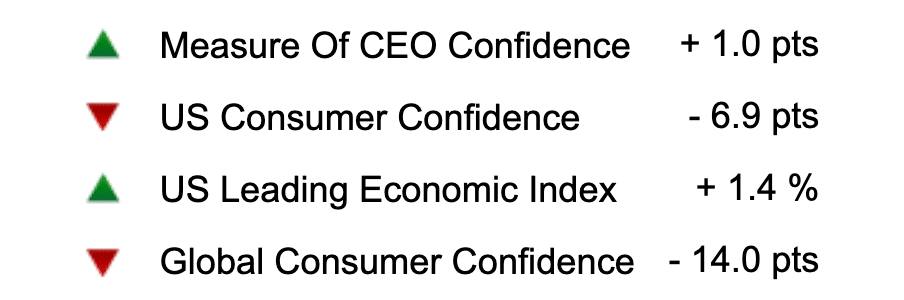
Source: The Conference Board
Confidence among the nation’s consumers fell to a new pandemic low following a resurgence of coronavirus cases. The Conference Board reported its index of Consumer Confidence sank 6.9 points to a six-year low of 84.8 this month. Economists had expected the index to rise to 93.0. Analysts believe the unexpected plunge may be due to the expiration of the $600 per week federal unemployment stipend.
President Trump has since authorized temporary $300 payments, but not every state is providing the money. A pair of other consumer surveys, meanwhile, seem to suggest confidence is starting to mend again. The consumer sentiment index produced by the University of Michigan edged up slightly in August, though it was still quite low. And the daily tracker by Morning Consult has been creeping higher in the past two weeks.
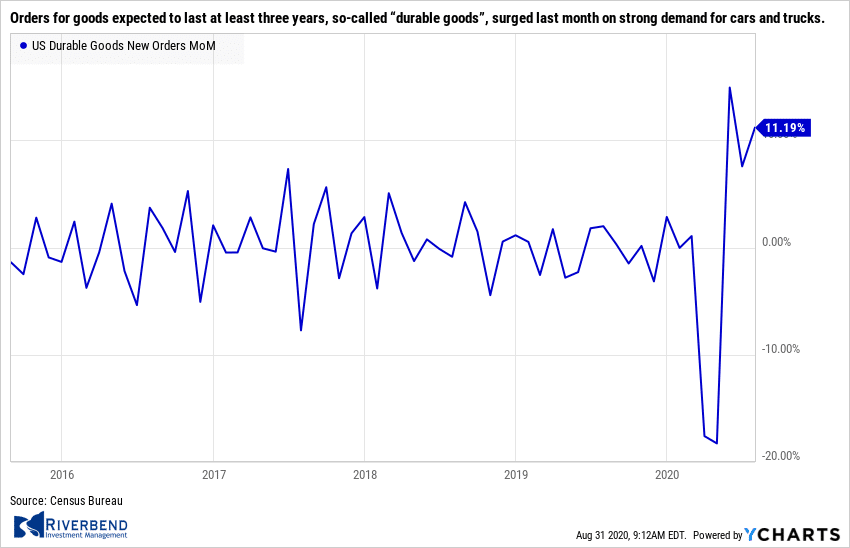 Orders for goods expected to last at least three years, so-called “durable goods”, surged last month on strong demand for cars and trucks. The Commerce Department reported Durable-goods orders rose 11.2% in July due to strong consumer demand for cars and trucks.
However, analysts noted spending outside the auto industry was softer and the pace of investment slowed. The increase easily topped economists’ forecasts of a 4.8% increase. New orders ex‑transportation orders rose a smaller 2.4%. Auto sales have been surprisingly strong during the summer as Americans took advantage of low interest rates and discounted pricing. Bookings in July were actually higher last month compared to July 2019.
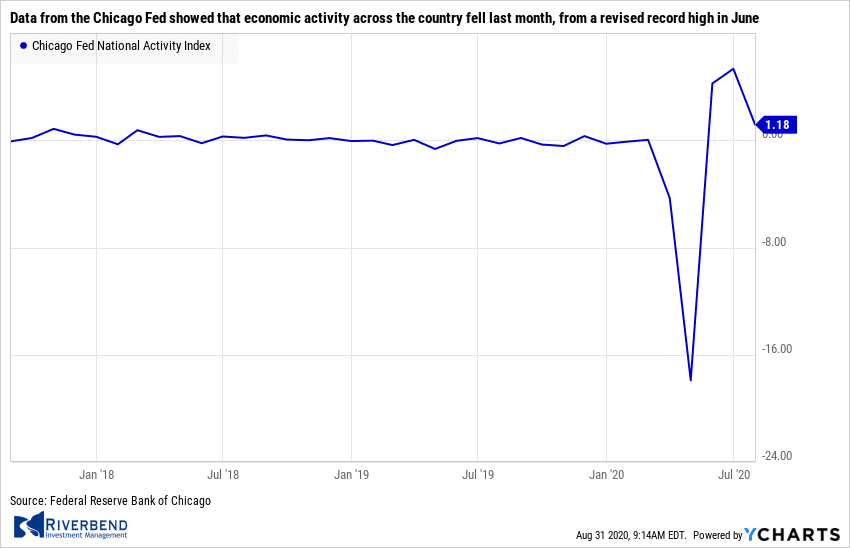 Data from the Chicago Fed showed that economic activity across the country fell last month, from a revised record high in June. The Chicago Federal Reserve reported its National Activity Index declined to 1.18 in July, although its three-month moving average rose into expansion to 3.59 from -2.78 the prior month.
The index is designed so that a zero value indicates the national economy is expanding at its historic trend rate of growth. The Chicago Fed index is a weighted average of 85 economic indicators. In the report, fifty-six made positive contributions in July. Production-related indicators contributed 1.09 to the overall index in July, down from 2.21 in the prior month while employment-related indicators added 0.38, down from 1.94 in June.
The Federal Reserve laid out a new strategy that allows inflation to run higher than traditional levels
At its latest Jackson Hole conference, the Federal Reserve laid out a new strategy that allows inflation to run higher than traditional levels, a move widely seen as leading to an easier monetary stance over time. In its new policy framework, agreed to by all 17 top officials, the central bank stated, “The Committee seeks to achieve inflation that averages 2% over time and therefore judges that, following periods when inflation has been running persistently below 2%, appropriate monetary policy will likely aim to achieve inflation moderately above 2% for some time.” The Fed also removed its bias against strong labor markets. In his speech, Powell announced the changes, saying “a robust job market can be sustained without causing an outbreak in inflation.”
Chart of the Week:
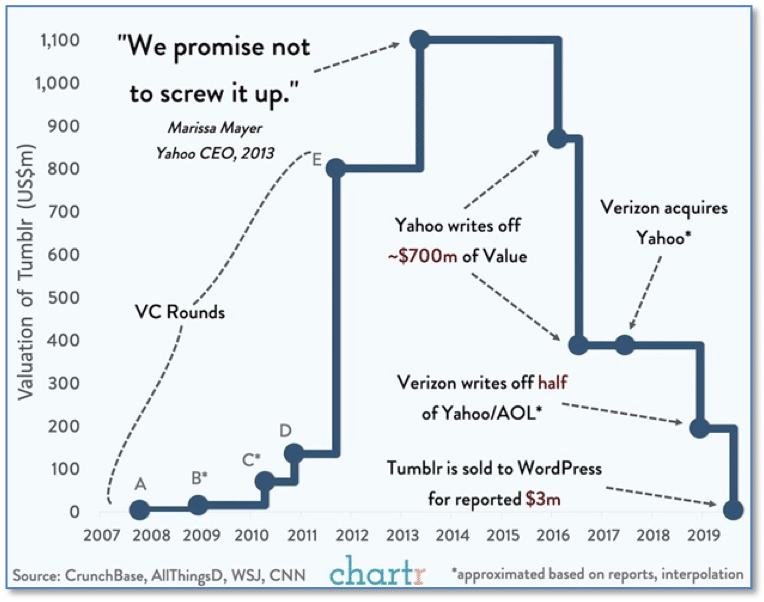
Onetime social media star Tumblr, which reached a peak valuation of over $1.1 billion, was sold to its long-time competitor WordPress for a paltry $3 million in 2019.
The site was launched in 2007 by (then) 20-year old David Karp, with the intent of offering users an easier “less-techy” blogging experience. The site quickly picked up steam as popular bloggers, musicians, writers, and social-media influencers moved their content over to Tumblr. The popularity paid off.
In 2013, Yahoo bought Tumblr for $1.1 billion, with Yahoo CEO Marissa Mayer promising “not to screw it up”. However, in the following years Tumblr struggled to compete with rising social media giants like Facebook, Twitter, and Instagram.
The final nail in Tumblr’s coffin came when it banned porn-related material, which turned out to be a primary attraction for the majority of its remaining users. Traffic plummeted, monthly views dropped by hundreds of millions, and its fate was sealed. (Chart from chartr.co)
Riverbend Indicators Update:

Each week we post notable changes to the various market indicators we follow.
- As a reading of our Bull-Bear Indicator for U.S. Equities (comparative measurements over a rolling one-year timeframe), we remain in Cyclical Bull territory.
- Counting-up of the number of all our indicators that are ‘Up’ for U.S. Equities, the current tally is that four of four are Positive, representing a multitude of timeframes (two that can be solely days/weeks, or months+ at a time; another, a quarter at a time; and lastly, the {typically} years-long reading, that being the Cyclical Bull or Bear status).
Looking forward into September:
Historically, September is a weak month in terms of stock market performance. Historically, the Dow has fallen an average of 1% in September since the late 1800s.
However, during election years, performance has historically been positive:
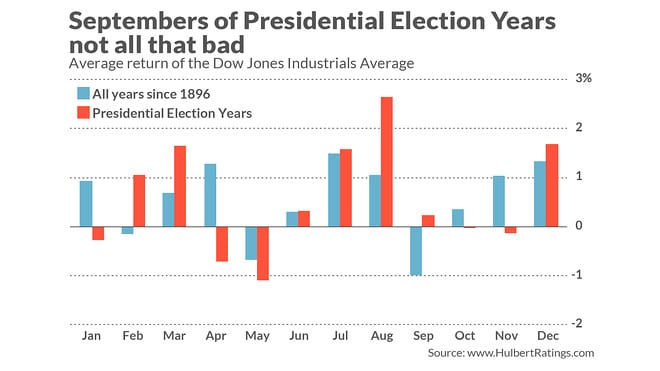
In addition, the S&P 500 index is up (as of Aug 30th) 6.6%. During years when August was up 5% or more September gained an average of 1.4%.
The Week Ahead:
Monday:
- Japan Manufacturing PMI 46.6 exp, 46.6 prior
- Australia Reserve Bank Statement .25% exp, .25% prior
Tuesday:
- U.S. ISM Manufacturing PMI 54.5 exp, 54.2 prior
- Australia GDP -6% exp, -0.3% prior
Wednesday:
- U.S. ADP Non-Farm Employment Change 1250k exp, 167k prior
- U.S. Beige Book
- Crude Oil Inventories -4.7M
Thursday:
- U.S. Unemployment Claims 965k exp, 1,006k prior
- U.S. ISM Non-Manufacturing PMI 57.5 exp, 58.1
Friday:
- U.S. Employment U.S. Unemployment Rate 9.8% exp, 10.2% prior
- U.S. Non-Farm Employment Change 1518k exp, 1763k prior


