[fusion_builder_container hundred_percent=”no” equal_height_columns=”no” menu_anchor=”” hide_on_mobile=”small-visibility,medium-visibility,large-visibility” class=”” id=”” background_color=”” background_image=”” background_position=”center center” background_repeat=”no-repeat” fade=”no” background_parallax=”none” parallax_speed=”0.3″ video_mp4=”” video_webm=”” video_ogv=”” video_url=”” video_aspect_ratio=”16:9″ video_loop=”yes” video_mute=”yes” overlay_color=”” video_preview_image=”” border_size=”” border_color=”” border_style=”solid” padding_top=”” padding_bottom=”” padding_left=”” padding_right=””][fusion_builder_row][fusion_builder_column type=”1_6″ spacing=”” center_content=”no” link=”” target=”_self” min_height=”” hide_on_mobile=”small-visibility,medium-visibility,large-visibility” class=”” id=”” hover_type=”none” border_size=”0″ border_color=”” border_style=”solid” border_position=”all” border_radius=”” box_shadow=”no” dimension_box_shadow=”” box_shadow_blur=”0″ box_shadow_spread=”0″ box_shadow_color=”” box_shadow_style=”” padding_top=”” padding_right=”” padding_bottom=”” padding_left=”” margin_top=”” margin_bottom=”” background_type=”single” gradient_start_color=”” gradient_end_color=”” gradient_start_position=”0″ gradient_end_position=”100″ gradient_type=”linear” radial_direction=”center” linear_angle=”180″ background_color=”” background_image=”” background_image_id=”” background_position=”left top” background_repeat=”no-repeat” background_blend_mode=”none” animation_type=”” animation_direction=”left” animation_speed=”0.3″ animation_offset=”” filter_type=”regular” filter_hue=”0″ filter_saturation=”100″ filter_brightness=”100″ filter_contrast=”100″ filter_invert=”0″ filter_sepia=”0″ filter_opacity=”100″ filter_blur=”0″ filter_hue_hover=”0″ filter_saturation_hover=”100″ filter_brightness_hover=”100″ filter_contrast_hover=”100″ filter_invert_hover=”0″ filter_sepia_hover=”0″ filter_opacity_hover=”100″ filter_blur_hover=”0″ last=”no”][/fusion_builder_column][fusion_builder_column type=”2_3″ layout=”1_1″ background_position=”left top” background_color=”” border_size=”” border_color=”” border_style=”solid” border_position=”all” spacing=”yes” background_image=”” background_repeat=”no-repeat” padding_top=”” padding_right=”” padding_bottom=”” padding_left=”” margin_top=”0px” margin_bottom=”0px” class=”” id=”” animation_type=”” animation_speed=”0.3″ animation_direction=”left” hide_on_mobile=”small-visibility,medium-visibility,large-visibility” center_content=”no” last=”no” min_height=”” hover_type=”none” link=””][fusion_text]
U.S. Markets: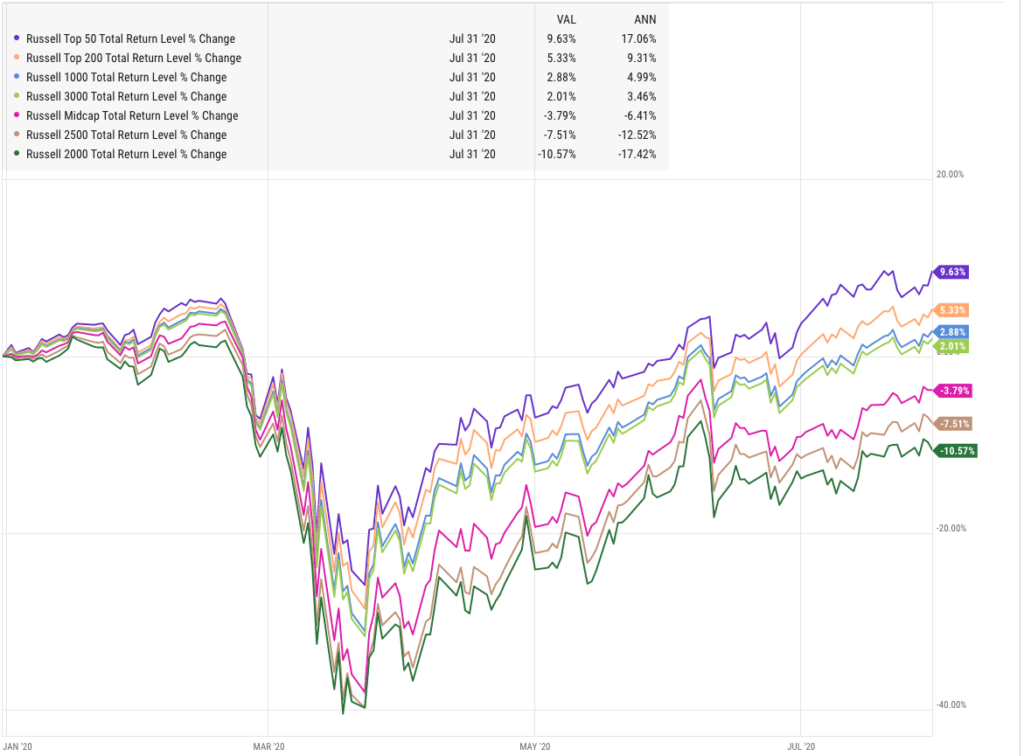
Source: Riverbend Investment Management, YCharts
All but one of the major U.S. indexes ended the week higher as investors reacted to a flood of quarterly earnings reports and some prominent economic data.
Large caps and growth stocks outperformed as small caps and value shares lagged.
The Dow Jones Industrial Average was the only index to finish the week in the red, giving up 42 points to 26,428—a decline of -0.2%.
The technology-heavy NASDAQ Composite surged 3.7% on strong earnings from Apple, Facebook, and Amazon, while the large cap S&P 500 added 1.7%.
Mid caps and small caps also finished the week positively, rising 0.8% and 0.9% respectively.
International Markets:
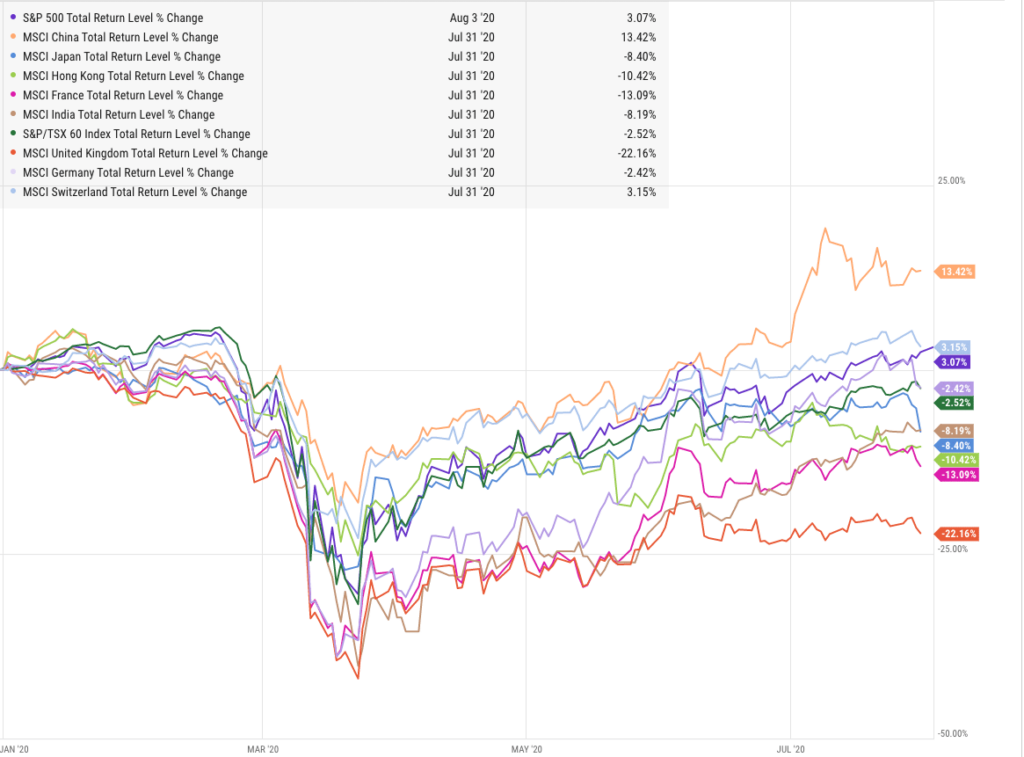
Source: Riverbend Investment Management, YCharts
Unlike the U.S., most major international indexes finished the week to the downside.
Canada’s TSX finished up 1.1%, however the United Kingdom’s FTSE 100 declined -3.7%. On Europe’s mainland France’s CAC 40, Germany’s DAX, and Italy’s Milan FTSE declined -3.5%, -4.1%, and -4.9% respectively.
In Asia, China’s Shanghai Composite rebounded 3.5% while Japan’s Nikkei slumped -4.6%.
As grouped by Morgan Stanley Capital International developed markets declined -1.9% while emerging markets rose 0.3%.
Commodities: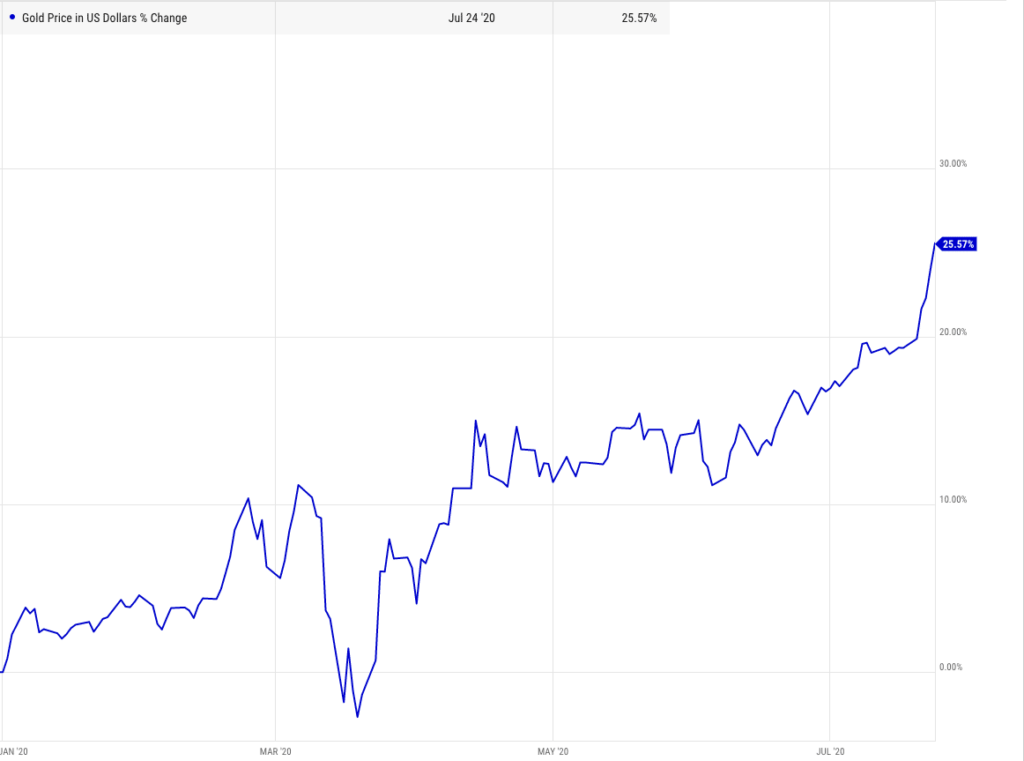
Source: Riverbend Investment Management, YCharts
Gold and Silver continued their rallies on reaction to continued monetary stimulus from the Federal Reserve (or “currency debasement”, as the gold aficionados prefer to label it). Gold had its eighth consecutive positive close surging 4.7% for the week to $1985.90 an ounce. Silver rallied an even steeper 6.0% to $24.22 an ounce.
Oil finished the week down -2.5% to $40.27 per barrel of West Texas Intermediate crude.
The industrial metal copper, viewed by some analysts as a barometer of global economic health due to its wide variety of uses, had its second consecutive down week giving up -0.9%.
U.S. Economic News:
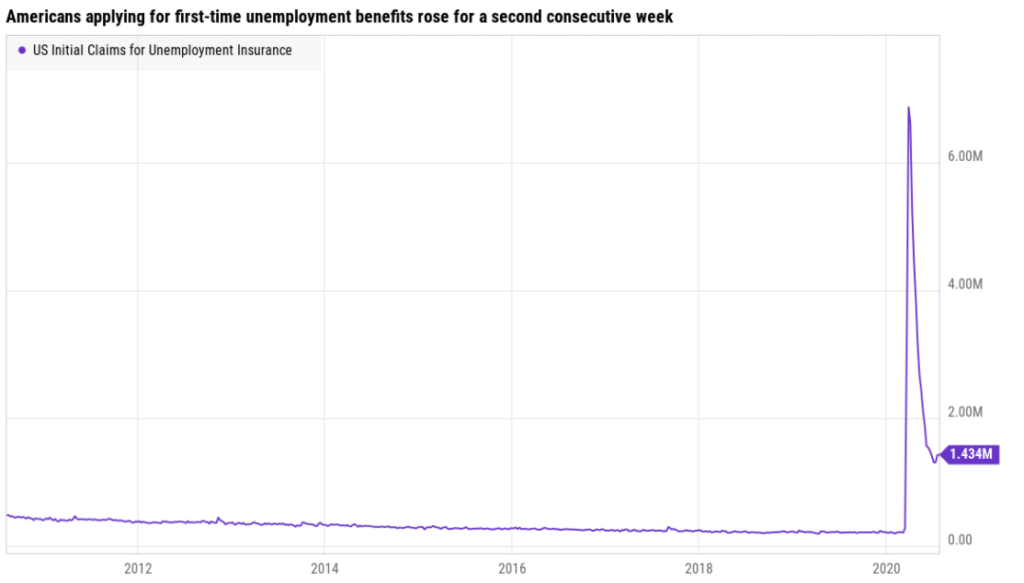
Source: Riverbend Investment Management, YCharts, Department of Labor
The number of Americans applying for first-time unemployment benefits rose for a second consecutive week, a sign the economic rebound could be stalling in late July. The Labor Department reported initial jobless claims rose by 12,000 to 1.434 million new claims in the week ended July 25. Economists had expected 1.51 million new claims.
Until the last two weeks, claims had been on a steady decline after peaking in late March. Continuing claims, which counts the number of people already receiving economic benefits, rose by 867,000 to 17.06 million. That number is a sign workers are staying on unemployment longer and rehiring has slowed. Continuing claims are reported with a one-week delay.
Source: Riverbend Investment Management, YCharts, S&P
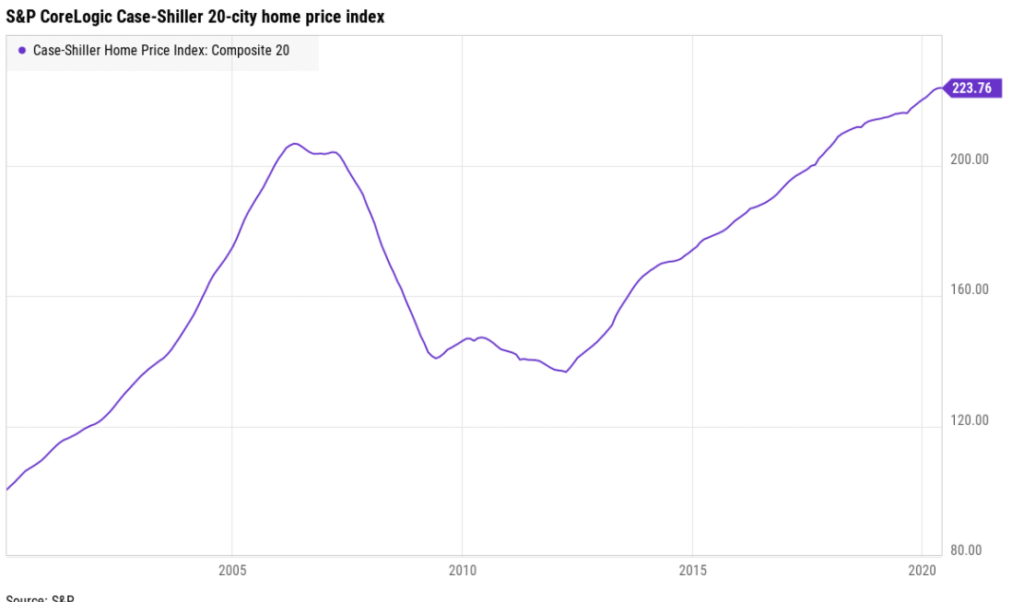
Home prices continued to rise in May, but at a slower rate according to the latest data from S&P Case-Shiller. The S&P CoreLogic Case-Shiller 20-city home price index posted a 3.7% year-over-year gain in May, down 0.2% from the previous month.
On a monthly basis, the index increased 0.4% between April and May. The national index noted a 4.5% increase in home prices across the country over the past year. Phoenix continued to lead the country with a 9% annual price gain in May, followed once again by Seattle with a 6.8% increase. Tampa, Fla., came in third, with a 6% uptick.
However, a look at the individual cities in the index showed that home-price growth could be slowing—the pace of price growth increased in just three of the 19 cities Case-Shiller analyzed (the list didn’t include Detroit again because transaction records were unavailable).
Source: Riverbend Investment Management, YCharts, NAR, Freddie Mac
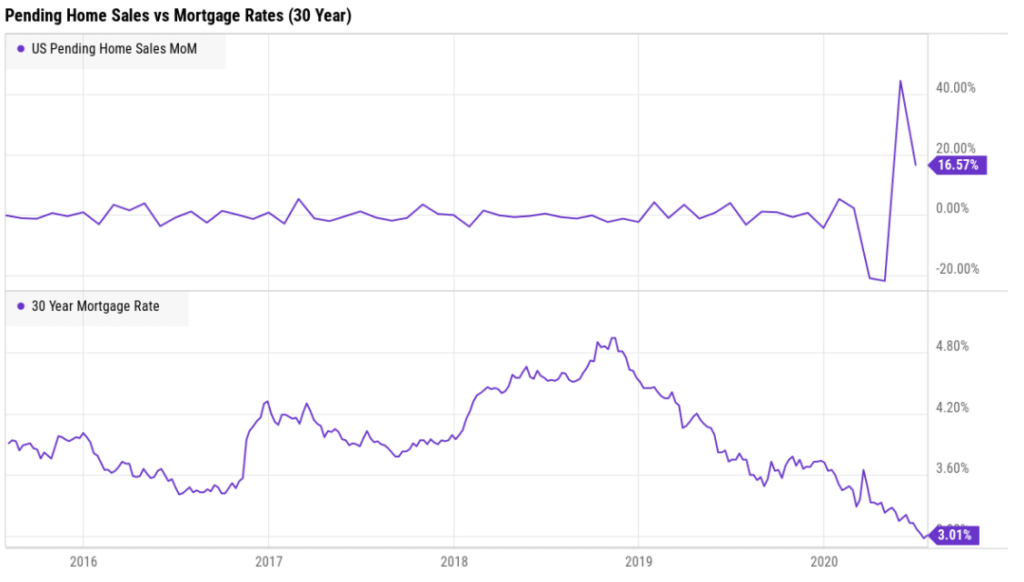
The number of home sales in which a contract has been signed but not yet closed rebounded across the nation in June. The National Association of Realtors (NAR) reported its pending home sales index rose 16.6% in June as compared with May.
Compared with the same time last year, contract signings were up 6.3%. Lawrence Yun, the NAR’s chief economist stated, “It is quite surprising and remarkable that, in the midst of a global pandemic, contract activity for home purchases is higher compared to one year ago. Consumers are taking advantage of record-low mortgage rates resulting from the Federal Reserve’s maximum liquidity monetary policy.”
Source: Riverbend Investment Management, YCharts
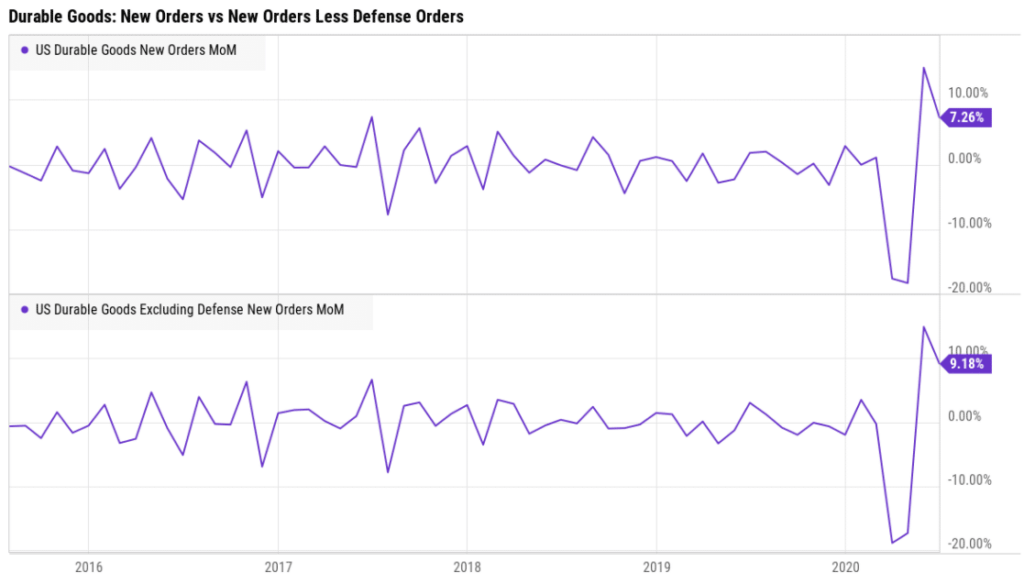
Orders for goods expected to last at least 3 years, so-called ‘durable goods’, climbed in June as a rebound in vehicle purchases offset a decline in aircraft manufacturing. The Commerce Department reported durable-goods orders rose 7.3% last month following historic declines in the early spring. Economists had expected a 7% increase. In the details, orders for new cars and trucks leapt 86% last month as automakers made up lost ground; however aircraft manufacturers posted a whopping 462% decline in bookings. Boeing has seen demand for its planes plummet following the plunge in global travel during the coronavirus outbreak. Stripping out transportation and defense, “core” orders rose a more modest 3.3%.
Lynn Franco, senior director of economic indicators at the board stated, “Consumers have grown less optimistic about the short-term outlook for the economy and labor market and remain subdued about their financial prospects.”
Confidence among American consumers waned this month, pointing to a rockier economic recovery. The Conference Board reported its consumer confidence index declined -5.7 points in July to 92.6. Economists had expected a reading of 96.0. While still above its pandemic low of 85.7, the index remains a long way from its 20-year high of 132.6 set in February.
Lynn Franco, senior director of economic indicators at the board stated, “Consumers have grown less optimistic about the short-term outlook for the economy and labor market and remain subdued about their financial prospects.”
In the report, the index that measures how consumers feel about the economy right now actually rose as massive federal aid has helped millions of Americans get by. However the gauge that measures how Americans feel about the next six months—the so-called ‘future expectations index’, sank to a four-month low of 91.5 from 106.1 in June.
Source: Riverbend Investment Management, YCharts, The COVID Tracking Project, John Hopkins Center for Systems Science and Engineering
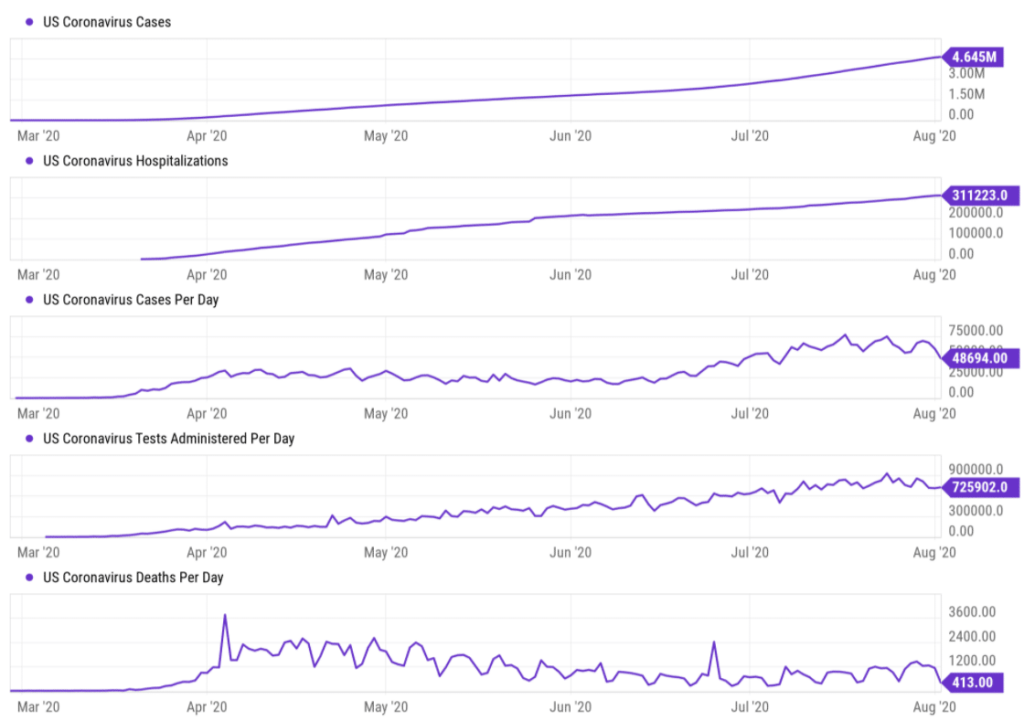
Federal Reserve Chairman Jerome Powell said this week that the sharp acceleration in COVID-19 infections since mid-June is restraining the ability of the economy to recover from its historic contraction in the second quarter, during which all non-essential businesses shut down.
“On balance, it looks like the data are pointing to a slowing in the pace of the recovery. But I want to stress it is too early to say both how large that is and how sustained that will be,” Powell said at a press conference.
Powell noted that it is likely the economy will need more assistance from the Fed and from Congress. The Fed “is committed to using our full range of tools to support the economy and help assure that the recovery from this difficult period will be as robust as possible,” Powell said.
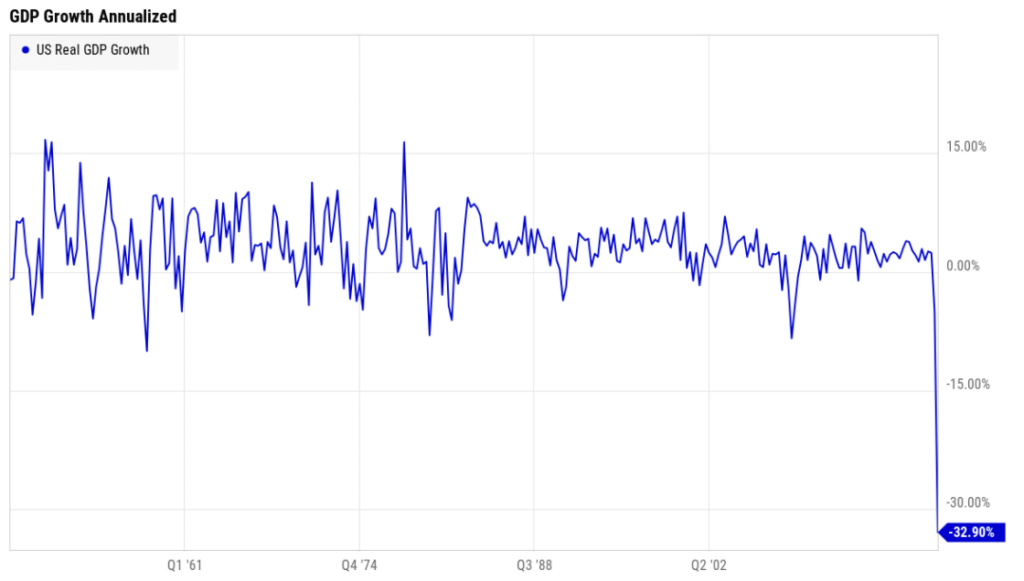
Source: Riverbend Investment Management, YCharts, BEA
The U.S. economy contracted by about -9.5% in the second quarter, which would work out to an annualized -32.9% if the remainder of the year were just as bad. The scare-mongering headlines mostly mislead readers into thinking the entire economy shrank by 32.9% in Q2; many misguided prominent newscasters made the same error (most notably Brian Williams on MSNBC).
Analysts had forecast an annualized -35% decline in GDP. The economy began to recover in mid-May after a severe contraction at the beginning of the quarter, but the U.S. faces a long road back, analysts say. Previously GDP had never shrunk by more than -10% on an annualized basis in any quarter since the government began keeping track shortly after World War Two.
Chart of the Week:
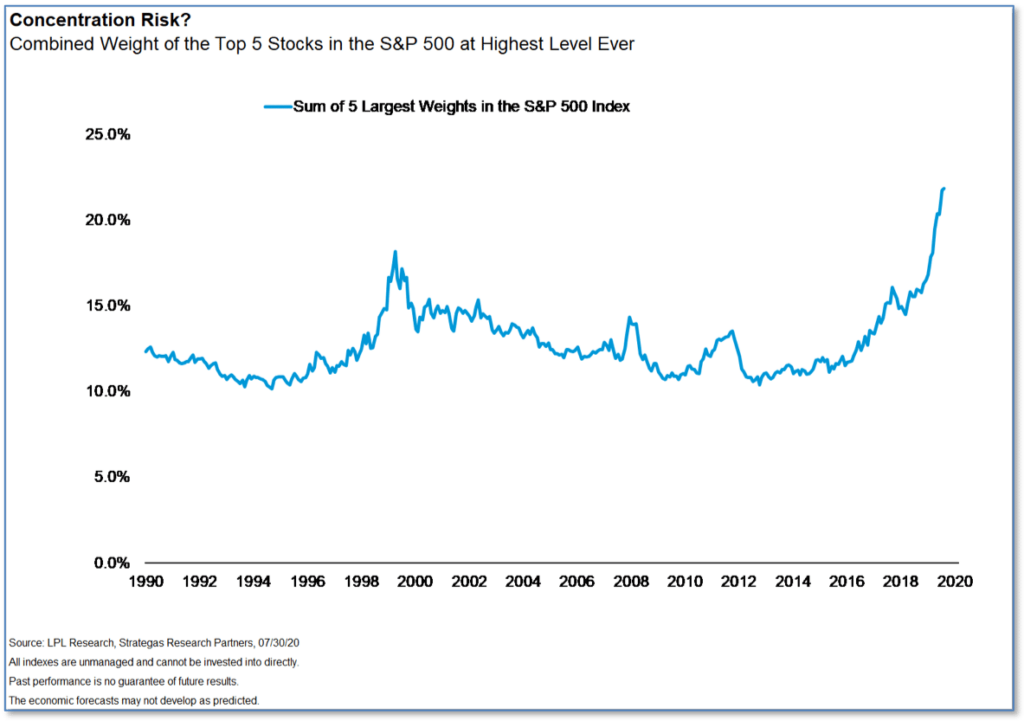
Apple, Microsoft, Amazon, Google and Facebook have led the charge higher in the stock market since the late March lows. The average return for these five stocks so far this year has been a gain of more than 30%, while the broader S&P 500 index is just marginally positive—up 1.2% through July 31st.
So while most other areas of the market have remained largely static, the total market value of these stocks has dramatically increased, which has made them an increasingly large piece of indexes like the S&P 500.
As research from LPL Financial shows, the combined weight of the top five stocks in the S&P 500 has increased to its highest level ever, at nearly 22%, far higher even than during the bubble of 1999. This is called “concentration risk”, and is real although LPL states that it believes that the recent gains from those stocks have been justified by their fundamentals and their utility during the ongoing pandemic “stay-at-home” trend.
Riverbend Indicators Update:

Each week we post notable changes to the various market indicators we follow.
As a reading of our Bull-Bear Indicator for U.S. Equities (comparative measurements over a rolling one-year timeframe), we remain in Cyclical Bull territory.
Counting-up of the number of all our indicators that are ‘Up’ for U.S. Equities, the current tally is that four of four are Positive, representing a multitude of timeframes (two that can be solely days/weeks, or months+ at a time; another, a quarter at a time; and lastly, the {typically} years-long reading, that being the Cyclical Bull or Bear status).
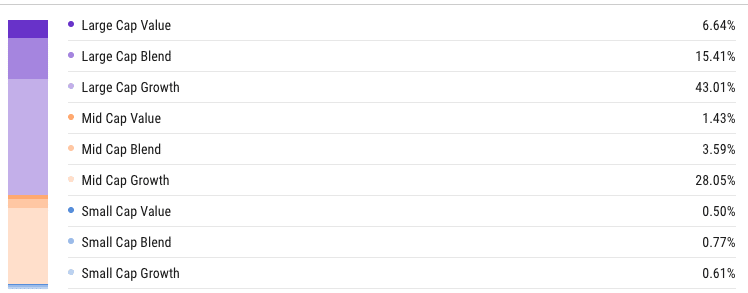
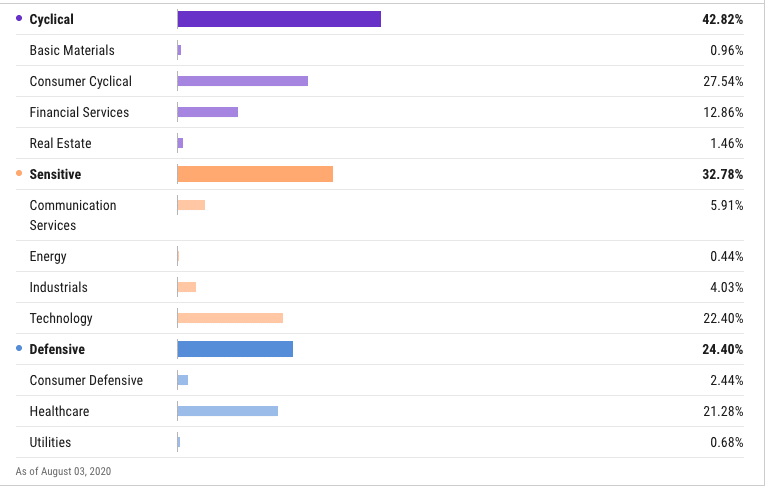
Currently, we are overweight large-cap and mid-cap growth areas of the market with a leaning towards cyclical names:
The Week Ahead:
Monday: U.S. ISM Manufacturing PMI 53.6 exp, 52.6 prior
Tuesday: U.S. Factory Orders m/m +5.1% exp, +8.0% prior U.S. IBD/TIPP Economic Optimism 45.3 exp, 44.0 prior Chinese Caixin Services PMI 58.0 exp, 58.4 prior
Wednesday: U.S. Non-Manufacturing PMI 55.0 exp, 57.1 prior
Thursday: German Factory Orders m/m +11.0% exp, 10.4% prior U.S. Unemployment Claims 1.45 mln exp, 1.434 mln prior USD-Denominated Chinese Trade Balance 42.5 bln exp,46.4 bln prior
Friday: U.S. Non-Farm Employment Change +1510k exp, +4800k prior U.S. Unemployment Rate 10.5% exp, 11.1% prior
[/fusion_text][/fusion_builder_column][/fusion_builder_row][/fusion_builder_container]
