[fusion_builder_container hundred_percent=”no” equal_height_columns=”no” menu_anchor=”” hide_on_mobile=”small-visibility,medium-visibility,large-visibility” class=”” id=”” background_color=”” background_image=”” background_position=”center center” background_repeat=”no-repeat” fade=”no” background_parallax=”none” parallax_speed=”0.3″ video_mp4=”” video_webm=”” video_ogv=”” video_url=”” video_aspect_ratio=”16:9″ video_loop=”yes” video_mute=”yes” overlay_color=”” video_preview_image=”” border_size=”” border_color=”” border_style=”solid” padding_top=”” padding_bottom=”” padding_left=”” padding_right=””][fusion_builder_row][fusion_builder_column type=”1_6″ layout=”1_6″ spacing=”” center_content=”no” link=”” target=”_self” min_height=”” hide_on_mobile=”small-visibility,medium-visibility,large-visibility” class=”” id=”” hover_type=”none” border_size=”0″ border_color=”” border_style=”solid” border_position=”all” border_radius=”” box_shadow=”no” dimension_box_shadow=”” box_shadow_blur=”0″ box_shadow_spread=”0″ box_shadow_color=”” box_shadow_style=”” padding_top=”” padding_right=”” padding_bottom=”” padding_left=”” margin_top=”” margin_bottom=”” background_type=”single” gradient_start_color=”” gradient_end_color=”” gradient_start_position=”0″ gradient_end_position=”100″ gradient_type=”linear” radial_direction=”center” linear_angle=”180″ background_color=”” background_image=”” background_image_id=”” background_position=”left top” background_repeat=”no-repeat” background_blend_mode=”none” animation_type=”” animation_direction=”left” animation_speed=”0.3″ animation_offset=”” filter_type=”regular” filter_hue=”0″ filter_saturation=”100″ filter_brightness=”100″ filter_contrast=”100″ filter_invert=”0″ filter_sepia=”0″ filter_opacity=”100″ filter_blur=”0″ filter_hue_hover=”0″ filter_saturation_hover=”100″ filter_brightness_hover=”100″ filter_contrast_hover=”100″ filter_invert_hover=”0″ filter_sepia_hover=”0″ filter_opacity_hover=”100″ filter_blur_hover=”0″ last=”no”][/fusion_builder_column][fusion_builder_column type=”2_3″ layout=”1_1″ background_position=”left top” background_color=”” border_size=”” border_color=”” border_style=”solid” border_position=”all” spacing=”yes” background_image=”” background_repeat=”no-repeat” padding_top=”” padding_right=”” padding_bottom=”” padding_left=”” margin_top=”0px” margin_bottom=”0px” class=”” id=”” animation_type=”” animation_speed=”0.3″ animation_direction=”left” hide_on_mobile=”small-visibility,medium-visibility,large-visibility” center_content=”no” last=”no” min_height=”” hover_type=”none” link=””][fusion_text]
U.S. Markets:
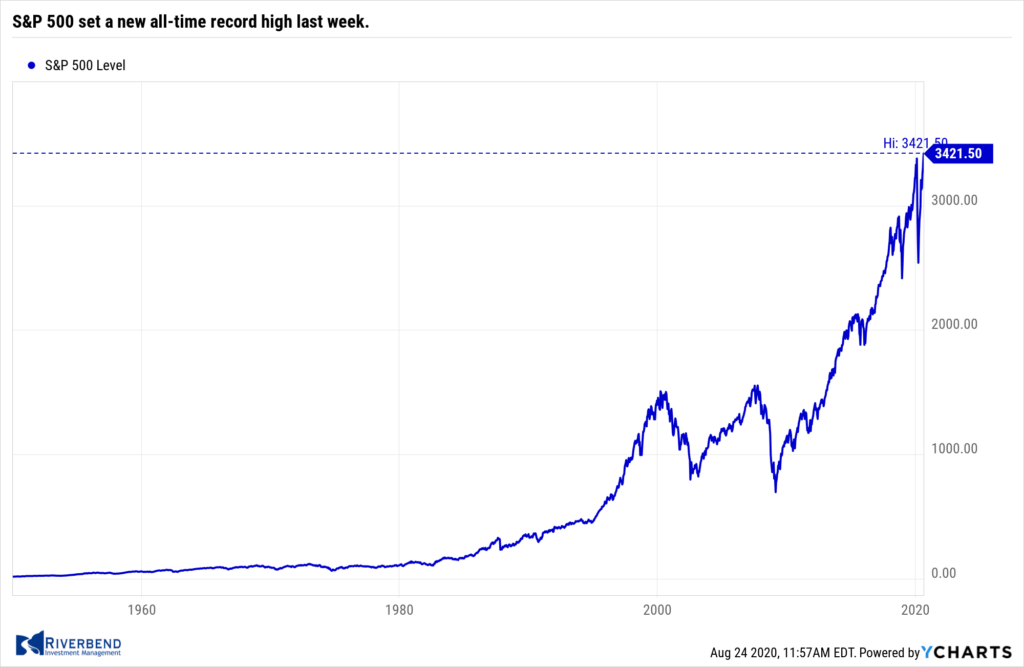
The major U.S. indexes ended the week mixed. The week’s big story was the benchmark S&P 500 setting a new all-time record high during the week.
The Dow Jones Industrial Average finished the week essentially flat at 27,930. The technology-heavy NASDAQ Composite rose for a fourth consecutive week, adding 2.7%.
By market cap, the large cap S&P 500 added 0.7%, while the mid cap S&P 400 and small cap Russell 2000 ended the week down -2.0% and -1.6%, respectively.
International Markets:
Canada’s TSX rose just 3 points to 16,519, while the United Kingdom’s FTSE gave up -1.4%.
On Europe’s mainland France’s CAC 40 declined -1.3% and Germany’s DAX fell -1.1%.
In Asia, China’s Shanghai Composite rose 0.6%, while Japan’s Nikkei retreated -1.6%.
As grouped by Morgan Stanley Capital International, emerging markets finished the week up 0.1%, while developed markets ended down -0.6%.
Commodities: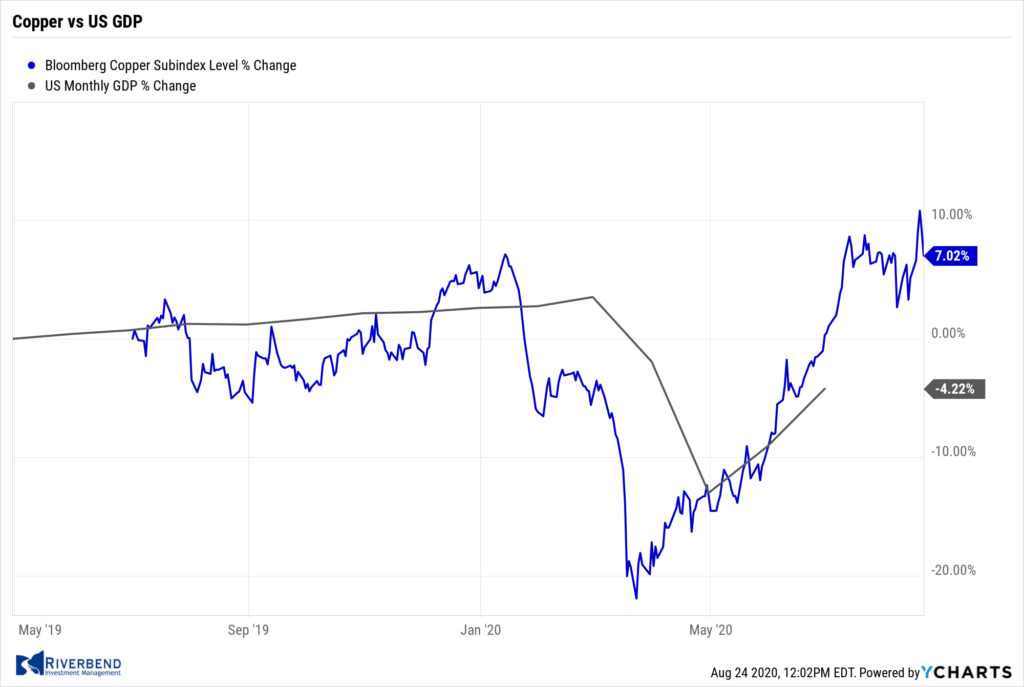
Precious metals finished the week mixed. Gold finished the week down -0.14% to $1947 an ounce, while Silver rose 2.5% to $26.73 an ounce.
Oil had its third consecutive week of gains. West Texas Intermediate crude rose 0.8% to $42.34 per barrel.
The industrial metal copper, viewed by analysts as a proxy for global economic health due to its wide variety of uses, ended the week up 2.1%.
U.S. Economic News: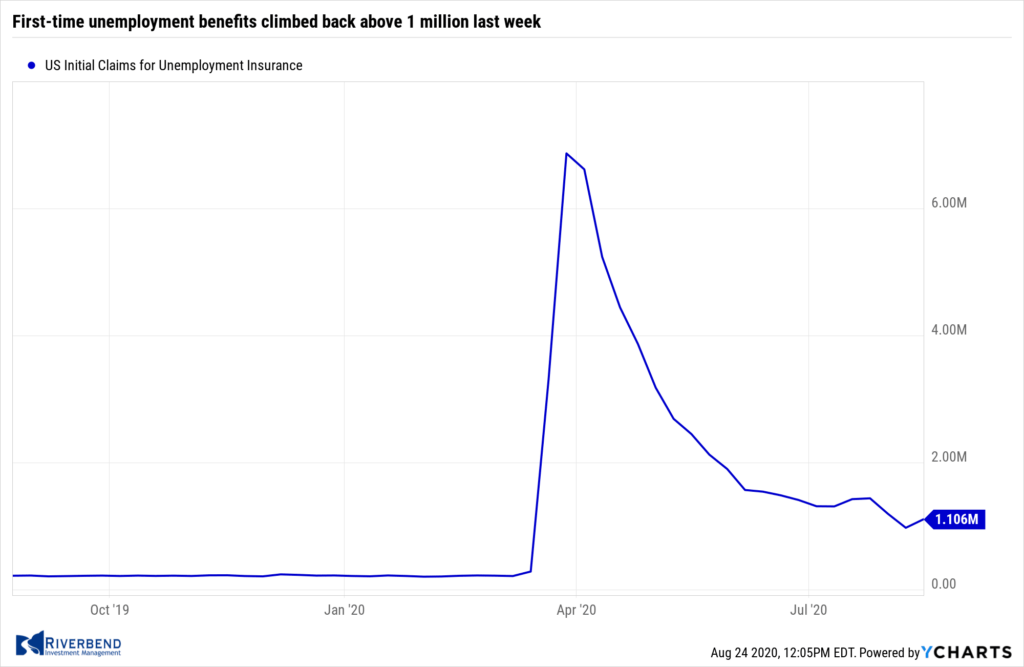
The number of Americans seeking first-time unemployment benefits climbed back above 1 million last week as the recovery in the labor market appears to have slowed. The Labor Department reported new applications for unemployment benefits rose by 135,000 to 1.06 million. Economists had expected 910,000 new claims.
While the level of initial claims remains a fraction of what it was in March, it remains very high by historical standards and is indicative of weak labor market conditions. Continuing claims, which counts the number of Americans already receiving unemployment benefits, decreased by 636,000 to 14.844 million. That number is reported with a one-week delay.
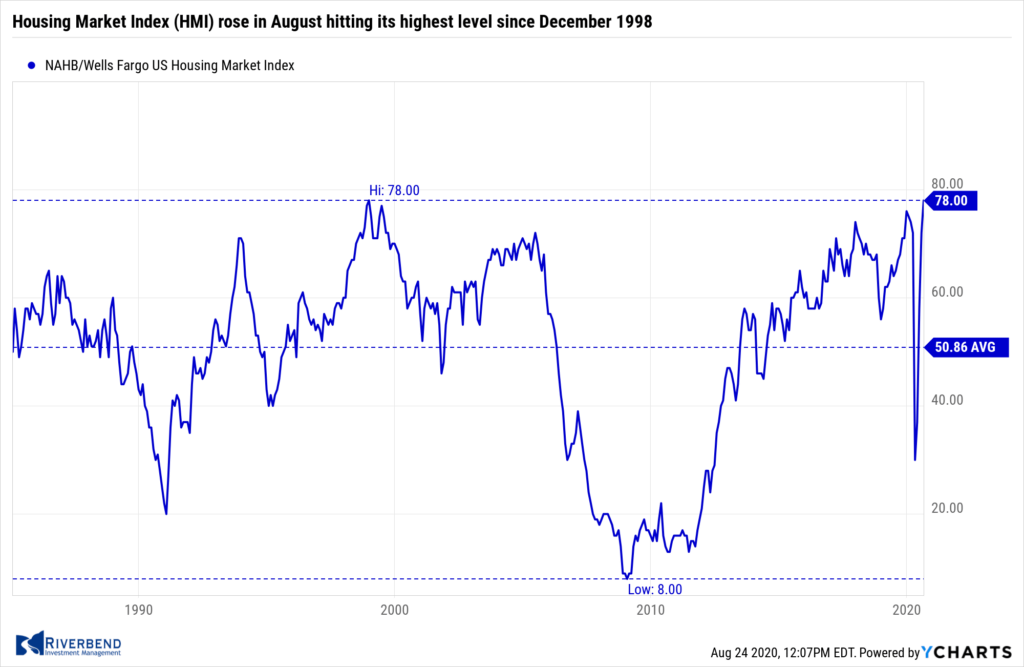 The National Association of Home Builders (NAHB) reported its Housing Market Index (HMI) rose in August hitting its highest level since December 1998. The NAHB HMI for August rose six points to 78—its fourth consecutive increase. All four regions posted gains, with the most notable improvement in the Northeast where optimism hit a fresh record high. All three components of the HMI had solid gains, led by another jump in prospective buyer traffic to a record high level. The improvement in housing demand has been boosted by record low mortgage rates. Analysts note the surge in builder optimism implies a strong pickup in housing starts in the next few months.
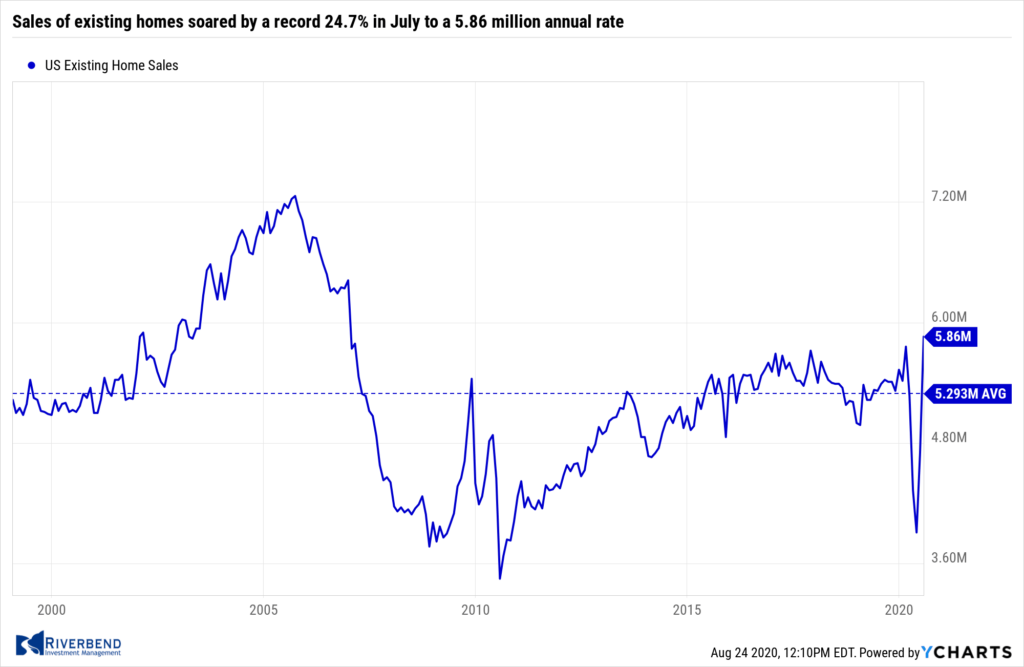
Sales of existing homes soared by a record 24.7% in July to a 5.86 million annual rate. The July reading was its highest level since December 2006 and well above the consensus of a 5.39 million unit rate. All four regions posted double-digit gains as homebuyers across the country took advantage of record low mortgage rates.
Existing home inventory fell 2.6% to 1.5 million units, down 21.1% from the same time last year. Months’ available supply fell to just 3.1, the second lowest on record and indicative of very tight housing inventory. Economists generally consider 6 months of supply a “balanced” housing market.
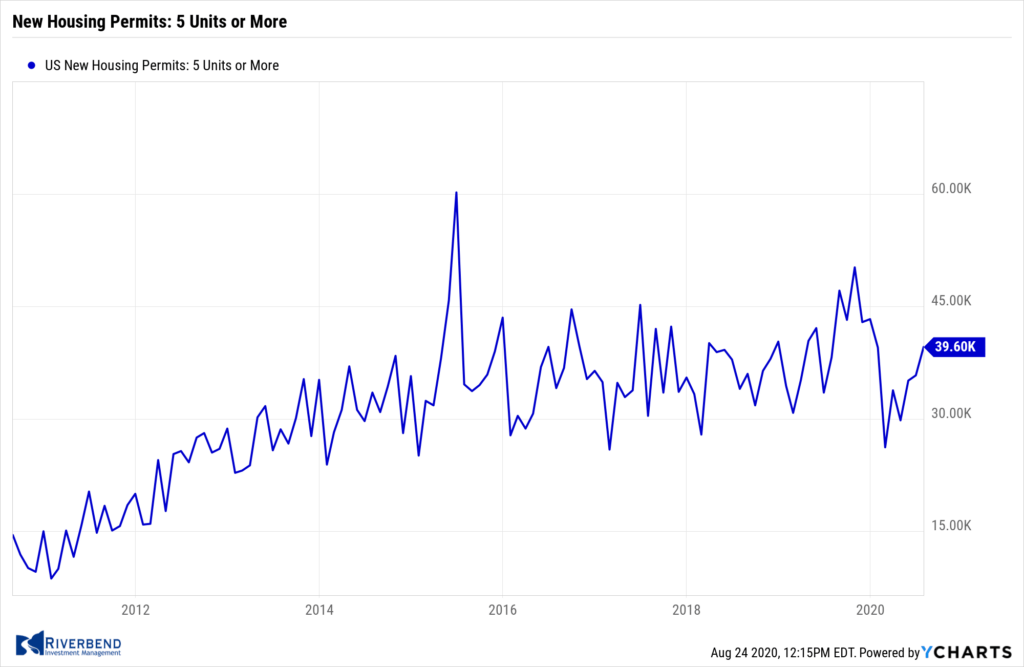 The number of new homes under construction jumped in July as Americans re-entered the housing market en masse. The U.S. Census Bureau reported home builders began construction on homes at a seasonally-adjusted annual rate of 1.496 million last month. The reading was up 22.6% from the previous month and up 23.4% from the same time last year.
The pace of home building is now down just 7% from its pre-coronavirus high. Permitting activity occurred at a seasonally-adjusted annual rate of 1.495 million, up 18.8% from June and up 9.4% from July 2019. All regions experienced an overall uptick in housing starts despite rising coronavirus cases in many parts of the country. The biggest jump was in the Northeast, with a 35.3% increase.
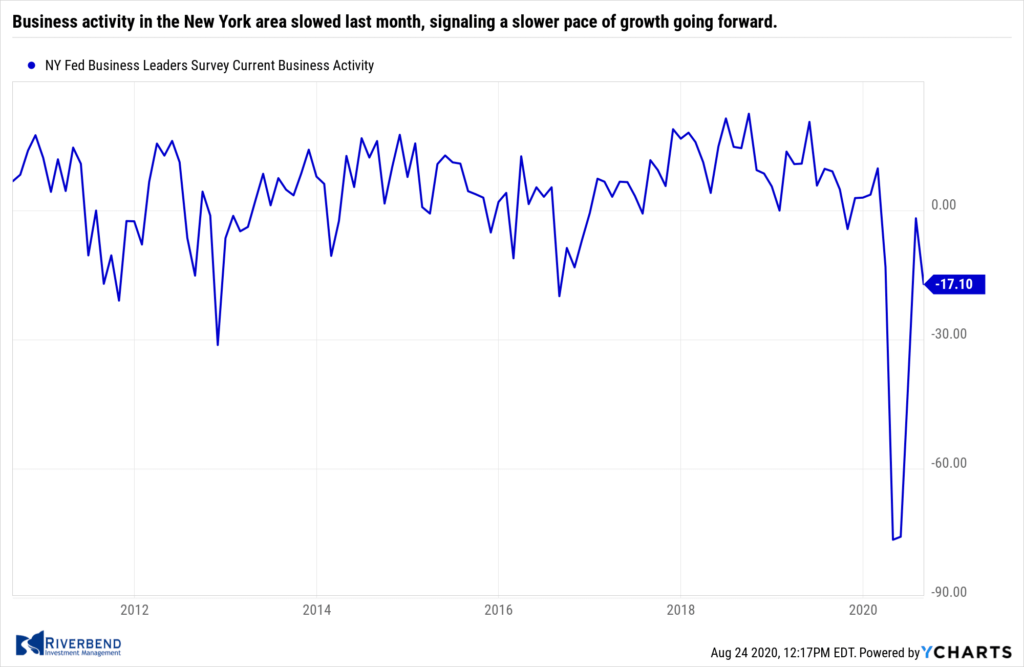 Business activity in the New York area slowed last month, signaling a slower pace of growth going forward. The New York Federal Reserve reported its Empire State business conditions index fell 13.5 points to 3.7. The reading was far below expectations for a reading of 17.
In the details, the new orders index fell 15.6 points to -1.7, while shipments fell 11.8 points to 6.7. Optimism about the six-month outlook also moved lower in July. The future capital expenditures index slipped 3.1 points to 6. Many economists believe the quick rebound is now over, and the economy will now settle into a slower path of growth. Oren Klachkin, economist at Oxford Economics wrote in a note, “Our baseline forecast foresees manufacturing taking until 2022 to return to pre-virus levels of activity.”
As in New York, the Philadelphia region also saw a slowdown in activity. The Philadelphia Federal Reserve reported its manufacturing index slowed for a second straight month in August. After hitting 27.5 in June, the index fell to 17.2 this month. Economists had expected a reading of 20. New orders, shipments, and employment growth all moderated. Notably, optimism about the next six months remained solid, with the index for future activity actually rising 3 points to 38.8. Neil Dutta, head of economics, at Renaissance Macro Research is expecting factory activity to rebound in the coming months stating, “We think the broader story of the factory sector is that inventories are way too low relative to demand — thus we’d expect strong gains in production in coming months as inventories are rebuilt.”
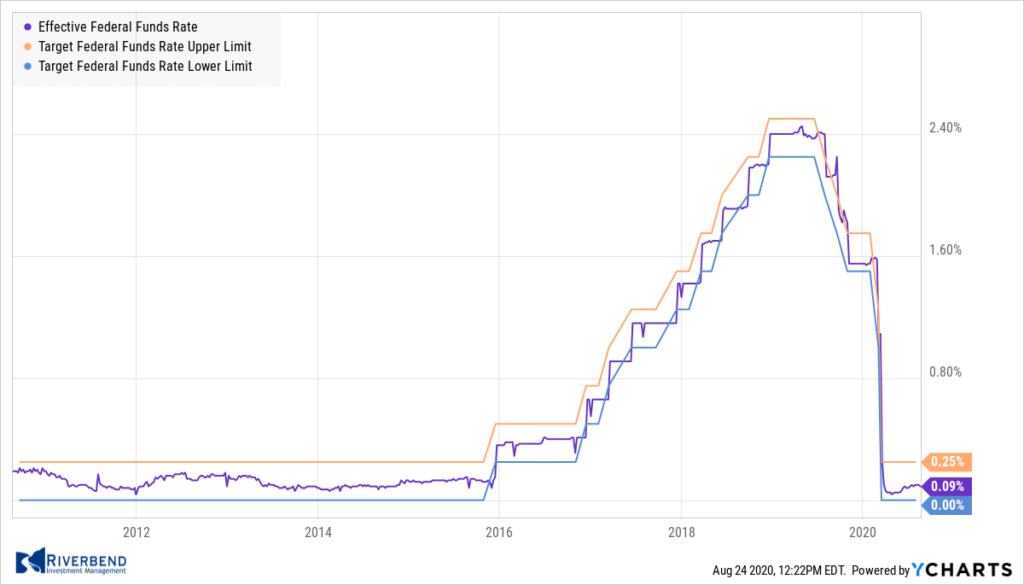 According to minutes of the Federal Reserve’s Open Market Committee meeting in July, the Fed’s estimate for economic growth over the second half of the year has been revised lower. At the latest meeting on July 28-29, the Fed said it expected the rate of recovery in gross domestic product and the pace of declines in the unemployment rate to be “somewhat less robust than in the previous forecast.”
The blame for the reduction in expectations was placed on the increasing spread of the coronavirus since mid-June, and the consequent slowing of state re-openings of businesses. At the July meeting, Fed officials decided to keep interest rates at zero and to maintain monthly purchases of $120 billion of U.S. Treasuries and mortgage-backed securities. Fed Chairman Jerome Powell has said the central bank “isn’t even thinking about thinking about raising rates.”
Chart of the Week:
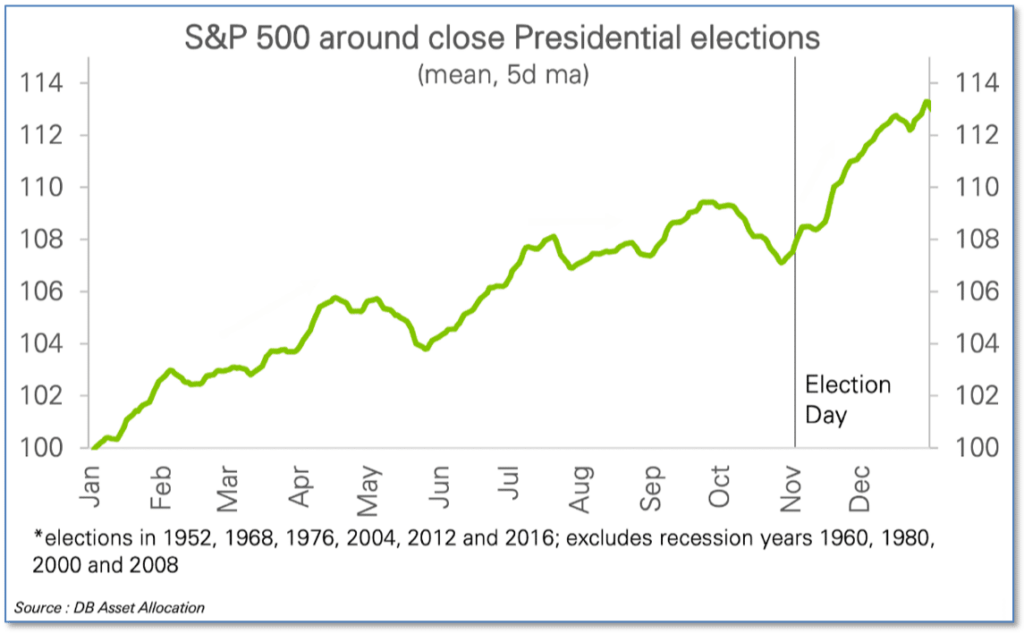
David Kostin, the Goldman Sachs chief U.S. equity strategist, wrote in a note to clients “The U.S. election is just 81 days away and represents a significant risk to our year-end forecast.”
Analysts often mention the uncertainty surrounding presidential elections in the United States, and this year is sure to be no exception. However, John Stoltzfus, CIO of Oppenheimer Asset Management told clients, “Embrace the uncertainty.” His research showed that historically, elections haven’t done much to prevent stocks from going up regardless of which political party prevails.
Furthermore, Stoltzfus writes, “Uncertainty usually comes with opportunity and risk—two considerations essential in making investments.” A study by Deutsche Bank showed that in Presidential election years in which the contest is thought to be “close”, stocks generally go up until a month or so before the election, then pull back a bit, and then resume their uptrend from around the election through the end of the year. Chart via Deutsche Bank
Riverbend Indicators Update:

Each week we post notable changes to the various market indicators we follow.
- As a reading of our Bull-Bear Indicator for U.S. Equities (comparative measurements over a rolling one-year timeframe), we remain in Cyclical Bull territory.
- Counting-up of the number of all our indicators that are ‘Up’ for U.S. Equities, the current tally is that four of four are Positive, representing a multitude of timeframes (two that can be solely days/weeks, or months+ at a time; another, a quarter at a time; and lastly, the {typically} years-long reading, that being the Cyclical Bull or Bear status).
Update from last week’s Market Insight:
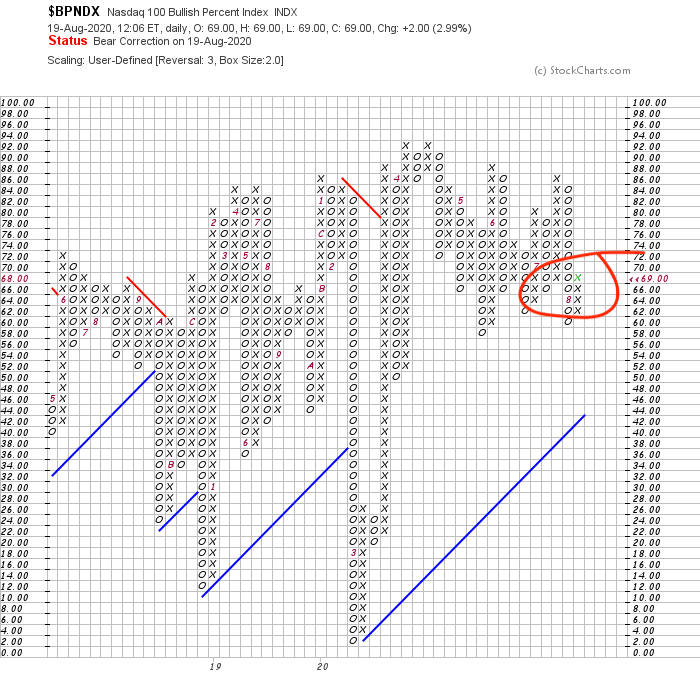
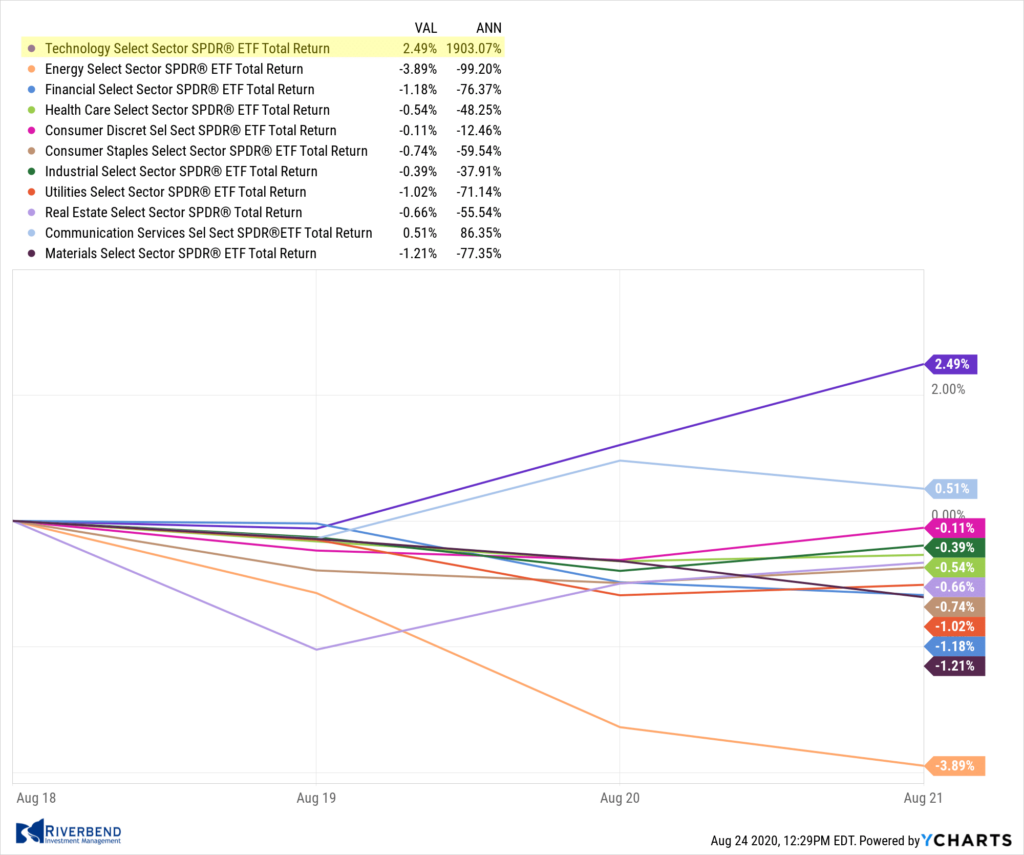
Last week I mentioned the tech-heavy, NDX Bullish Percent Index had turned positive again. After a few weeks of underperformance, from the technology sector, tech is back outperforming the rest of the major S&P sectors:
The Week Ahead:
Monday:
- Japan Core CPI N/A exp, 0.1% prior
Tuesday:
- U.S. Consumer Confidence 93.2 exp, 92.6 prior
- U.S. New Home Sales 775k exp, 776k prior
Wednesday:
- U.S. Core Durable Goods Orders 1.7% exp, 3.6% prior
- U.S. Durable Goods Orders 4% exp, 7.6% prior
- Crude Oil Inventories -1.6M prior
Thursday:
- U.S. Unemployment Claims 990k exp, 963k prior
- U.S. Prelim GDP -32.5% exp, -32.9% prior
Friday:
- U.S. Chicago PMI 51 exp, 51.9 prior
- U.S. UofM Consumer Sentiment 72.8 exp, 72.8 prior
- U.S. Personal Income -0.3% exp, -1.1% prior
[/fusion_text][/fusion_builder_column][/fusion_builder_row][/fusion_builder_container]


