[fusion_builder_container hundred_percent=”no” equal_height_columns=”no” menu_anchor=”” hide_on_mobile=”small-visibility,medium-visibility,large-visibility” class=”” id=”” background_color=”” background_image=”” background_position=”center center” background_repeat=”no-repeat” fade=”no” background_parallax=”none” parallax_speed=”0.3″ video_mp4=”” video_webm=”” video_ogv=”” video_url=”” video_aspect_ratio=”16:9″ video_loop=”yes” video_mute=”yes” overlay_color=”” video_preview_image=”” border_size=”” border_color=”” border_style=”solid” padding_top=”” padding_bottom=”” padding_left=”” padding_right=””][fusion_builder_row][fusion_builder_column type=”1_6″ layout=”1_6″ spacing=”” center_content=”no” link=”” target=”_self” min_height=”” hide_on_mobile=”small-visibility,medium-visibility,large-visibility” class=”” id=”” hover_type=”none” border_size=”0″ border_color=”” border_style=”solid” border_position=”all” border_radius=”” box_shadow=”no” dimension_box_shadow=”” box_shadow_blur=”0″ box_shadow_spread=”0″ box_shadow_color=”” box_shadow_style=”” padding_top=”” padding_right=”” padding_bottom=”” padding_left=”” margin_top=”” margin_bottom=”” background_type=”single” gradient_start_color=”” gradient_end_color=”” gradient_start_position=”0″ gradient_end_position=”100″ gradient_type=”linear” radial_direction=”center” linear_angle=”180″ background_color=”” background_image=”” background_image_id=”” background_position=”left top” background_repeat=”no-repeat” background_blend_mode=”none” animation_type=”” animation_direction=”left” animation_speed=”0.3″ animation_offset=”” filter_type=”regular” filter_hue=”0″ filter_saturation=”100″ filter_brightness=”100″ filter_contrast=”100″ filter_invert=”0″ filter_sepia=”0″ filter_opacity=”100″ filter_blur=”0″ filter_hue_hover=”0″ filter_saturation_hover=”100″ filter_brightness_hover=”100″ filter_contrast_hover=”100″ filter_invert_hover=”0″ filter_sepia_hover=”0″ filter_opacity_hover=”100″ filter_blur_hover=”0″ last=”no”][/fusion_builder_column][fusion_builder_column type=”2_3″ layout=”1_1″ background_position=”left top” background_color=”” border_size=”” border_color=”” border_style=”solid” border_position=”all” spacing=”yes” background_image=”” background_repeat=”no-repeat” padding_top=”” padding_right=”” padding_bottom=”” padding_left=”” margin_top=”0px” margin_bottom=”0px” class=”” id=”” animation_type=”” animation_speed=”0.3″ animation_direction=”left” hide_on_mobile=”small-visibility,medium-visibility,large-visibility” center_content=”no” last=”no” min_height=”” hover_type=”none” link=””][fusion_text]
U.S. Markets:
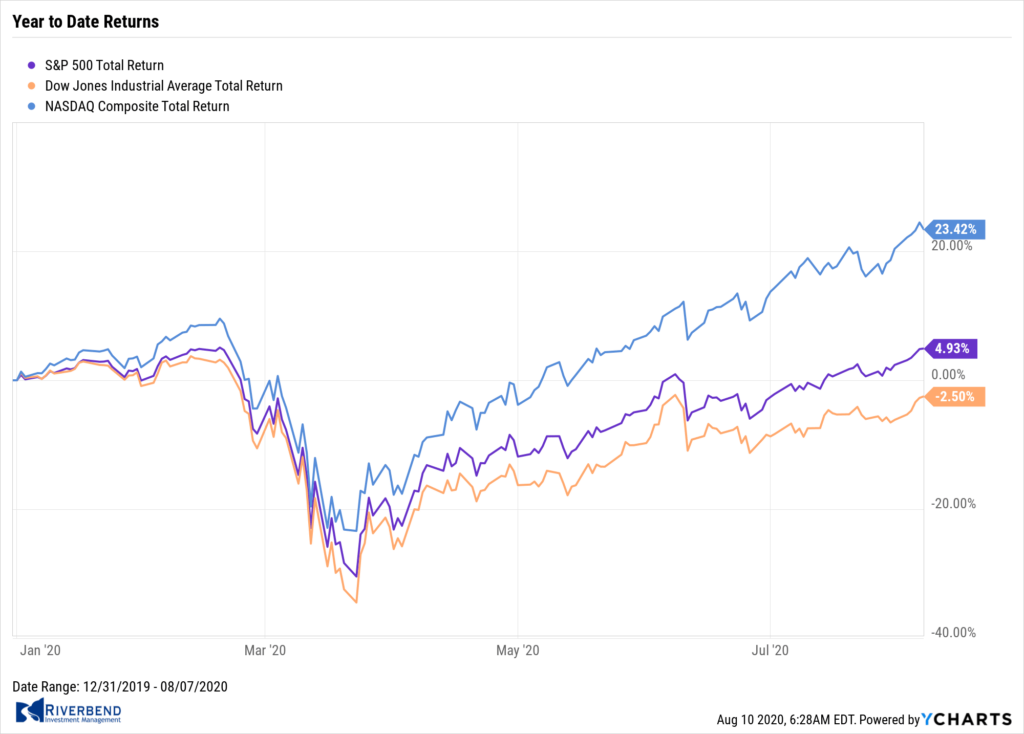
U.S. stocks recorded solid gains for the week, pushing the technology-heavy NASDAQ Composite index to new highs and lifting the S&P 500 to within roughly 1.2% of its February record peak.
The small cap Russell 2000 outperformed by a wide margin, helping it to recover some of its lost ground for the year to date. The Dow Jones Industrial Average added over 1,000 points ending the week at 27,433, a gain of 3.8%.
The NASDAQ Composite rose an additional 2.5% following last week’s strong gain.
By market cap, the large cap S&P 500 added 2.5%, while the mid cap S&P 400 jumped 4% and the small cap Russell 2000 surged 6%.
International Markets:
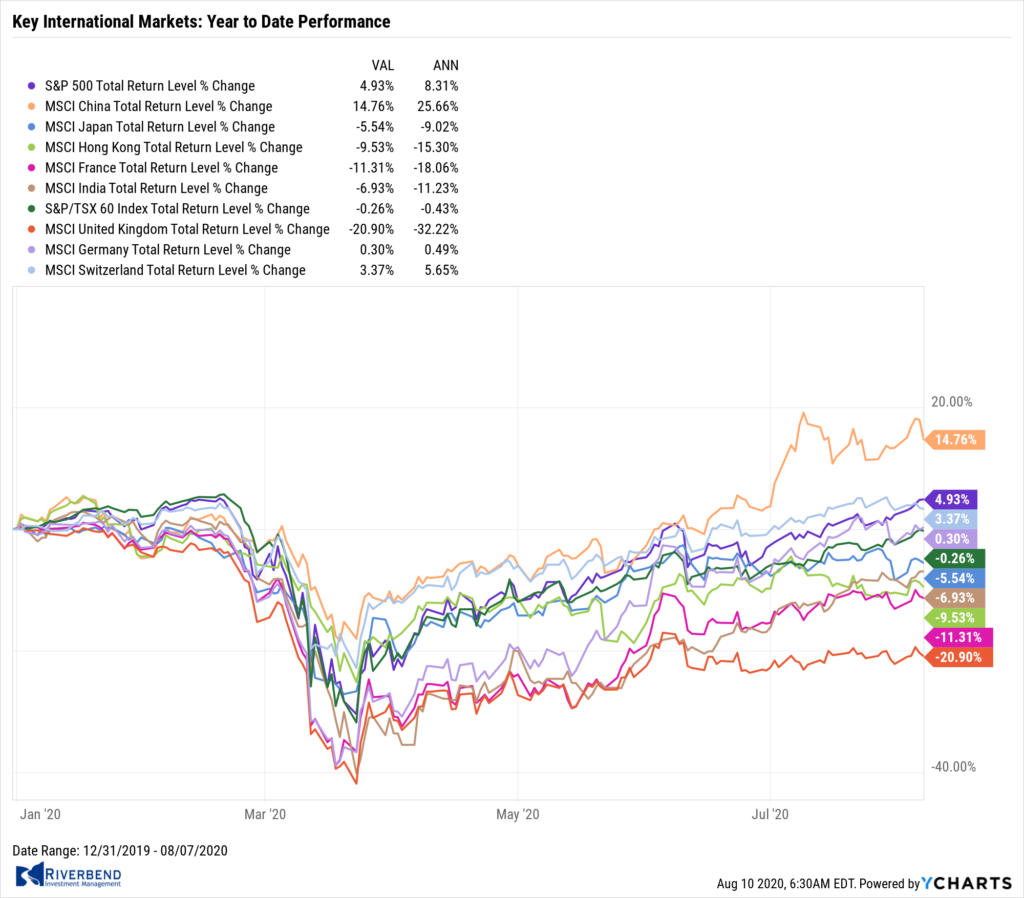
Major international markets were green across the board. Canada’s TSX added 2.3%, as did the United Kingdom’s FTSE. France’s CAC 40 gained 2.2%, Germany’s DAX added 2.9% and Italy’s Milan FTSE rose 2.2%.
In Asia, China’s Shanghai Composite rose 1.3% and Japan’s Nikkei gained 2.9%.
As grouped by Morgan Stanley Capital International, emerging markets rose 1.3% while developed markets finished the week up 2.5%.
Commodities:
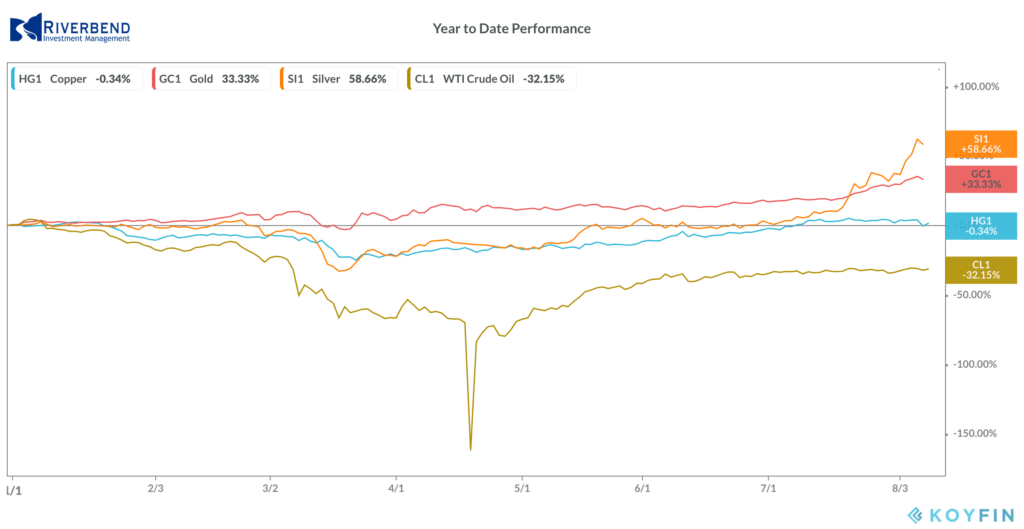 Precious metals continued their rallies. Gold rose for a ninth consecutive week, closing at $2028.00 per ounce, a gain of 2.1%. Silver surged a huge 13.7% to $27.54 an ounce.
Oil recovered most of last week’s decline finishing the week up 2.4% to $41.22 per barrel of West Texas Intermediate crude.
Copper went the other way, and had its third consecutive week of declines giving up -2.6%. Copper is viewed by some analysts as a barometer of world economic health due to its wide variety of industrial uses.
U.S. Economic News:
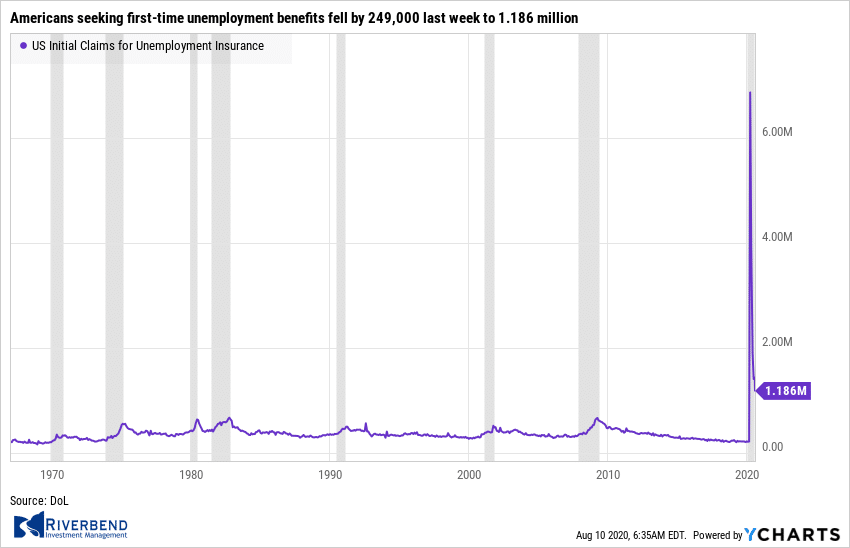 The Labor Department reported the number of Americans seeking first-time unemployment benefits fell by 249,000 last week to 1.186 million. That is its lowest reading since March and below the consensus of 1.4 million.
The improvement reversed the upticks in the prior two weeks putting the series back on track toward normalization. Still, the level is far higher than normal and nearly twice as high as levels seen at the height of the Great Recession.
Continuing jobless claims, which counts the number of people already receiving benefits, fell by 844,000 to 16.107 million—its lowest level since April.
There are currently about 14.0 million people receiving pandemic unemployment assistance or emergency unemployment compensation, funded through the CARES Act. However, since these programs expired last week, analysts expect a significant downside to personal income and spending growth in the near future as Congress has yet to agree on a compromise to continue the program.
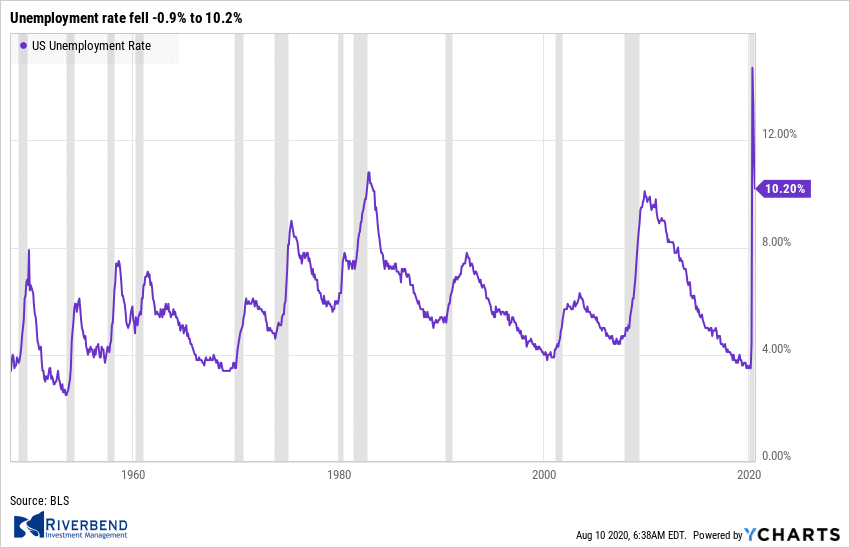
The employment recovery continued in July but it still has a long way to go Friday’s jobs report showed. Nonfarm payrolls increased 1.763 million, above the consensus of 1.482 million, while the unemployment rate fell -0.9% to 10.2%. Private nonfarm payrolls increased 1.462 million for its third gain in a row. Private payrolls have so far recovered about 45% of the losses in March and April.
The majority of job gains last month were in leisure and hospitality and retail trade, two of the hardest hit industries during the lockdown. Government payrolls jumped by a record 301,000 with nearly all of it in state and local education.
Despite the improvement, analysts note a quick return to pre-recession labor market conditions is unlikely as both consumer behavior and business practices are seemingly changing in response to COVID-19.
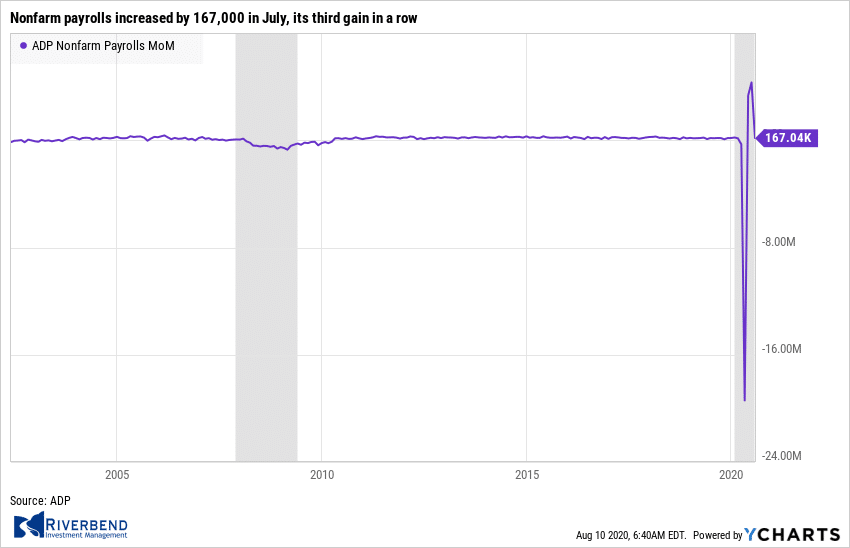
Private payroll processor ADP reported payrolls increased by 167,000 in July, its third gain in a row. However, the reading widely missed the consensus of 1,000,000 net new jobs. Slower hiring reflects the resurgence of COVID cases across the country.
Private payrolls have so far recovered only about 40% of the losses in March and April as labor market conditions remain far from normal. The slowdown in hiring was evident across all firm sizes and sectors. Medium-sized firms (50-499 employees) actually shed jobs, particularly in financial activities, information, construction, and mining.
Analysts note that this raises the risk that as the health crisis continues, its negative economic impact will go beyond the industries initially hit hardest like leisure, hospitality, and retail trade.
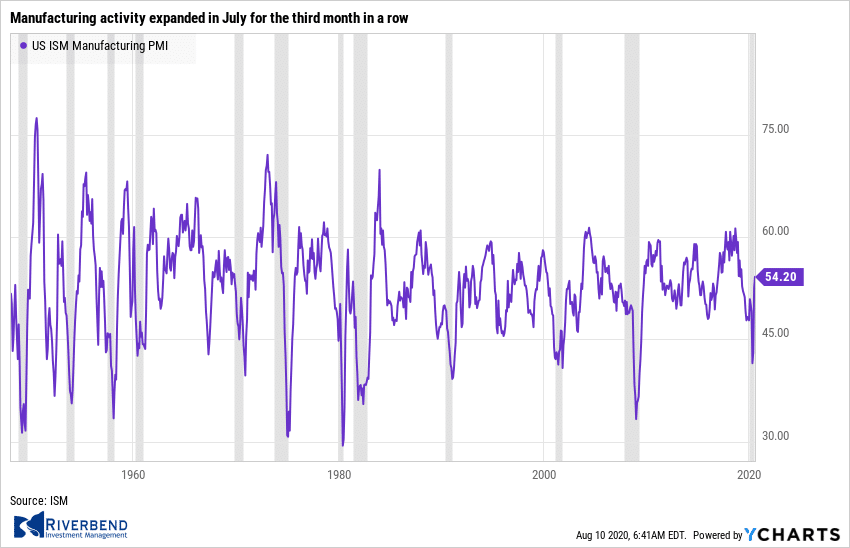
Manufacturing activity expanded in July for the third month in a row, but senior executives say production remains well below its pre-pandemic levels. The Institute for Supply Management (ISM) reported its manufacturing index rose to 1.6 points to 54.2 marking its highest level in 15 months. Economists had forecast the index would reach 53.6. However, the high level of the index is somewhat misleading economists say.
Chief economist Ian Shepherdson of Pantheon Macroeconomics stated, “Diffusion indexes like the ISM capture rates of change of activity, not levels, and output remains depressed.” Other economic signposts such as durable-goods orders, industrial production and the monthly U.S. jobs report show that companies are producing significantly fewer goods and employing fewer workers than they were before the pandemic. The index had fallen to an 11-year low of 41.5 in April during the height of the crisis.
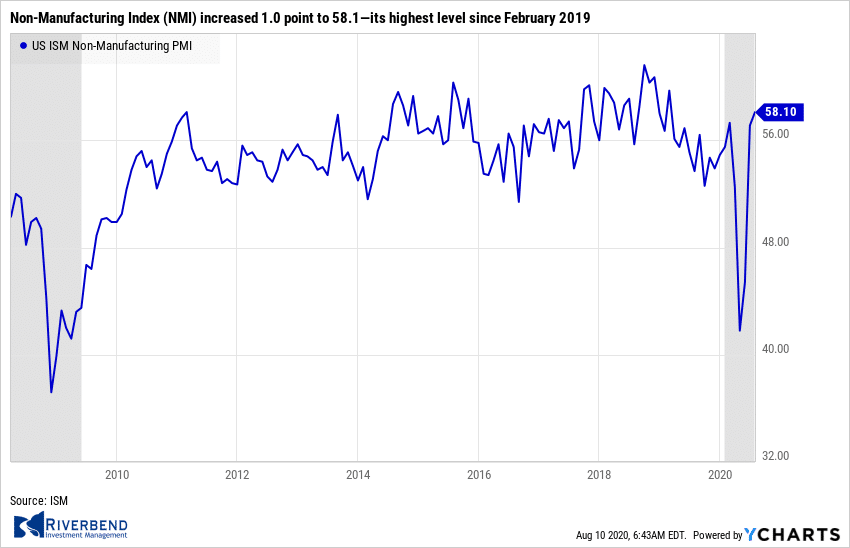
For the vast services side of the U.S. economy, ISM reported its Non-Manufacturing Index (NMI) increased 1.0 point to 58.1—its highest level since February 2019. Analysts had forecast a decline of 2.1 points to 55.0. Still, it was the second straight month above the 50-level that signifies growth versus contraction.
The increase in the NMI was led by a 6.1 jump in new orders to 67.7, a record high. Business activity moved up 1.2 points to 67.2, its best level since January of 2004. And order backlogs grew at their quickest rate in over a year indicating some operating capacity pressures. Even so, employment shrank for the fifth month in a row. The same caution as noted above for the manufacturing index applies here, economists point out.
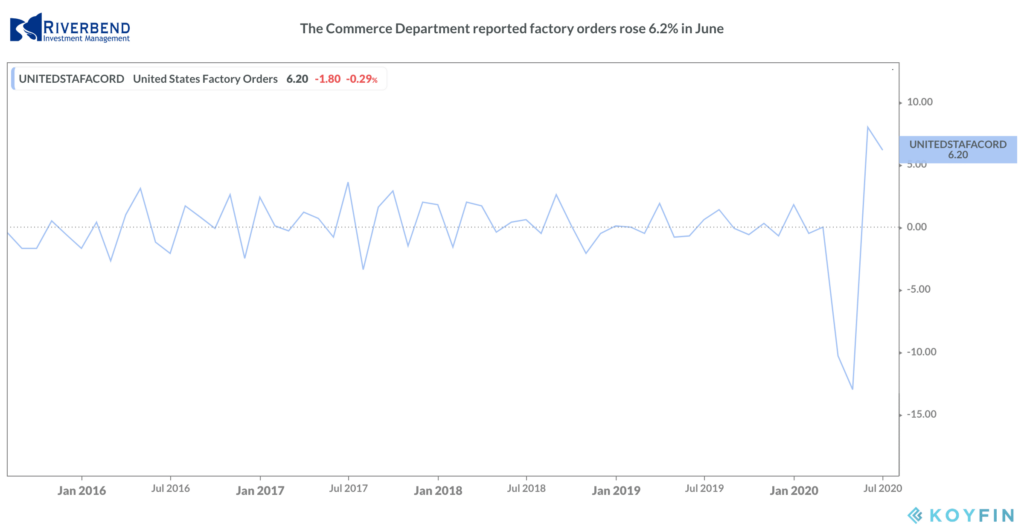 The Commerce Department reported factory orders rose 6.2% in June, up for the second consecutive month. Economists had expected just a 4.9% increase.
The combined gain for May and June was a record, confirming a recovery from the pandemic slump in the prior two months. Even so, factory orders are still down 11.9% from their level in February—underscoring just how deep the contraction was.
Non-durable goods orders surged 5.0%, the most since March 1996, led by petroleum. Durable goods were revised up to 7.6% from 7.3% led by vehicles. Nonetheless, year-over-year factory orders are down 16.5% near their steepest decline since October of 2009.
Chart of the Week:
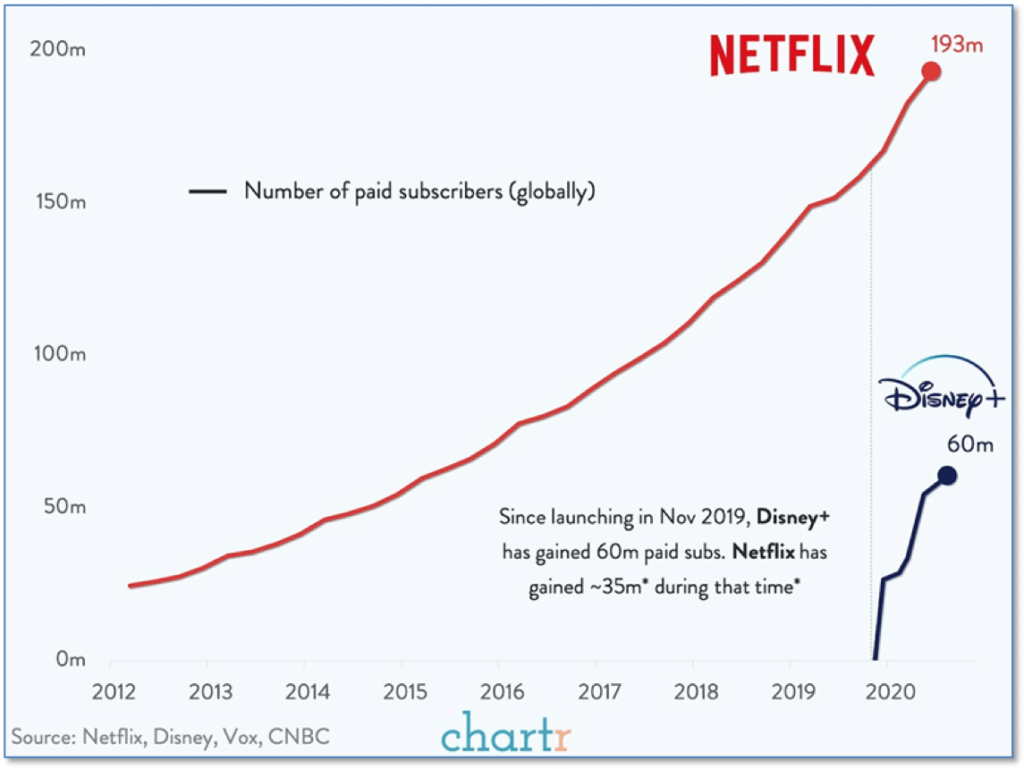
When it comes to streaming television choices, Netflix, Hulu and Amazon Prime probably quickly come to mind. However, Disney Plus, which had its debut less than a year ago, is quickly gaining ground on those leaders.
This week, Disney announced the achievement of 60 million paid subscribers in less than a year, almost double the number Netflix added over the same period.
Furthermore, once you consider the 35 million+ Hulu subscribers and the 8.5 million ESPN subscribers (both of which are owned by Disney) it is likely Disney has close to, or over, 100 million unique subscribers among its streaming properties. The mouse roars! (Chart by chartr.co)
Riverbend Indicators Update:

Each week we post notable changes to the various market indicators we follow.
As a reading of our Bull-Bear Indicator for U.S. Equities (comparative measurements over a rolling one-year timeframe), we remain in Cyclical Bull territory.
Counting-up of the number of all our indicators that are ‘Up’ for U.S. Equities, the current tally is that four of four are Positive, representing a multitude of timeframes (two that can be solely days/weeks, or months+ at a time; another, a quarter at a time; and lastly, the {typically} years-long reading, that being the Cyclical Bull or Bear status).
The Week Ahead:
Monday: U.S. JOLTs Job Openings 5.30 mln exp, 5.40 mln prior
Tuesday: U.S. NFIB Small Business Optimism Index 101.7 exp, 100.6 prior; U.S. PPI m/m +0.3% exp, -0.2% prior
Wednesday: U.S. CPI m/m +0.3% exp, +0.6% prior U.S.; 10-year Note Auction 0.65 WI, 2.6 b/c
Thursday: U.S. Unemployment Claims 1.2 mln exp, 1.18 mln prior; U.S. Import Prices +0.6% exp, +1.4% prior
Friday: U.S. Retail Sales m/m N/A exp, +7.5% prior; U.S. Core Retail Sales m/m N/A exp, +7.3% prior; Prelim UoM Consumer Sentiment N/A exp, 72.5 prior
[/fusion_text][/fusion_builder_column][/fusion_builder_row][/fusion_builder_container]


