[fusion_builder_container hundred_percent=”no” equal_height_columns=”no” menu_anchor=”” hide_on_mobile=”small-visibility,medium-visibility,large-visibility” class=”” id=”” background_color=”” background_image=”” background_position=”center center” background_repeat=”no-repeat” fade=”no” background_parallax=”none” parallax_speed=”0.3″ video_mp4=”” video_webm=”” video_ogv=”” video_url=”” video_aspect_ratio=”16:9″ video_loop=”yes” video_mute=”yes” overlay_color=”” video_preview_image=”” border_size=”” border_color=”” border_style=”solid” padding_top=”” padding_bottom=”” padding_left=”” padding_right=””][fusion_builder_row][fusion_builder_column type=”1_6″ spacing=”” center_content=”no” link=”” target=”_self” min_height=”” hide_on_mobile=”small-visibility,medium-visibility,large-visibility” class=”” id=”” hover_type=”none” border_size=”0″ border_color=”” border_style=”solid” border_position=”all” border_radius=”” box_shadow=”no” dimension_box_shadow=”” box_shadow_blur=”0″ box_shadow_spread=”0″ box_shadow_color=”” box_shadow_style=”” padding_top=”” padding_right=”” padding_bottom=”” padding_left=”” margin_top=”” margin_bottom=”” background_type=”single” gradient_start_color=”” gradient_end_color=”” gradient_start_position=”0″ gradient_end_position=”100″ gradient_type=”linear” radial_direction=”center” linear_angle=”180″ background_color=”” background_image=”” background_image_id=”” background_position=”left top” background_repeat=”no-repeat” background_blend_mode=”none” animation_type=”” animation_direction=”left” animation_speed=”0.3″ animation_offset=”” filter_type=”regular” filter_hue=”0″ filter_saturation=”100″ filter_brightness=”100″ filter_contrast=”100″ filter_invert=”0″ filter_sepia=”0″ filter_opacity=”100″ filter_blur=”0″ filter_hue_hover=”0″ filter_saturation_hover=”100″ filter_brightness_hover=”100″ filter_contrast_hover=”100″ filter_invert_hover=”0″ filter_sepia_hover=”0″ filter_opacity_hover=”100″ filter_blur_hover=”0″ last=”no”][/fusion_builder_column][fusion_builder_column type=”2_3″ layout=”1_1″ background_position=”left top” background_color=”” border_size=”” border_color=”” border_style=”solid” border_position=”all” spacing=”yes” background_image=”” background_repeat=”no-repeat” padding_top=”” padding_right=”” padding_bottom=”” padding_left=”” margin_top=”0px” margin_bottom=”0px” class=”” id=”” animation_type=”” animation_speed=”0.3″ animation_direction=”left” hide_on_mobile=”small-visibility,medium-visibility,large-visibility” center_content=”no” last=”no” min_height=”” hover_type=”none” link=””][fusion_text]
U.S. Markets: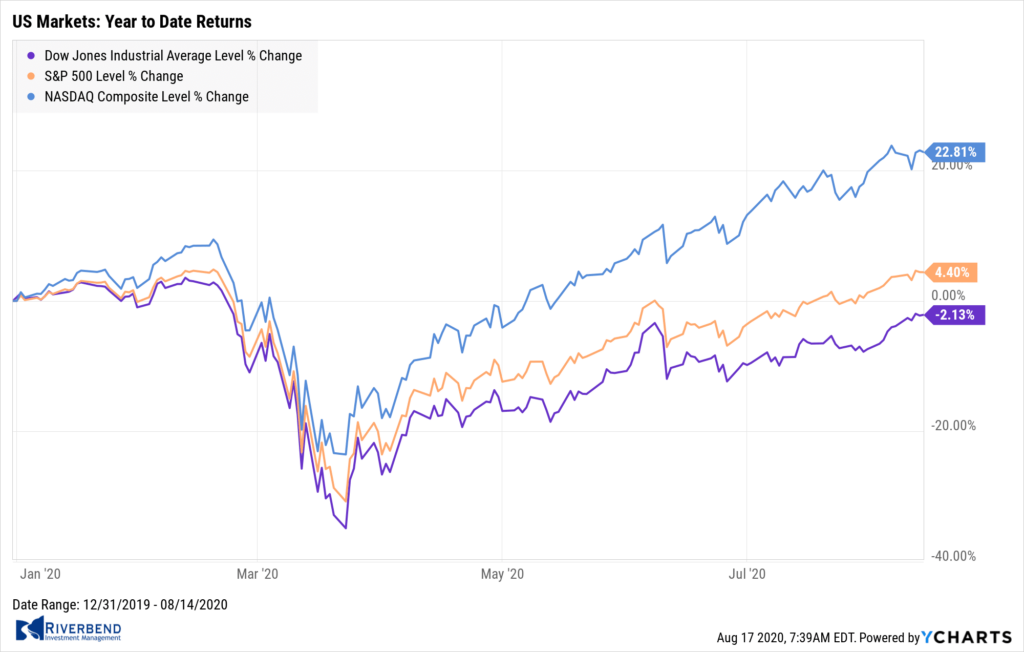
The major indexes posted gains for the week, lifting the benchmark S&P 500 index to within roughly 0.2% of its all-time high from February.
The Dow Jones Industrial Average added almost 500 points, rising 1.8% to 27,931.
The technology-heavy Nasdaq Composite ticked up just 0.1% to 11,019.
By market cap, the large cap S&P 500, mid cap S&P 400, and small cap Russell 2000 all coincidentally finished the week up 0.6%.
International Markets: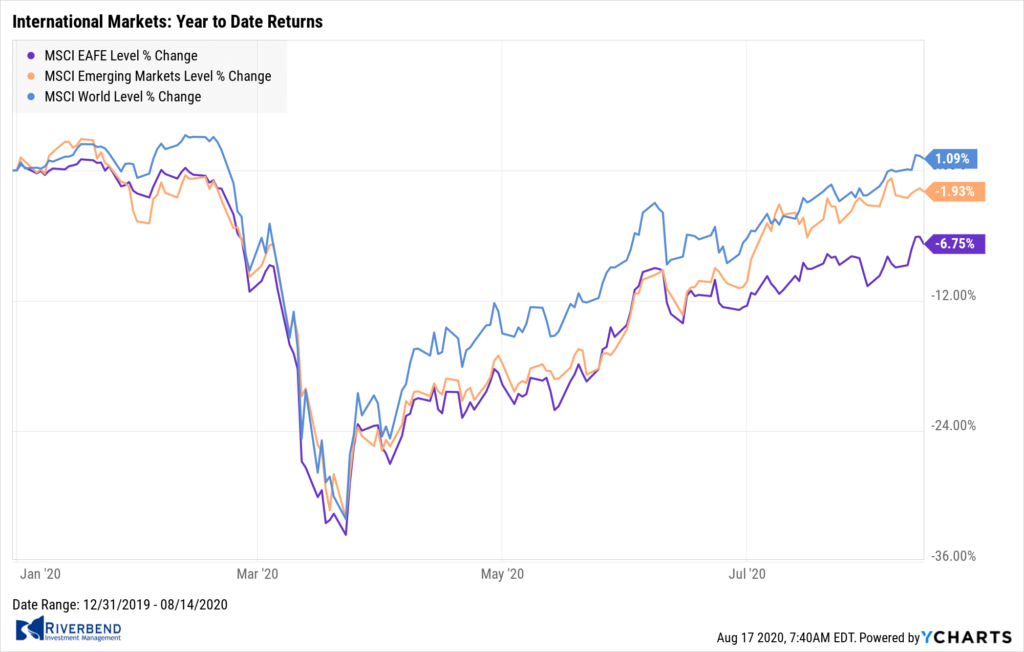
Canada’s TSX was the only major international index to finish in the red last week, finishing down ‑0.2%.
The United Kingdom’s FTSE added 1.0%. France’s CAC 40 and Germany’s DAX rose 1.5% and 1.8%, respectively.
In Asia, China’s Shanghai Composite added 0.2%, while Japan’s Nikkei jumped 4.3%.
As grouped by Morgan Stanley Capital International, developed markets rose 1.8% and emerging markets added 0.8%.
Commodities: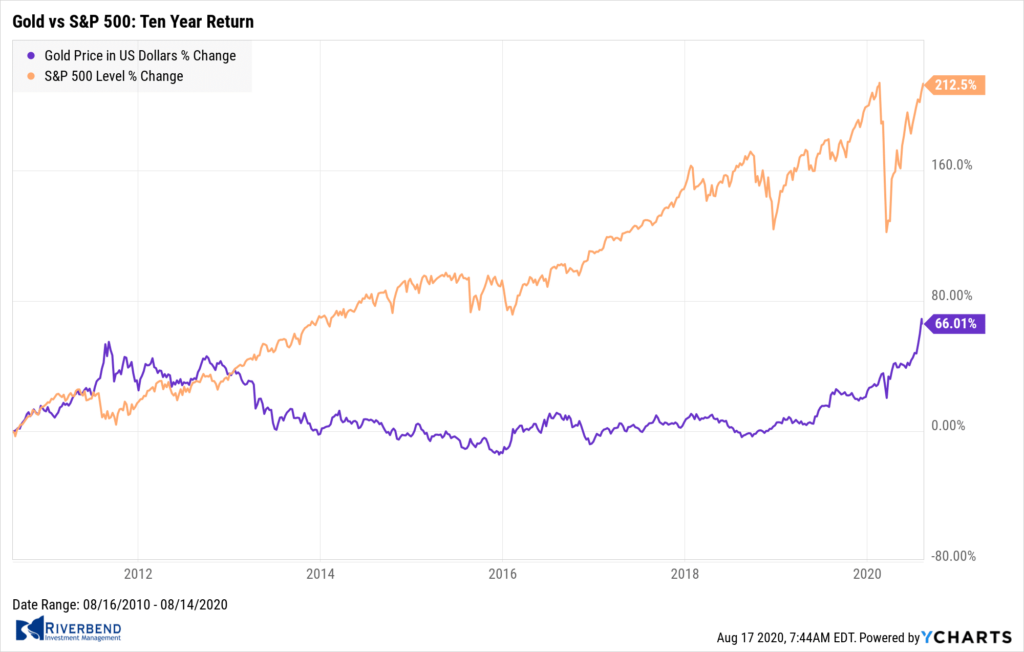
Gold had its first down week in more than two months closing at $1949.80 an ounce, a decline of ‑3.9%. Silver declined an even steeper -5.3% to $26.09 per ounce.
Crude oil finished up for a second week. West Texas Intermediate crude oil finished the week at $42.01 per barrel—a gain of 1.9%.
The industrial metal copper, viewed by some analysts as a barometer of world economic health due to its wide variety of uses, rebounded 2.4% last week.
U.S. Economic News: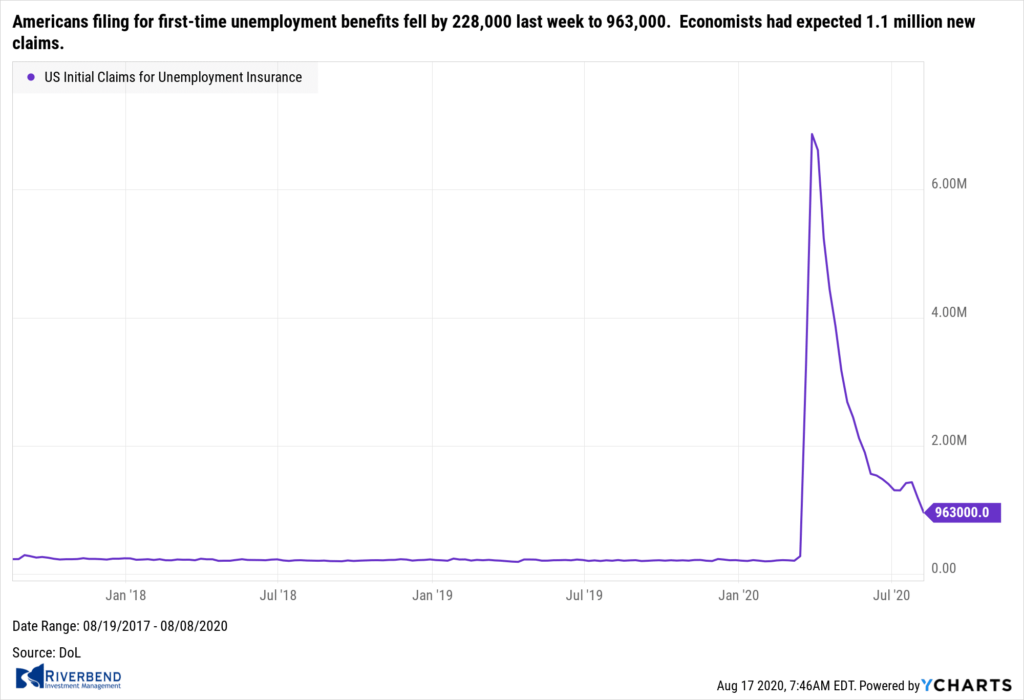
The number of Americans filing for first-time unemployment benefits fell by 228,000 last week to 963,000. Economists had expected 1.1 million new claims. This was the lowest level since March when the economic shutdown from the coronavirus took hold. While still far from normal, the decline in initial claims suggests a gradual improvement in labor market conditions. It also implies that the economic recovery that had stalled in July is getting back on track. Continuing claims, which counts the number of Americans already receiving benefits, fell by 604,000 to 15.486 million.
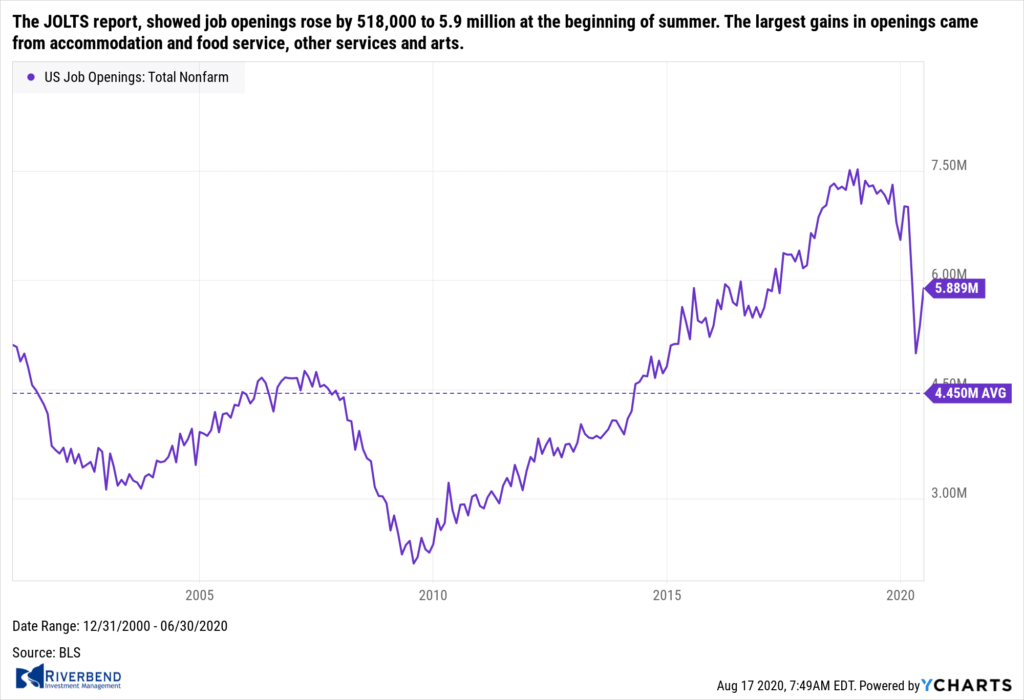 The number of job openings rose by over half a million in June, according to the latest data from the Labor Department. The Job Openings and Labor Turnover Survey, known as the JOLTS report, showed job openings rose by 518,000 to 5.9 million at the beginning of summer. The reading was above the median forecast of 5.3 million. The increase followed a gain of 375,000 in May. The largest gains in openings came from accommodation and food service, other services and arts. The biggest declines were in construction and state and local government education. The number of people who voluntarily left their jobs, known as the “quits rate”, rose to 1.9% from 1.8% in May. That reading remains significantly below its peak of 3.2% before the pandemic hit.
Confidence among the nation’s small business owners slipped last month as cases of the coronavirus continued to surge across the country. The National Federation of Independent Business (NFIB) reported its Small Business Optimism Index came in at 98.8 in July, a 1.8 point decline from its June reading. Economists had expected a reading of 99.9. The NFIB is a monthly snapshot of small businesses in the U.S., which account for nearly half of private sector jobs. Economists look to the report for a read on domestic demand and to extrapolate hiring and wage trends in the broader economy. NFIB’s chief economist Bill Dunkelberg stated, “This summer has been challenging for many small business owners who are working hard to keep their doors open and remain in business.”
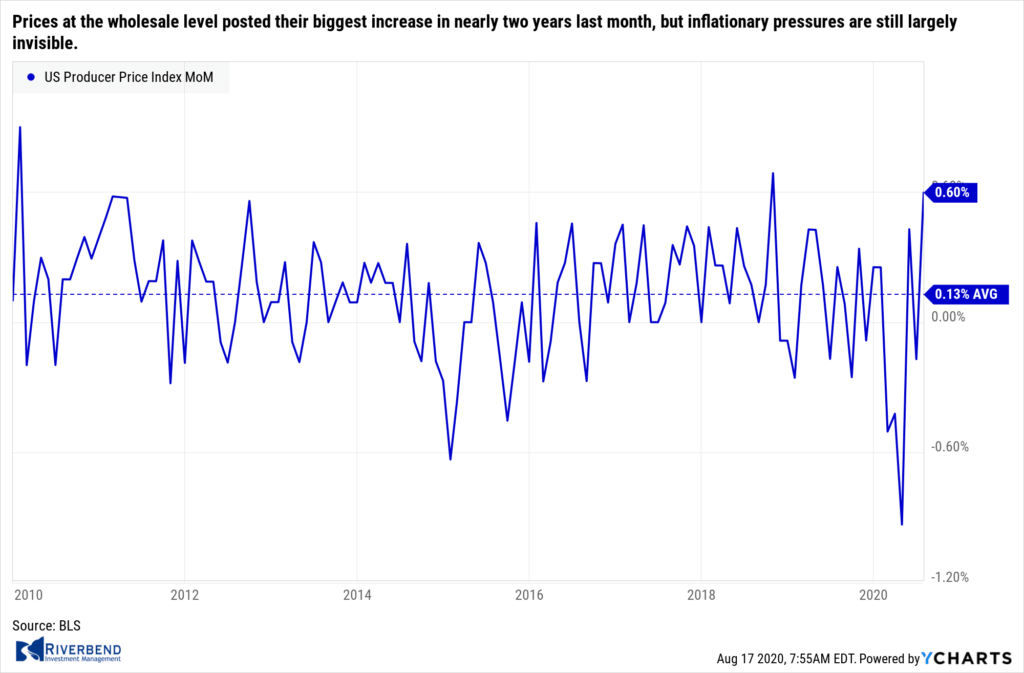 Prices at the wholesale level posted their biggest increase in nearly two years last month, but inflationary pressures were still largely invisible in the economy analysts said. The Producer Price Index (PPI) for final demand jumped 0.6% in July, the most since October 2018, and double the consensus of 0.3%. Core PPI, or PPI ex-food and energy, rose 0.3%, also the most since October 2016, and above the consensus of 0.1%. On an annual basis, the PPI for final demand was still down 0.4% indicating inflation doesn’t appear to be an issue anytime soon. Scott Brown, chief economist at Raymond James stated, “Figures have been choppy in recent months, but there is no significant upward pressure on wholesale prices.”
At the consumer level prices jumped for the second month in a row, but as with prices at the producer level, overall inflation remains low. The consumer price index rose 0.6% in July. Economists had forecast a 0.4% advance. The increase in consumer prices over the past 12 months, meanwhile, rose to 1% from 0.6% in June. Just seven months ago, at the start of 2020, the yearly pace of inflation had climbed to as high as 2.5%. Another closely watched measure of inflation that strips out food and energy also shot up 0.6% last month. The increase in the core rate was the largest since 1991, but it follows a record decline. The yearly increase in the so-called core rate moved up to 1.6% from 1.2%.
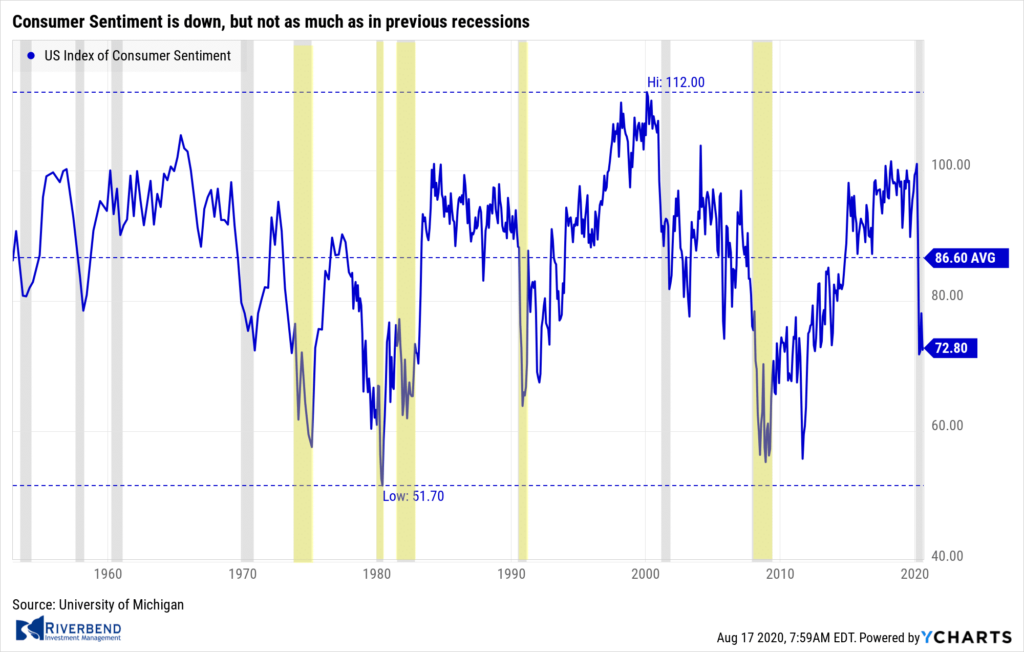 Sentiment among the nation’s consumers remained nearly flat in a preliminary August survey. The University of Michigan’s Consumer Sentiment Index ticked up only 0.3 points to 72.8. The consensus was for a reading of 71.0. In the details, expectations ticked up 0.6 points while current conditions edged down 0.3 points. At the end of the day, sentiment was still near its lowest level since July 2012, and significantly below its pre-recession high of 101.0, as consumers remain cautious. On an annual basis, the sentiment index is still down 18.9%. Although there has been a marginal improvement since May, such negative momentum has historically been associated with an economic slowdown or recession.
Chart of the Week:
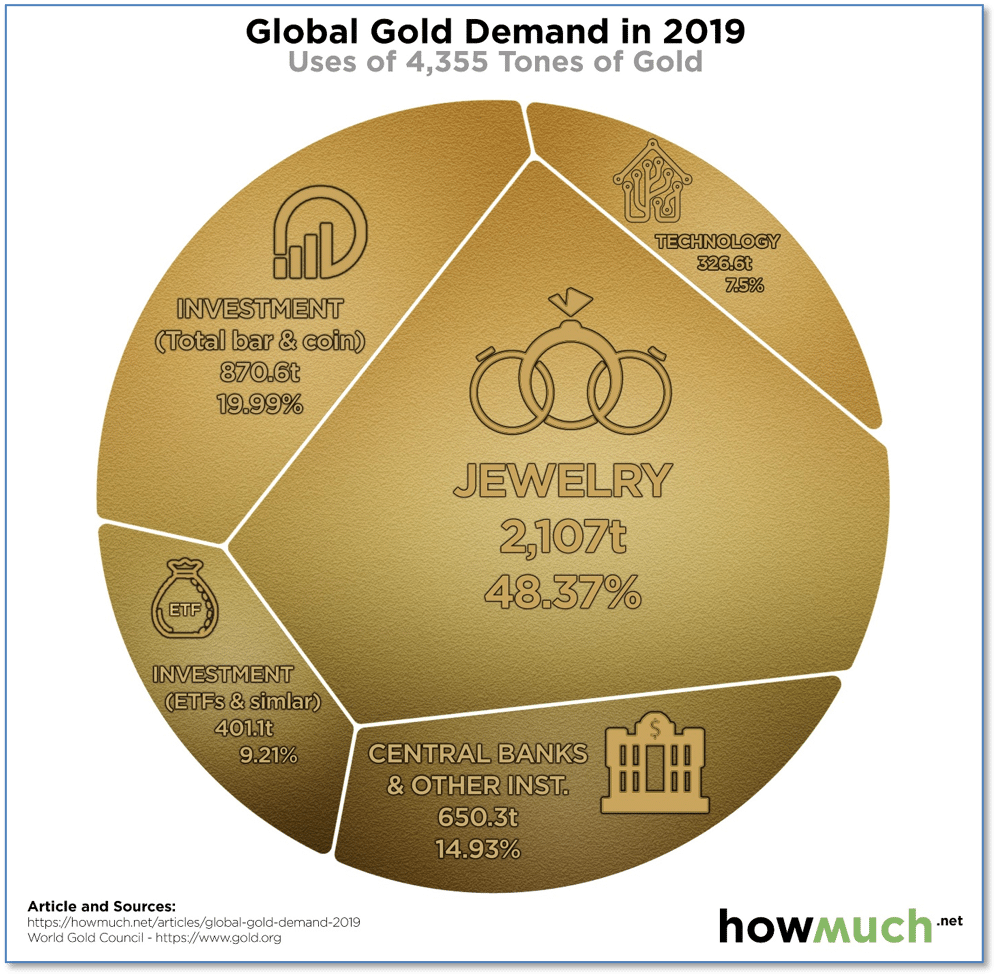
With market volatility picking up and what’s sure to be an extremely divisive election season around the corner, “safe haven” investments such as precious metals are seeing more investor interest.
Prior to this week, gold enjoyed nine consecutive weeks of gains.
Data visualization’s site, www.howmuch.net, looked deeper into how the world’s supply of Gold is actually used. They found the two biggest uses were for jewelry and investment. Interestingly, central banks and other large institutions accounted for less than 15% of 2019 consumption.
Riverbend Indicators Update:

Each week we post notable changes to the various market indicators we follow.
- As a reading of our Bull-Bear Indicator for U.S. Equities (comparative measurements over a rolling one-year timeframe), we remain in Cyclical Bull territory.
- Counting-up of the number of all our indicators that are ‘Up’ for U.S. Equities, the current tally is that four of four are Positive, representing a multitude of timeframes (two that can be solely days/weeks, or months+ at a time; another, a quarter at a time; and lastly, the {typically} years-long reading, that being the Cyclical Bull or Bear status).
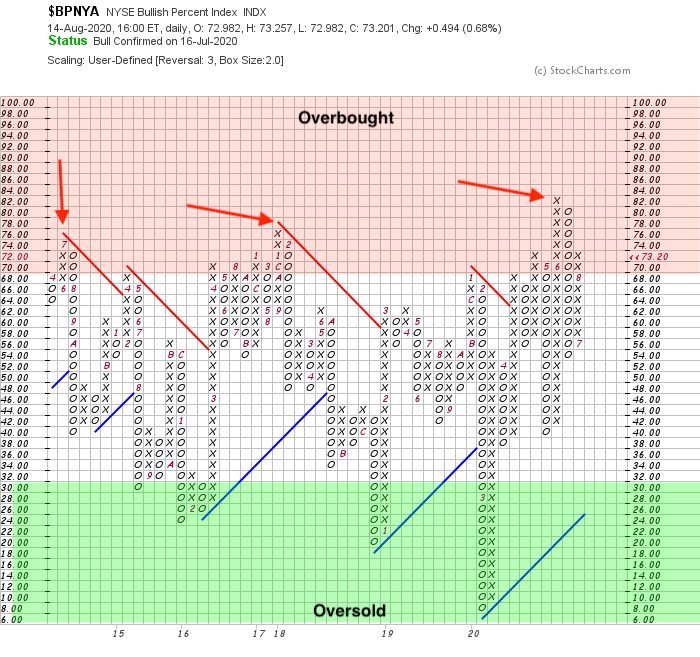
Is the market overbought at current levels?
This week, I want to take a look at the current state of the market. One question that comes up frequently, is “how overbought is the market?”
First, let’s take a look at the NYSE Bullish % Index. This chart helps visualize how overbought or oversold the market is. Levels above 70 are considered overbought, while levels below 30 are considered oversold.
The Xs and Os tell us if the trend is rising (X) or falling (O).
The current status of the index is telling us that the market is slightly overbought – but it can go higher and stay higher.
Interestingly, when we look at the Nasdaq 100 Bullish % Index, we see a different story. The tech-heavy weighted index is not overbought:
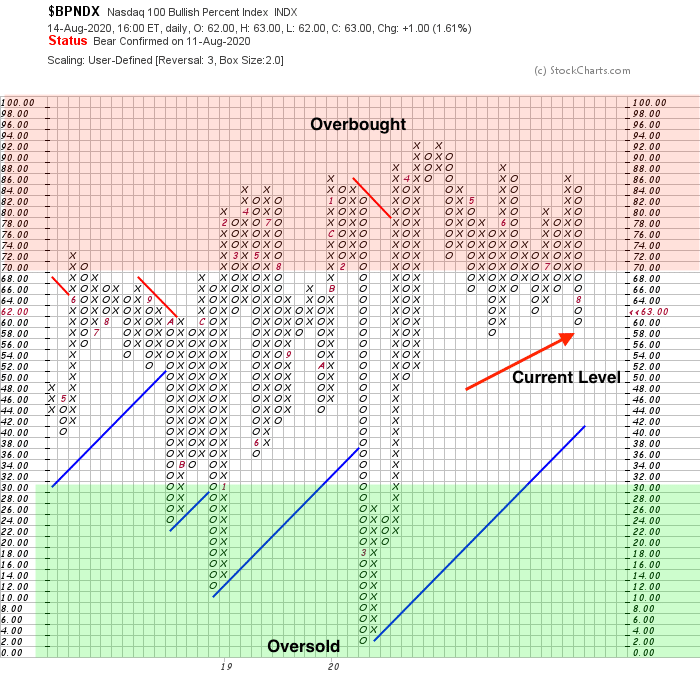
Why is this? Despite the outperformance of the technology sector year to date, we have been seeing sector rotation into sectors that were “left behind”.
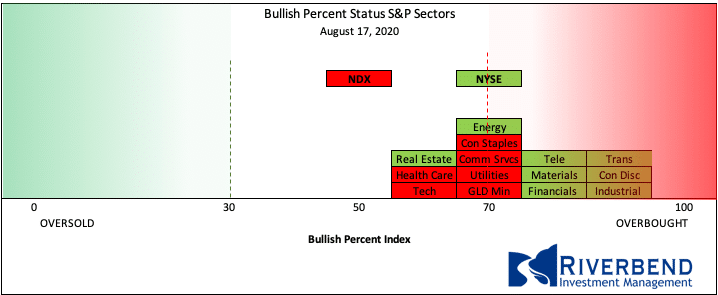
When we take the sector bullish % rankings and overlay them onto a bell curve chart, we can see how overbought the “left behind” sectors have become — all at the expense of the technology sector.
Going forward, I would expect to see a rotation out of these overbought sectors and back into technology.
The Week Ahead:
Monday:
- U.S. Mortgage Delinquencies 4.36% prior
- U.S. NAHB Housing Market Index 74 exp, 72 prior
- Empire State Manufacturing Index 14.6 exp, 17 .2 prior
Tuesday:
- U.S. Building Permits 1.33 mln exp, 1.26 mln prior
- U.S. Housing Starts 1.23 mln exp, 1.19 mln prior
Wednesday:
- U.S. Crude Oil Inventories N/A exp, -4.5mln prior
- U.S. FOMC Meeting Minutes
Thursday:
- U.S. Unemployment Claims 990k exp, 963k prior
- U.S. Philly Fed Mfg Index 21 exp, 24.1 prior
Friday:
- U.S. Flash Mfg PMI 51.6 exp, 50.9prior
- U.S. Flash Services PMI 50.7 exp, 50 prior
- Existing Home sales 5.4mln exp, 4.72 mln prior
[/fusion_text][/fusion_builder_column][/fusion_builder_row][/fusion_builder_container]


