[fusion_builder_container hundred_percent=”no” equal_height_columns=”no” menu_anchor=”” hide_on_mobile=”small-visibility,medium-visibility,large-visibility” class=”” id=”” background_color=”” background_image=”” background_position=”center center” background_repeat=”no-repeat” fade=”no” background_parallax=”none” parallax_speed=”0.3″ video_mp4=”” video_webm=”” video_ogv=”” video_url=”” video_aspect_ratio=”16:9″ video_loop=”yes” video_mute=”yes” overlay_color=”” video_preview_image=”” border_size=”” border_color=”” border_style=”solid” padding_top=”” padding_bottom=”” padding_left=”” padding_right=””][fusion_builder_row][fusion_builder_column type=”1_1″ layout=”1_1″ background_position=”left top” background_color=”” border_size=”” border_color=”” border_style=”solid” border_position=”all” spacing=”yes” background_image=”” background_repeat=”no-repeat” padding_top=”” padding_right=”” padding_bottom=”” padding_left=”” margin_top=”0px” margin_bottom=”0px” class=”” id=”” animation_type=”” animation_speed=”0.3″ animation_direction=”left” hide_on_mobile=”small-visibility,medium-visibility,large-visibility” center_content=”no” last=”no” min_height=”” hover_type=”none” link=””][fusion_text]
[/fusion_text][fusion_vimeo id=”576825125″ alignment=”center” width=”1000″ height=”” autoplay=”false” api_params=”” hide_on_mobile=”small-visibility,medium-visibility,large-visibility” class=”” css_id=”” /][fusion_text][fusion_text][fusion_text]
U.S. Markets:
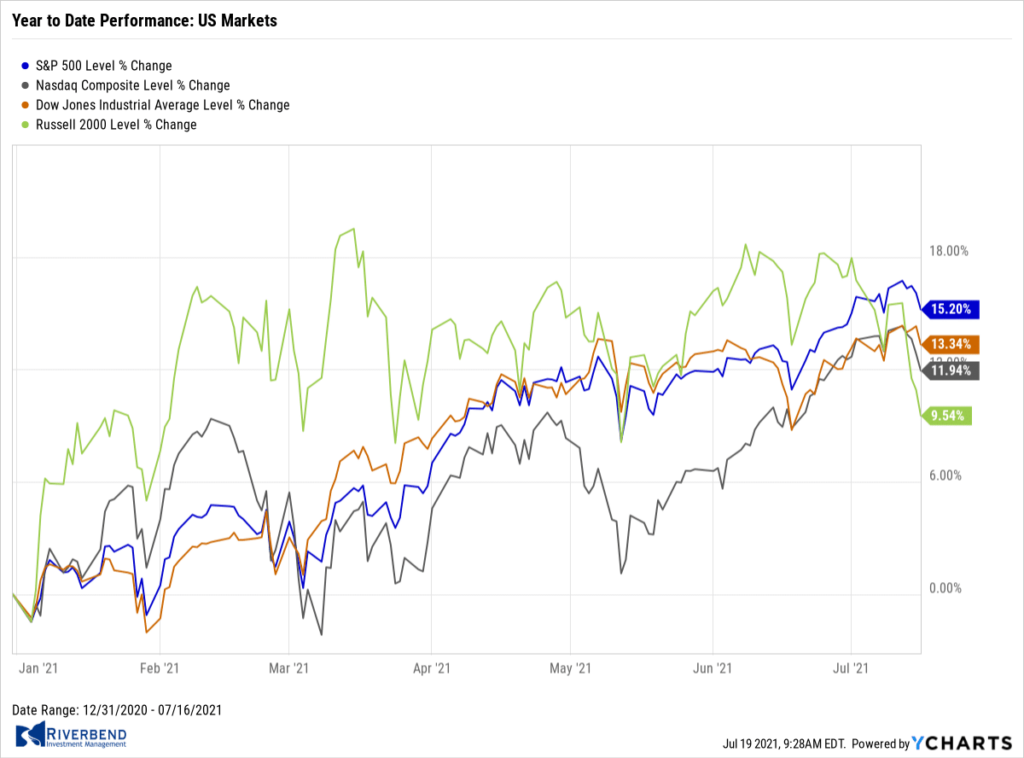
The major U.S. indexes finished the week lower, but the large cap S&P 500 and NASDAQ Composite hit new intraday highs mid-week before falling back. The small-cap Russell 2000 underperformed for a third consecutive week.
The Dow Jones Industrial Average shed 182 points finishing the week at 34,688—a decline of -0.5%. The technology-heavy NASDAQ retraced all of last week’s gain ending the week down -1.9%.
By market cap, the large cap S&P 500 retreated -1.0%, while the mid cap S&P 400 and small cap Russell 2000 indexes experienced much larger declines of -3.3% and -5.1%, respectively.
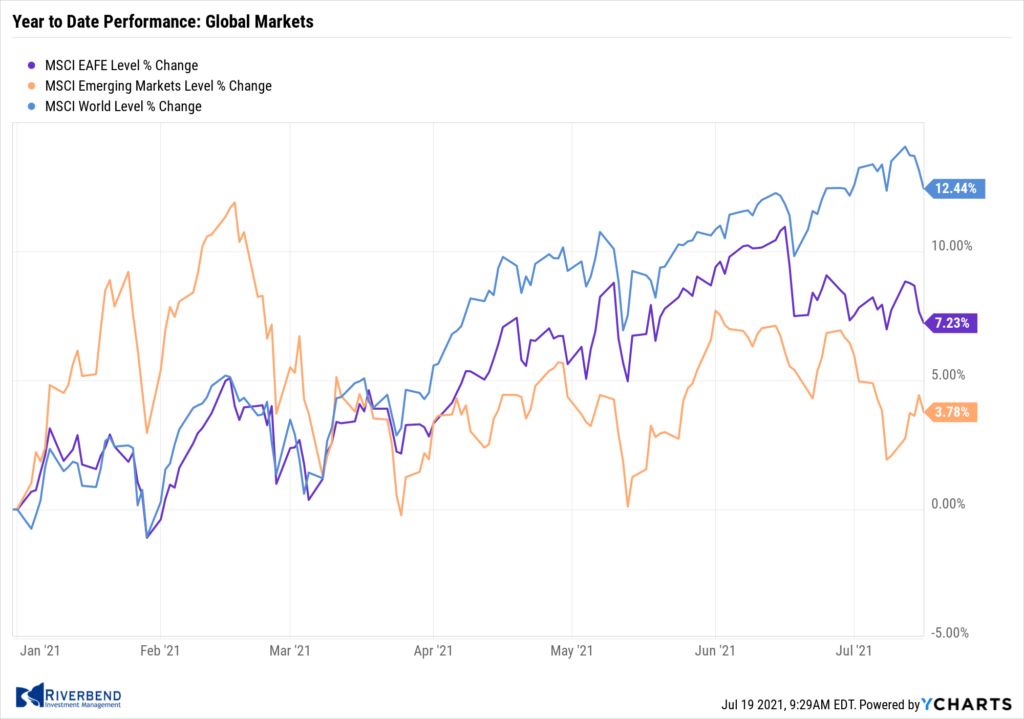
International Markets:
Canada’s TSX finished the week down -1.3%, while the United Kingdom’s FTSE 100 gave up ‑1.6%.
On Europe’s mainland, France’s CAC 40 declined -1.1% and Germany’s DAX retreated -0.9%.
In Asia, China’s Shanghai Composite rose 0.4% along with Japan’s Nikkei which added 0.2%.
As grouped by Morgan Stanley Capital International, developed markets declined -1.6% while emerging markets ticked up 0.1%.
Commodities: 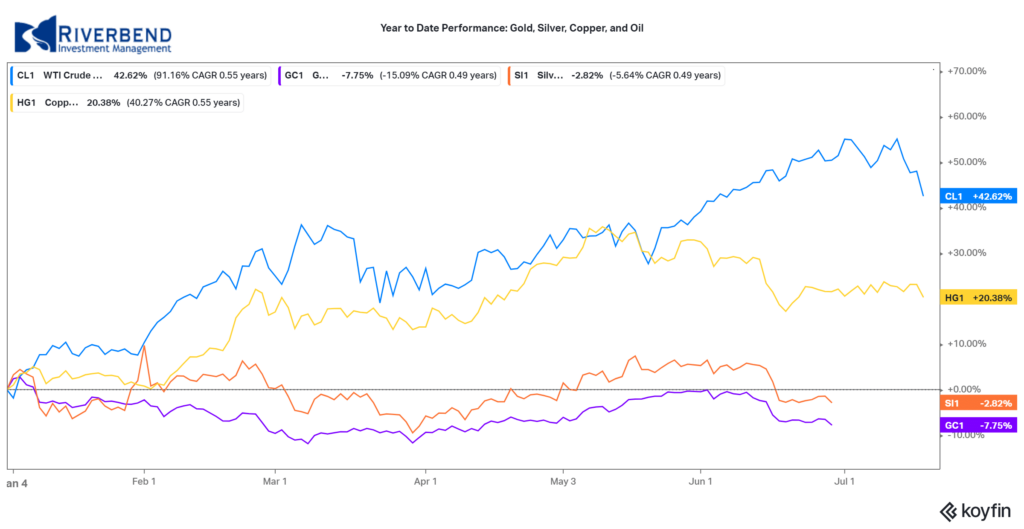
Precious metals finished the week mixed. Gold rose for a fourth consecutive week by rising 0.2% to $1815.00, while Silver retreated -1.7% or $25.80 per ounce.
Energy retreated for a second week. West Texas Intermediate crude oil pulled back -4.0% to $71.56 per barrel.
The industrial metal copper, viewed by some analysts as a barometer of global economic health due to its wide variety of uses, finished the week down -0.5%.
U.S. Economic News: 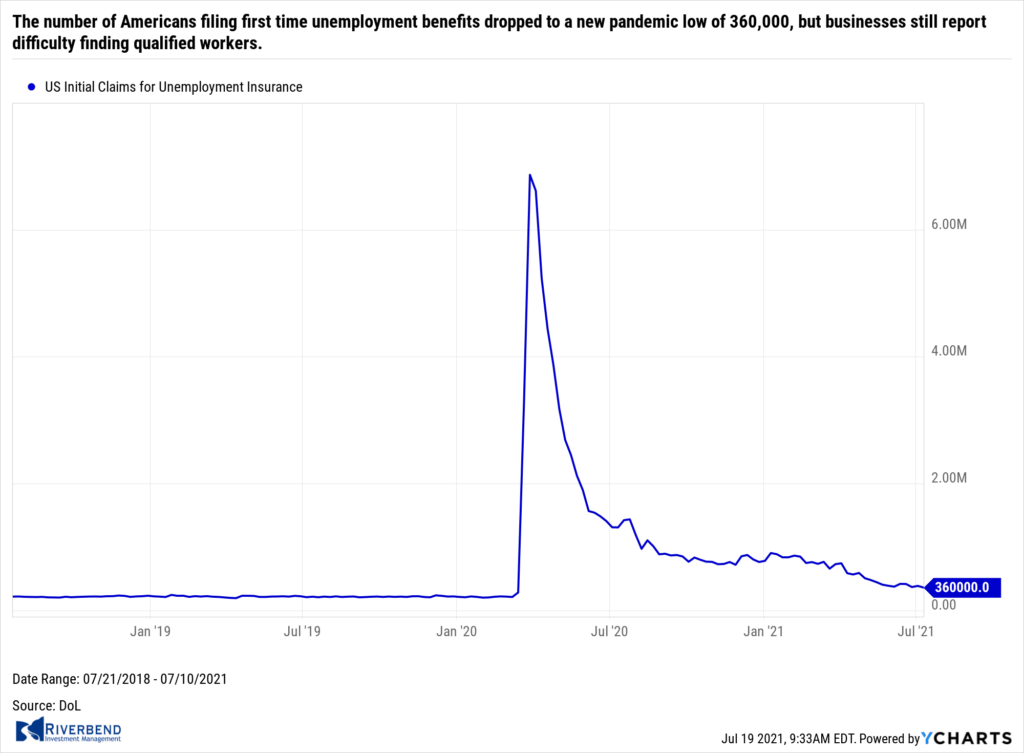
The number of Americans filing first time unemployment benefits dropped to a new pandemic low of 360,000, but businesses still report difficulty finding qualified workers. The Labor Department reported initial jobless claims fell by 26,000 to 360,000 last week—matching forecasts. Claims had been running in the low 200,000’s before the viral outbreak early last year.
New jobless claims fell the most in Georgia, Rhode Island, Alabama and Maryland. The only states to report big increases were New York and Texas. Meanwhile, continuing claims, which counts the number of Americans already receiving benefits, fell by 126,000 to 3.24 million. Continuing claims also fell to new pandemic lows.
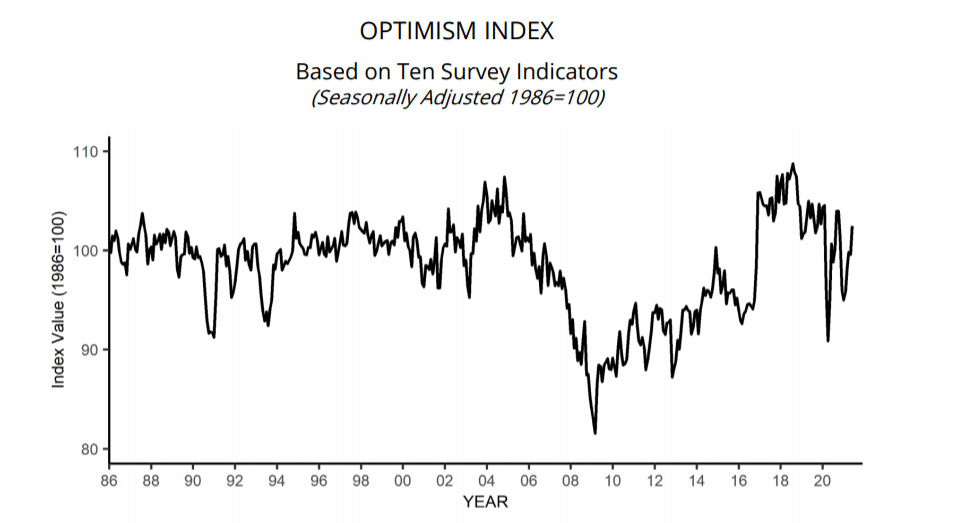
Across the country the nation’s small business owners are raising wages, but skilled worked remain hard to find. The National Federation of Independent Businesses (NFIB), the nation’s most prominent small business lobbying group, reports small businesses are more bullish on the U.S. economy, but continue to struggle to hire enough qualified workers to keep up with booming sales.
Source: National Federation of Independent Businesses (NFIB)
The closely-watched NFIB index of small business confidence rose last month to its highest level in eight months. The index climbed 2.9 points to 102.5, topping 100 for the first time since November. It had pulled back in May for the first time this year. Some 46% of small businesses said they could not fill open jobs, down slightly from a record high in May. A record number of firms raised wages and benefits in an effort to lure new hires and to retain valued employees, but even that wasn’t enough. Businesses say their biggest problem is a lack of qualified workers and higher labor costs.
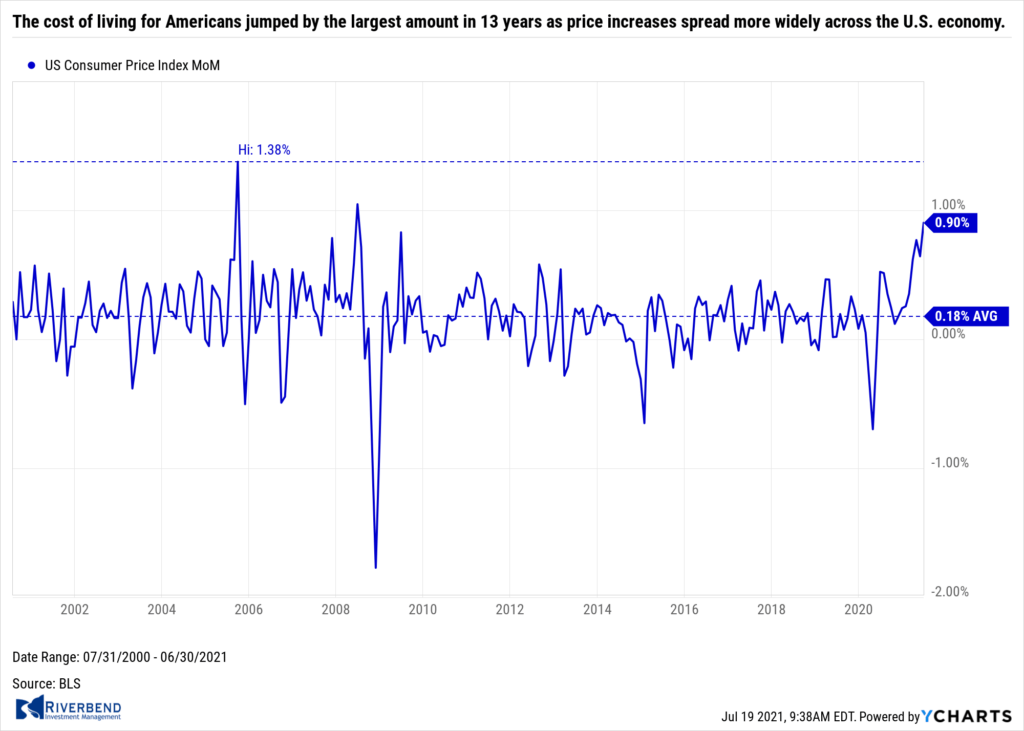 The cost of living for Americans jumped by the largest amount in 13 years as price increases spread more widely across the U.S. economy. The government reported its Consumer Price Index climbed 0.9% last month. The increase easily blew away economists’ expectations for just a 0.5% advance. The rate of inflation in the 12 months ended in June climbed to 5.4% from 5%. The last time prices rose that fast was in 2008, when oil hit a record $150 a barrel. Furthermore, core inflation, which measures price increases that omit the often-volatile food and energy categories, also rose 0.9% in June. The 12-month core rate increased to 4.5% from 3.8%–a 29-year high. So is the “it’s transitory” debate over? Jennifer Lee, senior economist at BMO Capital Markets stated, “The answer is no, the transitory debate is far from over. In fact, it got a little hotter.”
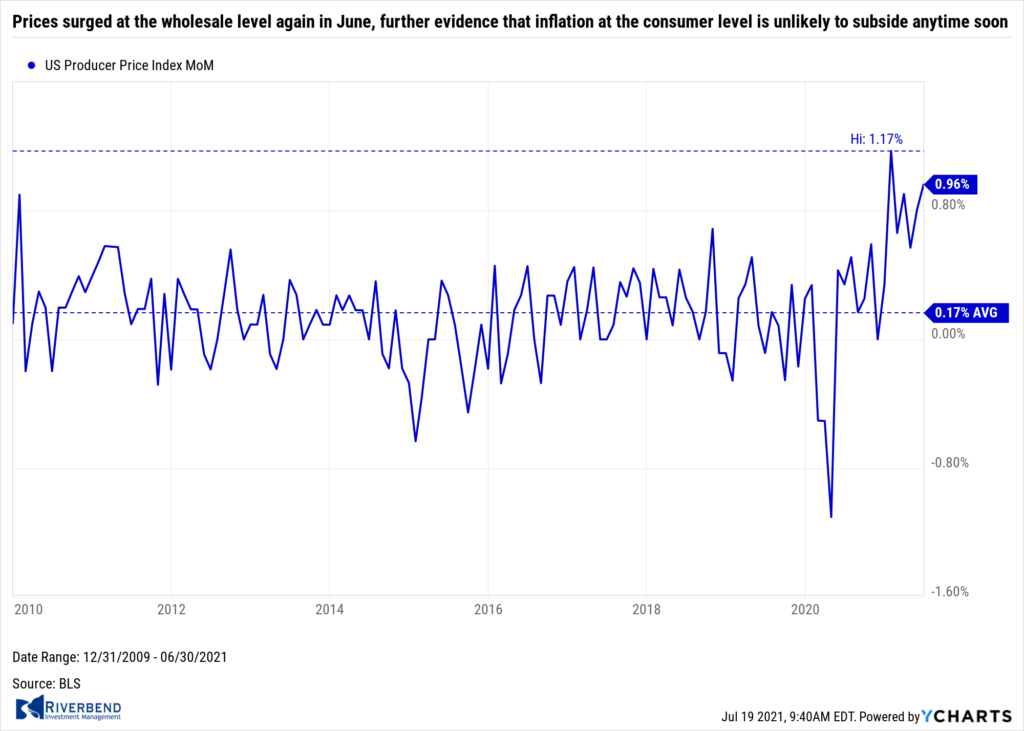 Prices surged at the wholesale level again in June, further evidence that inflation at the consumer level is unlikely to subside anytime soon. The Labor Department reported its Producer Price Index (PPI) jumped nearly 1% last month, almost double the consensus forecast of 0.6%. The annualized pace of wholesale inflation surged to 7.3% from 6.6% in May. That’s the highest level since the index was overhauled in 2010, and one of the highest readings since the early 1980s.
About 60% of the increase in wholesale inflation reflected the higher cost of services, a volatile category that can swing sharply from month to month. The cost of goods also rose sharply last month. Wholesale food prices increased 0.8% in June, led by higher costs of beef, pork and chicken. The core rate of wholesale inflation, meanwhile, increased 0.5% last month. The core rate is a less volatile measure that strips out food, energy and trade margins. The increase in the core rate over the past 12 months edged up to 5.5% from 5.3%. That’s the largest advance since the government first began reporting it in 2014.
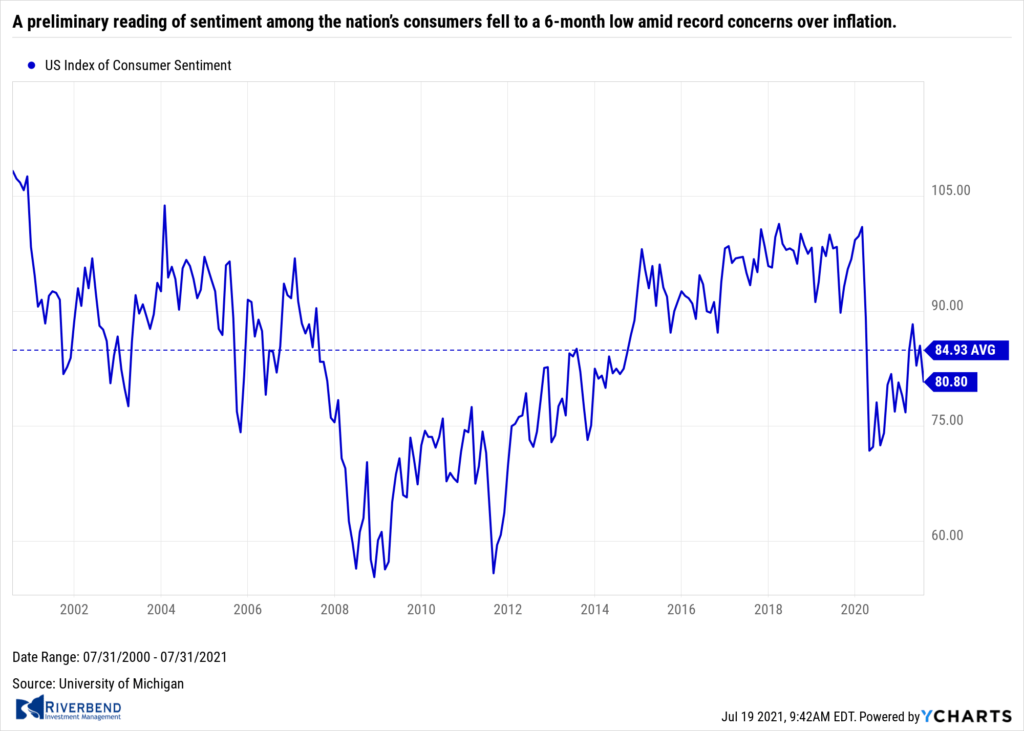
A preliminary reading of sentiment among the nation’s consumers fell to a 6-month low amid record concerns over inflation. The University of Michigan reported its preliminary reading of its consumer sentiment index fell to 80.8 in July from a final reading of 85.5 in June. The result missed economists’ expectations of 86.3 by a significant margin.
The sub-index that measures how consumers feel about the economy right now dipped to 84.5 from 88.6 in June, as consumers worried about the current pace of job gains. Consumer optimism about the next six months fell more sharply to 78.4 in July from 83.5 in June, as Americans have become more concerned about the effect of rising prices. Richard Curtin, the survey’s chief economist noted that “Consumers’ complaints about rising prices on homes, vehicles, and household durables have reached an all-time record.”
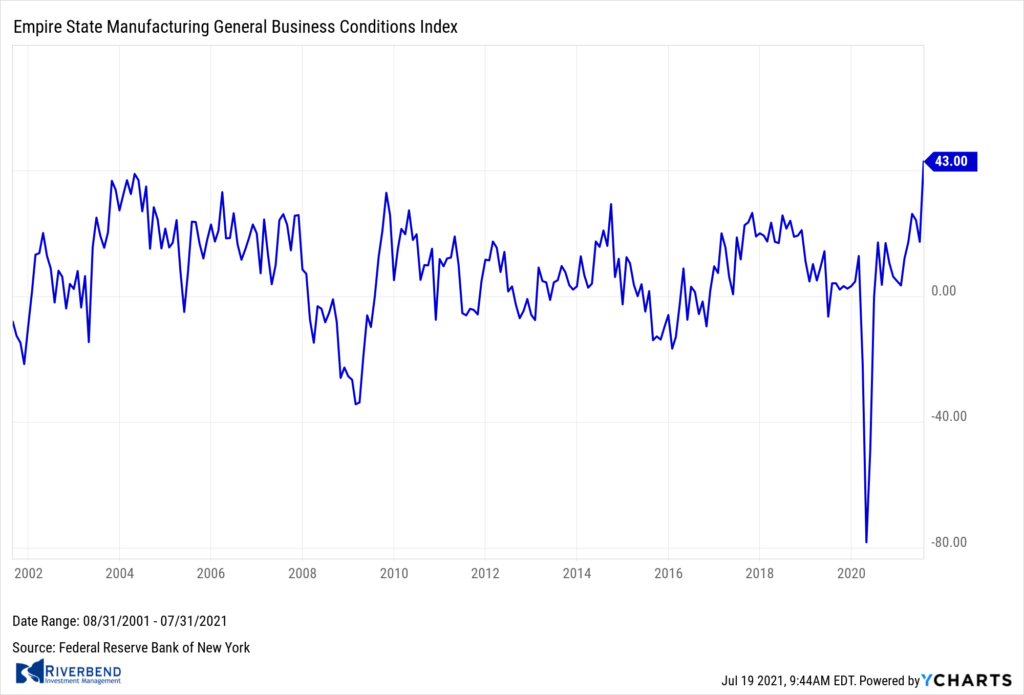 The New York Fed’s regional business conditions index surged to a record-high reading in July. The NY Fed’s Empire State index shot up 25.6 points to 43. Economists had expected a reading of just 17.3. In the details of the report, the subcomponents were also strong. The new-orders index rose 16.9 points to 33.2 in July while shipments rose 29.6 points to 43.8. The index for number of employees rose 8 points to 20.6. Inflation pressures remained. The prices received index rose 6 points to 39.4, a new record. The prices paid index slipped slightly but also remained near a record high.
The Federal Reserve’s “Beige Book”, a collection of anecdotal reports from each of the Fed’s member banks, stated the “robust” U.S. economy is “strengthening”—but it’s also grappling with shortages and higher inflation. “The U.S. economy strengthened further from late May to early July, displaying moderate to robust growth,” the Beige Book said.
Furthermore, “Supply-side disruptions became more widespread, including shortages of materials and labor, delivery delays, and low inventories of many consumer goods,” it said. Businesses told the Fed they’re not sure when they’ll be able to ramp up production to satisfy the demand. They still can’t get many supplies on time and many open jobs are going unfilled. “The outlook for demand improved further, but many contacts expressed uncertainty or pessimism over the easing of supply constraints,” the survey said.
Chart of the Week:
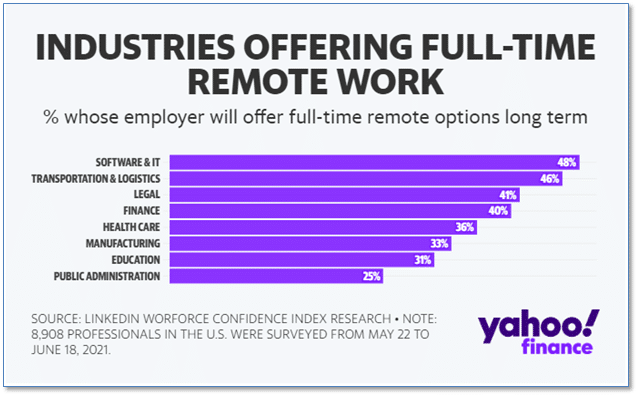
With the worst of the coronavirus epidemic in the rear view mirror, many employers have begun pushing employees to return to the office.
Surprising to perhaps no one, it turns out many workers would rather continue working from home.
According to LinkedIn’s Workforce Confidence Index, employers in the Software & IT, Transportation & Logistics and Legal sectors were most likely to allow employees to continue working from home. But workers in Public Administration and Education are most likely to be forced to return to the in-person daily grind.
Riverbend Indicators:

Each week we post notable changes to the various market indicators we follow.
- As a reading of our Bull-Bear Indicator for U.S. Equities (comparative measurements over a rolling one-year timeframe), we remain in Cyclical Bull territory.
- Counting up of the number of all our indicators that are ‘Up’ for U.S. Equities, the current tally is that four of four are Positive, representing a multitude of timeframes (two that can be solely days/weeks, or months+ at a time; another, a quarter at a time; and lastly, the {typically} years-long reading, that being the Cyclical Bull or Bear status).
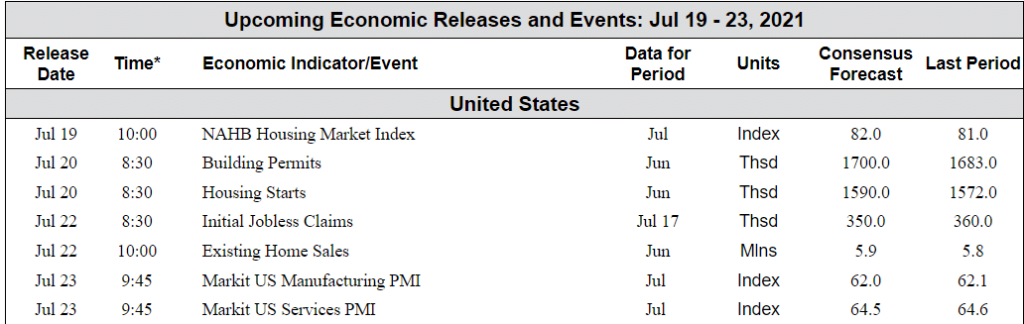
The Week Ahead:
(Sources: All index- and returns-data from Yahoo Finance; news from Reuters, Barron’s, Wall St. Journal, Bloomberg.com, ft.com, guggenheimpartners.com, zerohedge.com, ritholtz.com, markit.com, financialpost.com, Eurostat, Statistics Canada, Yahoo! Finance, stocksandnews.com, marketwatch.com, wantchinatimes.com, BBC, 361capital.com, pensionpartners.com, cnbc.com, FactSet.)
[/fusion_text][/fusion_builder_column][/fusion_builder_row][/fusion_builder_container]


