
Market Recap:
For the month of August, the Dow fell -1.7%, the NASDAQ -2.6%, and the S&P 500 ‑1.8%. The smaller cap S&P 400 and Russell 2000 indexes retreated a much deeper -4.4% and -5.1%, respectively.
Canada’s TSX managed a slight gain of 0.2%, but all other major international indexes finished the month down. The UK’s FTSE retreated -5%, while France’s CAC 40 and Germany’s DAX gave up -0.7% and -2.1%, respectively.
China’s Shanghai Composite fell -1.6% and Japan’s Nikkei finished down -3.8%. Emerging markets retreated -3.8% and developed markets lost -1.9%.
Gold and silver were the big winners in August, rising 6.4% and 11.8% in August, respectively, while oil and copper ended the month down -5.9% and -4.4%.
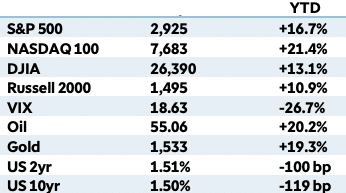
*as of 8/30/19
U.S. Economic News:
The number of Americans seeking first-time unemployment benefits rose slightly last week but remained near multi-decade lows. The Labor Department reported jobless claims rose by 4,000 to 215,000, nearly matching economists’ estimates of 214,000.
The less-volatile monthly average of new claims ticked down by 500 to 214,500. Both readings remain near 50-year lows. Continuing claims, which counts the number of people already receiving benefits, climbed by 22,000 to 1.7 million. These claims are also near a more than 40-year low.
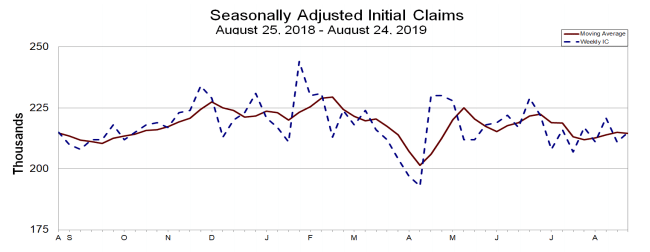
source: DOL
Thomas Simons, senior money market economist at Jefferies LLC stated in a note to clients, “The labor market remains tight and solid, layoff activity is light and there is no evidence in the economic data that suggests that these conditions will change any time soon.”
Home prices are rising at their slowest pace in almost seven years, according to the latest S&P CoreLogic Case-Shiller 20-city home price index. The index fell from an annual rate of growth of 2.4% to 2.1%. That’s down from an annual rate of 6.3% just one year ago.
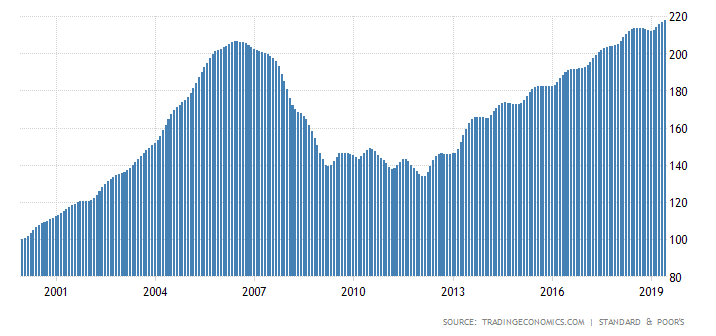
Of the 20 cities surveyed, 17 still posted increases but most were quite small. Over the past year, prices have risen the fastest in Phoenix and Las Vegas, up 5.8% and 5.5%, respectively. Seattle was the only city to have prices actually decline, down -1.3%. More broadly, the Case-Shiller nationwide home index showed prices were up 3.1% in June from the same time last year, down 0.2% from the previous month.
The number of homes in which a contract has been signed but not yet closed fell in July, following two months of gains. The National Association of Realtors (NAR) reported its index of pending home sales plunged ‑2.5% last month, far exceeding economists’ expectations of just a -0.3% decline.
All four regions of the country saw a decline in contract signings, with the West experiencing the largest declines. In the Northeast sales fell -1.6%, while in the South sales were down -2.4%. In the Midwest sales declined -2.5% and in the West sales were off ‑3.4%.
Compared to the same time last year, contract signings were down ‑0.3%. Lawrence Yun, the NAR’s chief economist wrote, “Economic uncertainty is no doubt holding back some potential demand, but what is desperately needed is more supply of moderately priced homes.”
The Commerce Department reported that orders for manufactured goods expected to last at least three years, so-called “durable goods”, jumped last month, led by airplane manufacturers. Orders for commercial aircraft surged 47.8%, predominantly due to Boeing.
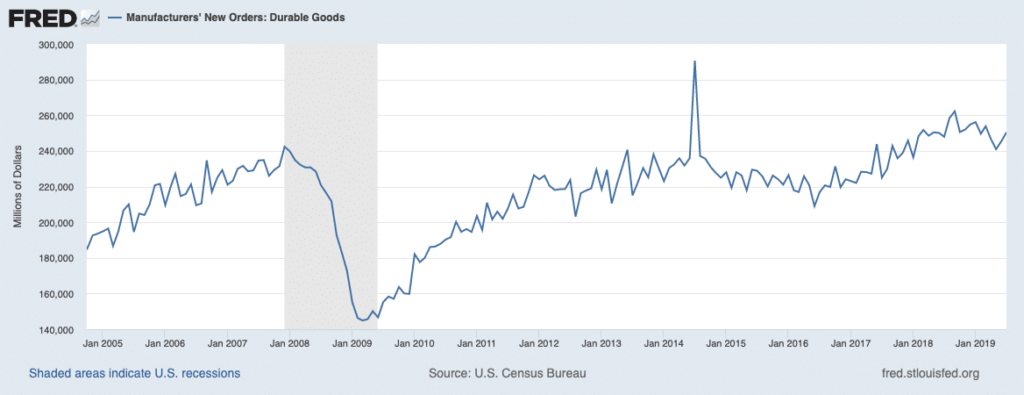 Overall, orders for durable goods rose 2.1% in July, exceeding the consensus forecast of a 0.9% increase. Excluding the transportation sector, however, “core” orders were actually down ‑0.4%, their biggest drop since March. Ian Shepherdson, chief economist at Pantheon Macroeconomics stated after the release, “No bottom yet for core orders.”
American consumers remain very confident in the U.S. economy despite the lingering trade dispute with China. The Conference Board reported its closely followed survey of consumer confidence fell -0.7 point to 135.1 in August.
Economists had predicted the index would plunge to 127.8 as the trade dispute between the U.S. and China hit financial markets earlier this month and sent interest rates plunging. The index remained near its post 2008 recession peak of 137.9 set last October.
The present situation index component, which measures how consumers feel about the economy “right now”, rose to 177.2 from 170.9. However the index which looks out over the next six months – the expectations index – appeared to reflect more worry as it slipped 5.4 points to 107. Lynn Franco, senior director of economic indicators at the board stated, “While other parts of the economy may show some weakening, consumers have remained confident and willing to spend.”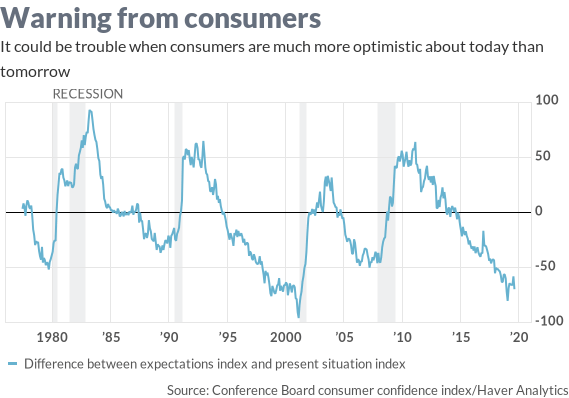
source: Marketwatch
Americans increased their spending in July as households purchased a broad range of goods and services. The Commerce Department reported that consumer spending, which accounts for more than two-thirds of U.S. economic activity, rose 0.6% last month following a 0.3% gain in June.
Economists had expected a gain of 0.5%. In the details, spending on goods surged 0.9% as Americans spent more in July on new cars and trucks, especially recreational vehicles. Spending on services increased 0.5%. The increase in consumer spending in July was largely sourced from savings as personal income edged up just 0.1%, the smallest rise since last September.
The U.S. economy grew a bit slower in the spring than originally reported due to slowing exports and weaker corporate investment. The Commerce Department reported gross domestic product (GDP), the official scorecard for the economy, expanded at a 2% annual pace from April to June. The government had initially estimated the U.S. had expanded at a 2.1% rate.
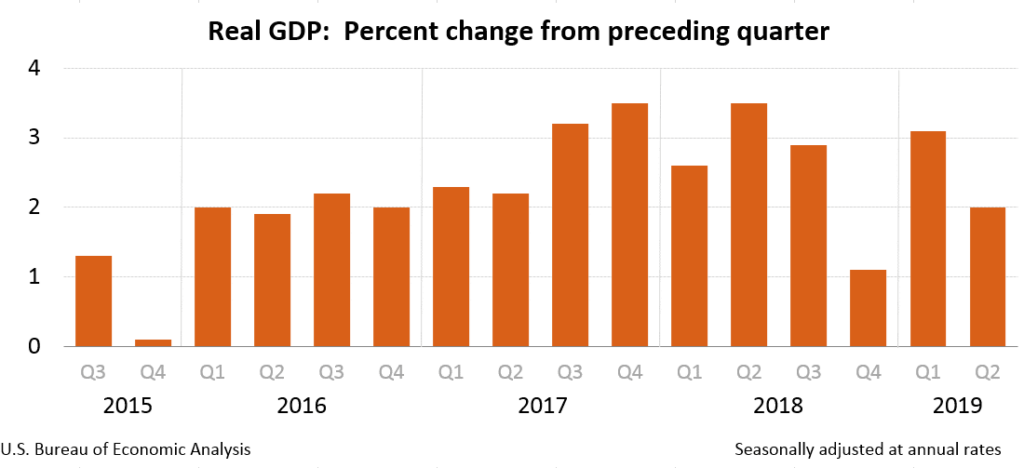
GDP had slowed from a 3.1% gain in the first three months of the year. In the details, while consumer spending was stronger than originally reported (upped from 4.4% to 4.7%), the level of inventories declined and exports fell even more sharply, down -5.8%. Most other figures in the report were little changed. The government revises GDP twice after the original release to incorporate the latest data.
Current Indicators
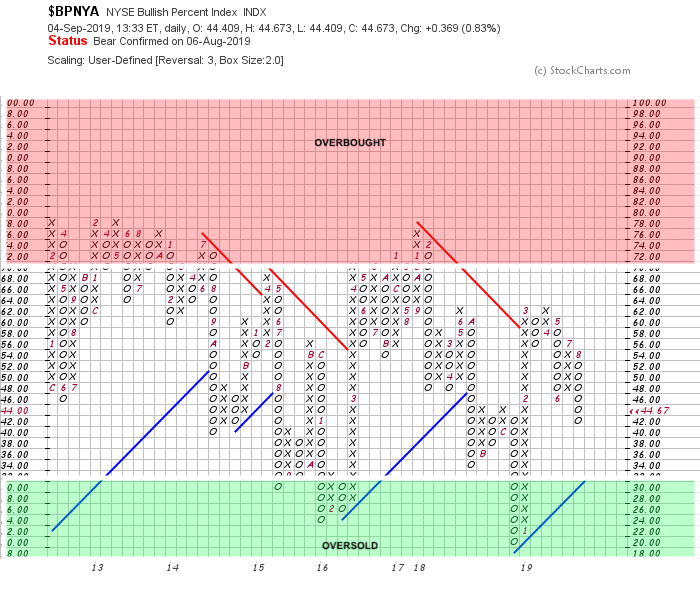
NYSE Bullish Percent Index: The NYSE Bullish % Index has fallen due to the decline in US equity markets since the last week in July. As a result, our models continue to focus on wealth preservation/hedging.
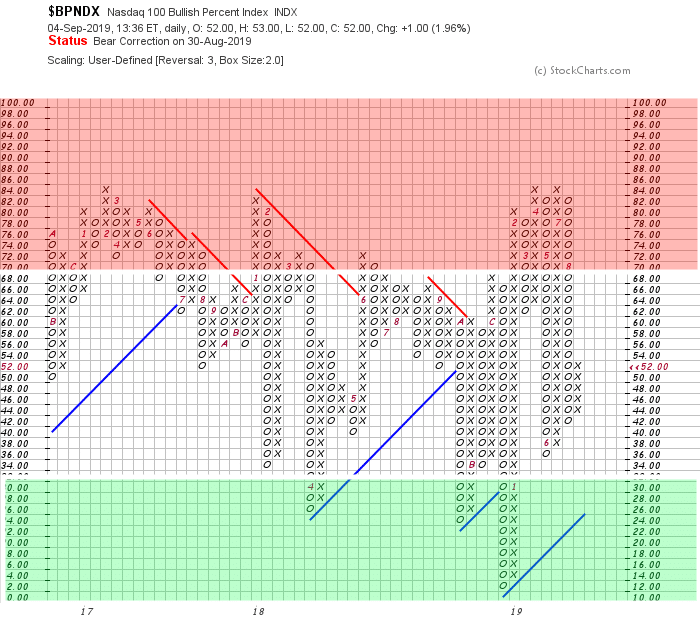
NASDAQ 100 Bullish Percent Index: The Nasdaq 100 Bullish % Index has begun to rise. This indicator usually gives us an early signal into directional changes of the market.
However, this indicator is more volatile than its counterpart and can lead to frequent portfolio “whipsaws” if solely followed.
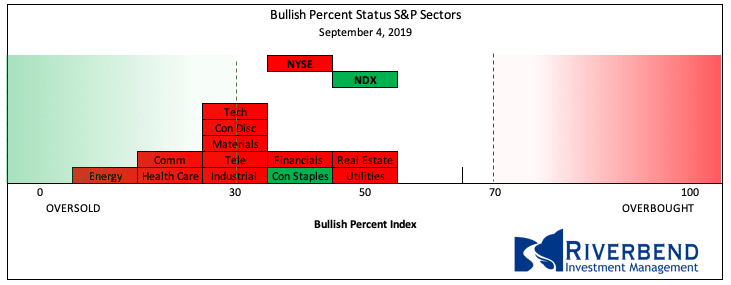
Individual sectors within the S&P 500 index are still negative and have not yet reversed. (see S&P Sector Bullish Percent Index/Bell Curve below)
Short Term Trend: Our short term trend indicator has also recently reversed. This may indicate that aggressive traders are looking to re-enter the market, hoping for a short term bounce.
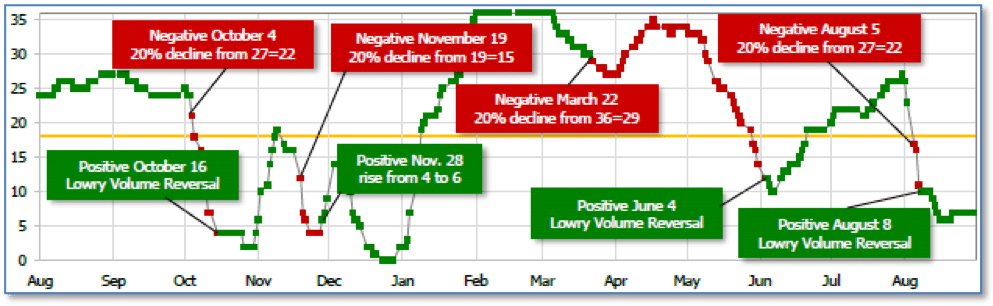
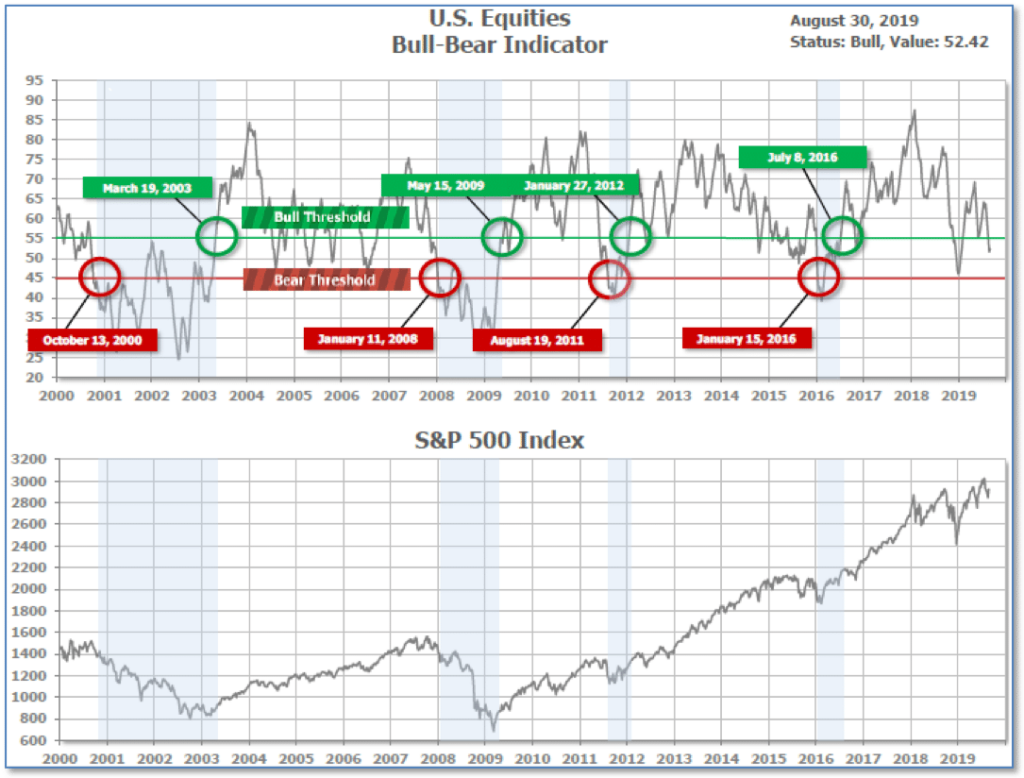
Bull/Bear Market Status: Our longer-term Bull/Bear Indicator, however, is still in “Bull Market” territory.
S&P Sector Bullish Percent Index/Bell Curve: Individual equity sectors continue to decline:
September 2019
SHUT vs DIME
The ranking relationship between the defensive SHUT sectors is one way to gauge institutional investor sentiment in the market.
“S”=Staples [a.k.a. consumer non-cyclical]
“H”=Healthcare
“U”=Utilities and
“T”=Telecom
and the offensive DIME sectors:
“D”=Discretionary [a.k.a. Consumer Cyclical]
“I”=Industrial,
“M”=Materials
“E”=Energy
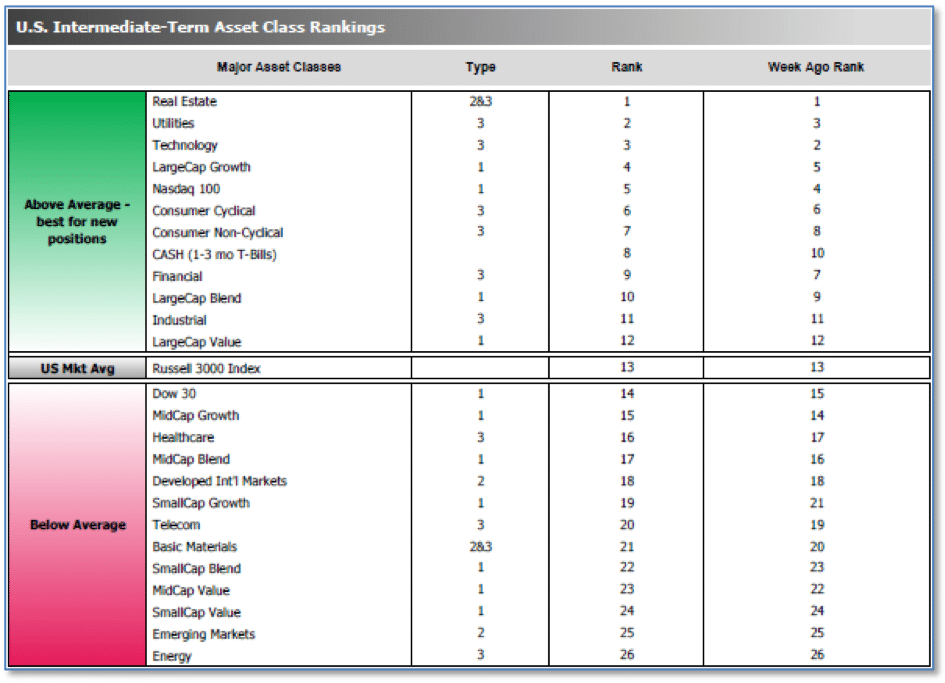
The average ranking of Defensive SHUT sectors rose to 11.25 from the prior week’s 11.75, and the average ranking of the Offensive DIME sectors fell to 16.00 from the prior weeks’ 15.75.
The Defensive SHUT sectors’ lead over Offensive DIME sectors expanded.
Note: these are “ranks”, not “scores”, so smaller numbers are higher ranks and larger numbers are lower ranks.
Chart of Interest
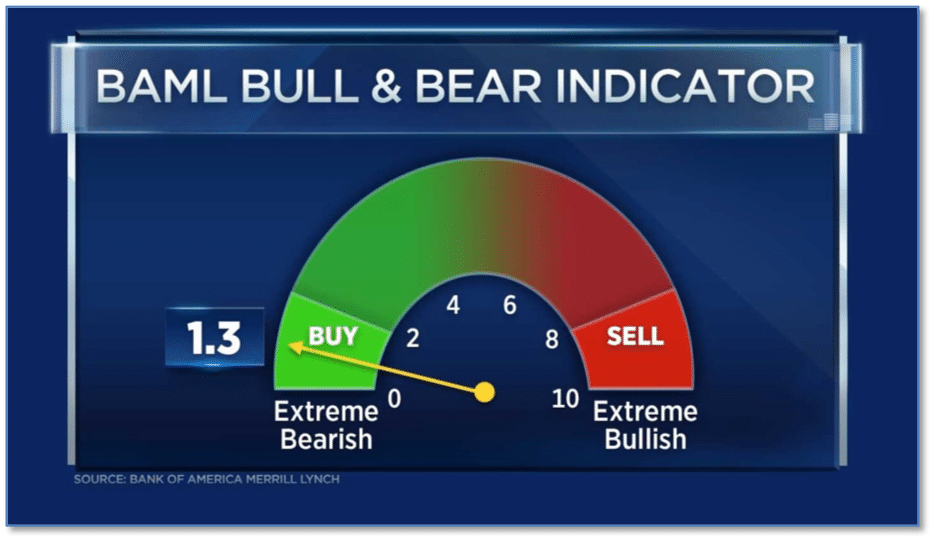
Investment “contrarians” are those who look for extremes in sentiment as signals that it is time to “go the other way”. Analysts at Bank of America Merrill Lynch (BAML) said in a research note that a contrarian “buy signal” had been triggered following the market sell-off in the month of August.
In its note, BAML said its “Bull & Bear” sentiment indicator had tumbled from 2.4 to 1.3, triggering the signal – the first one since January of this year.
A reading below 2 on its “Bull & Bear” sentiment indicator is classed as extremely bearish and causes a buy signal to flash.
The bank said this week’s drop into buy territory had been due to outflows in emerging market debt and equities, as well as a rapid rally in Treasury markets. (Chart from CNBC, using data from BAML)
(Chart from Marketwatch.com, data from The Conference Board)
What’s Happening in Your Portfolio?
(as of 9/4/19)
At the start of August, our portfolio models switched from “wealth accumulation” mode to “wealth preservation” mode.
Today, portfolios still remained hedged.
“Human” market participants seem to be sitting on the sidelines waiting for the outcome of the US/China tariff debate.
Meanwhile, algo (aka computer) trading has been whipsawing the market a bit – as the machines react to changes in the news cycle.
With that said, we may be beginning to see some bargain hunting by traders. We will closely be watching for sector reversals, and for opportunities within the strongest sectors of the market (as measured by relative strength).
If you have any questions, please reach out to me directly at john.rothe@riverbendinvestments.com
(sources: all index return data from Yahoo Finance; Reuters, Barron’s, Wall St Journal, Bloomberg.com, ft.com, guggenheimpartners.com, ritholtz.com, markit.com, financialpost.com, Eurostat, Statistics Canada, Yahoo! Finance, stocksandnews.com, marketwatch.com, wantchinatimes.com, BBC, 361capital.com, pensionpartners.com, cnbc.com, Financial Media Exchange, FactSet; Figs 1-5 source W E Sherman & Co, LLC)
© 2019 Riverbend Investment Management, LLC. This presentation is intended for informational purposes only.
The information and statistical data contained herein have been obtained from sources we believe to be reliable but in no way are warranted by us as to accuracy or completeness. The opinions expressed are those of Riverbend Investment Management, LLC. and are subject to change without notice. No part of this presentation may be reproduced in any manner without the written permission of Riverbend Investment Management, LLC. Any securities discussed should not be construed as a recommendation to buy or sell and there is no guarantee that these securities will be held for a client’s account nor should it be assumed that they were or will be profitable. Past performance does not guarantee future comparable results.
ADV II available upon request
Riverbend Investment Management, LLC
1818 Library Street, Suite 500
Reston VA 20190
Tel:703-349-6327
www.riverbendinvestments.com


