
Market Recap:
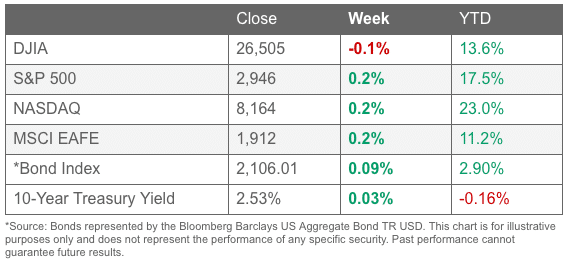
All major US indices were higher for the month of April. The Dow rose 2.6%, and the NASDAQ gained 4.7%. Large caps and mid caps each gained 3.9%, while small caps rose a lesser but still robust 3.3%.
International markets were higher with few exceptions. Canada’s TSX rose 3% and the UK’s FTSE rose 1.9%. France’s CAC gained 4.4%, while Germany’s DAX surged 7.1%.
China’s Shanghai Composite bucked the positive results by declining -0.4%, but Japan’s Nikkei surged 5%.
Developed markets rose 2.9%, while emerging markets added 2.4%.
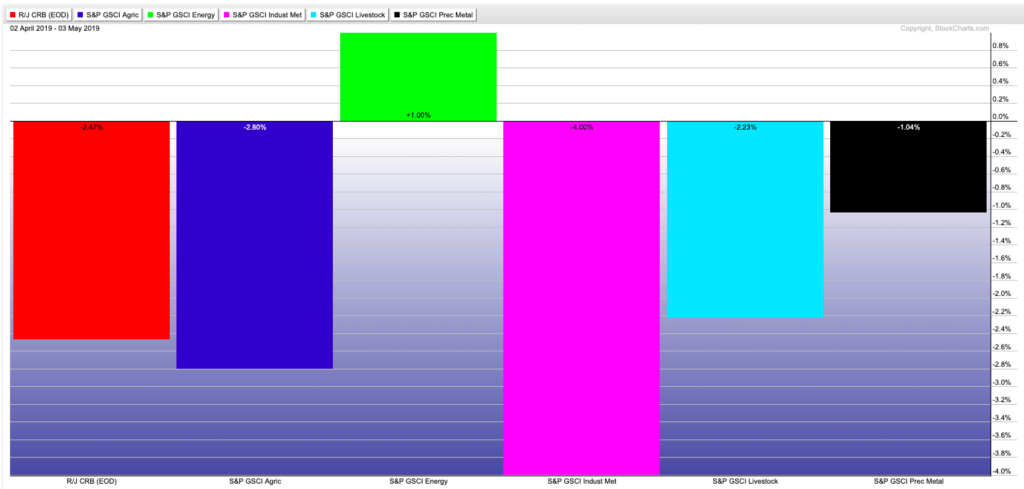
Gold retreated -1.3% in April, while Silver gave up -0.9%. Oil rose 3%, but copper performed poorly, giving up -4%.
U.S. Economic News:
The number of Americans applying for first-time unemployment benefits rose to a three-month high of 230,000. However, analysts noted that the higher reading was likely due to the recent Easter holiday and spring break.
Economists had forecast new claims would fall to 215,000. The less-volatile monthly average of new claims rose by 6,500 to 212,500 but remained near their lowest level in almost fifty years. Continuing claims, which counts the number of people already receiving benefits, edged up 17,000 to 1.67 million.
The U.S. created 263,000 jobs in April and unemployment fell to an almost 50-year low, according to the Labor Department’s Non-Farm Payrolls (NFP) report.
In the latest reading, the increase in hiring was concentrated in white collar services, construction, and health care. The only sector that suffered a large loss of employees was retail, where employment fell for a third straight month. The increase in new jobs easily surpassed economists’ forecasts of an NFP of 213,000.
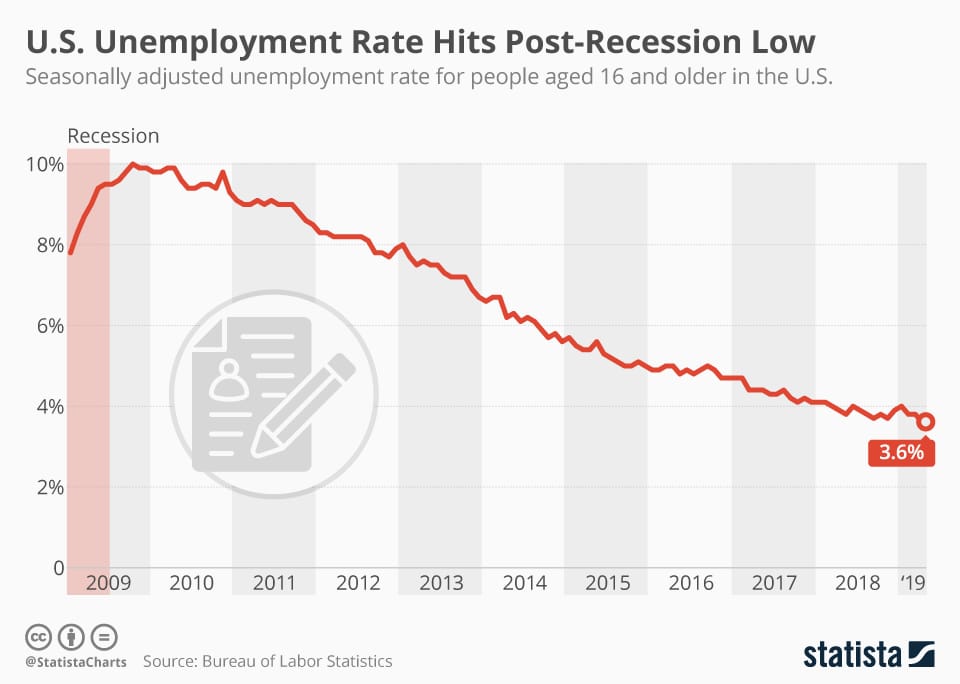
Meanwhile, the unemployment rate dipped 0.2% to 3.6% in March, marking the lowest level since December of 1969. The increase in pay over the last 12 months remained unchanged at 3.2%. That leveling off is thought to ease any worries at the Federal Reserve about rising wages triggering a sharp increase in inflation.
The private sector saw job growth surge by over 275,000 new positions in April, according to payrolls processor ADP. The ADP reading topped economists’ consensus expectations for 180,000 jobs added. However, Mark Zandi Moody’s Analytics chief economist cautioned that market participants shouldn’t be overly optimistic following the report.
“The number overstates the case,” Zandi said. ADP’s increases in April were concentrated in the service sector, it accounted for 223,000 of the jobs added. By size, small businesses added 77,000 jobs, medium-sized businesses added 145,000, and large businesses accounted for 53,000 of the job gains.
An index of pending-home sales rose 3.8% in March according to the National Association of Realtors (NAR). Economists had expected just a 0.7% increase. The NAR’s pending-home sales index tracks the number real estate deals in which a contract has been signed but not yet closed.
The number has been volatile over the past several months, but the trend has generally been down. In the details, only the Northeast region saw a decline, of 1.7%. Pending home sales were up 4.4% in the South, 2.3% in the Midwest, and a solid 8.7% in the West.
U.S. home prices rose a seasonally-adjusted 0.2% in February according to S&P CoreLogic’s Case-Shiller 20-city home price index. The reading was 3.0% higher than the same time last year, but was the slowest pace of annual growth since September of 2012. The reading missed the Econoday consensus forecast of a 3.2% yearly increase.
In the details, 14 of the 20 cities reported monthly price increases, but only one city had a bigger price increase on an annual basis than in January. Major cities in California, which have been impacted by sizable tax-law changes implemented in 2017, were hit the hardest with Los Angeles, San Francisco, and San Diego showing the slowest annual price growth in the three months ending in February. Las Vegas, Phoenix, and Tampa were the top three metro areas.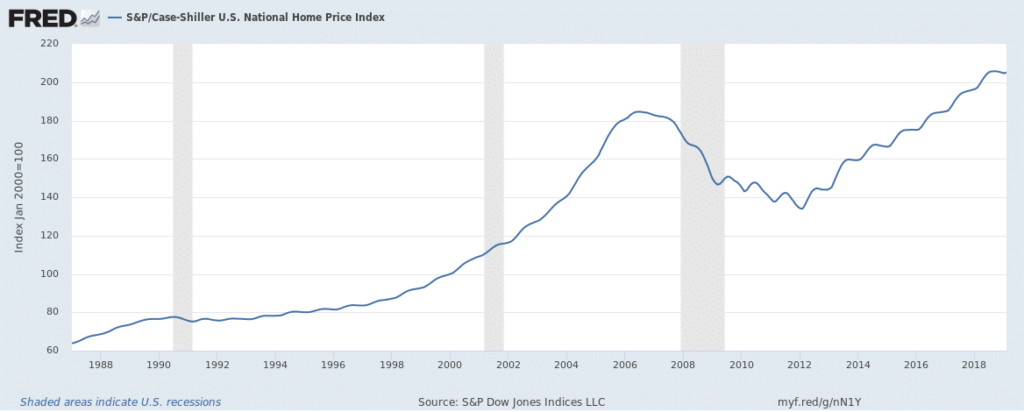
Spending by US consumers jumped in March, supporting views that the economy is on firm footing. The Government’s Bureau of Economic Analysis reported spending rose 0.9% in March following a 0.1% gain the month before. The gain was the largest monthly gain in almost a decade. In addition, personal incomes increased 0.1% in March and remained on a moderate growth path.
Economists had been expecting a 0.8% gain in consumer spending and a 0.4% gain in income. The closely watched core Personal Consumption Expenditures (PCE) inflation rate remained flat in March, bringing the annual rate down 0.1% to 1.6%. That reading was the lowest since September of 2017. The muted PCE inflation rate supported the Fed’s decision to stay on the sidelines this week. Jim O’Sullivan, chief U.S. economist at High Frequency Economics, said growth remains too strong for a rate cut, while inflation remains too weak for a rate hike.
Confidence among the nation’s consumers rebounded in April, reinforcing views that the economy continues growing steadily. The Conference Board reported its Consumer Confidence Index rose 5 points to 129.2 this week, whereas economists had expected a reading of 126.9.
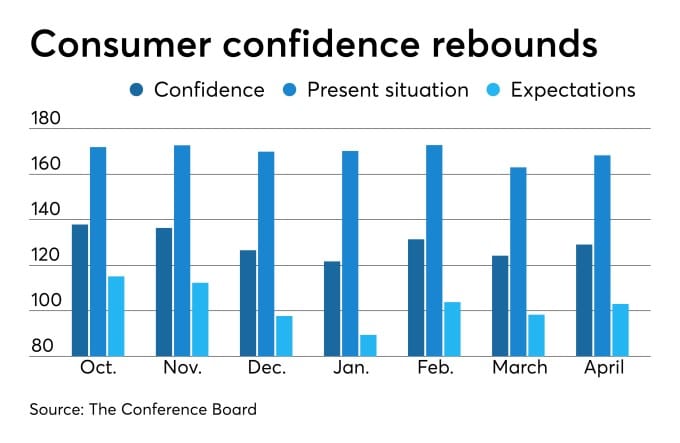
In the details, the present situation index rose 5.3 points to 168.3, and the survey of future expectations moved up to 103 from 98.3. Both are near their highest levels in a decade. Lynn Franco, Director of Economic Indicators at the board stated, “Overall, consumers expect the economy to continue growing at a solid pace into the summer months.”
Manufacturing activity expanded at its slowest pace in more than two years last month, according to the Institute for Supply Management (ISM). ISM stated its manufacturing index slipped 2.5 points to 52.8 in March. Economists had expected a reading of 54.7. Still, while ratings over 50 indicate expansion, the rate of that expansion is the weakest since October of 2016.
In the details, the new-orders index slid 5.7 points to 51.7, while the employment gauge dropped 5.1 points to 52.4. The ISM index is compiled from a survey of executives who order raw materials and other supplies for their companies.
Overseas:
Chinese factory activity expanded for a second month but at a much slower pace than expected, government data showed. China’s statistics bureau reported the official Purchasing Managers Index (PMI) for manufacturing fell to 50.1 in April, down 0.4 points from March.
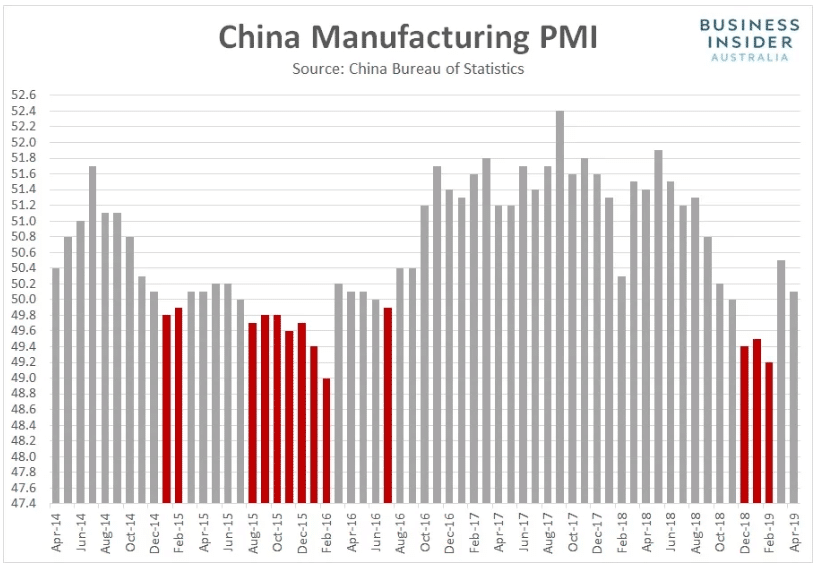
The reading just barely held above the neutral 50 level that separates expansion from contraction. Analysts had expected the PMI to match March’s 50.5. Julian Evans-Pritchard, senior China economist at Capital Economics, said in a research note, “For now, the official PMI suggests that Q2 got off to a weaker start and reinforce our view that there are still some downside risks to near-term activity.”
While the official factory survey disappointed on the growth front, it did not show a marked deterioration in business conditions. Output expanded at a slower but still moderate pace, while growth in the new orders PMI component eased only slightly.
Current Indicators
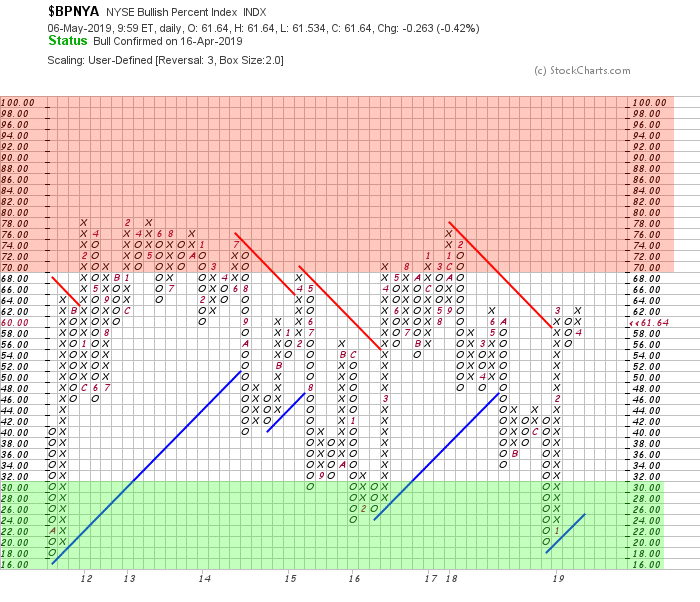
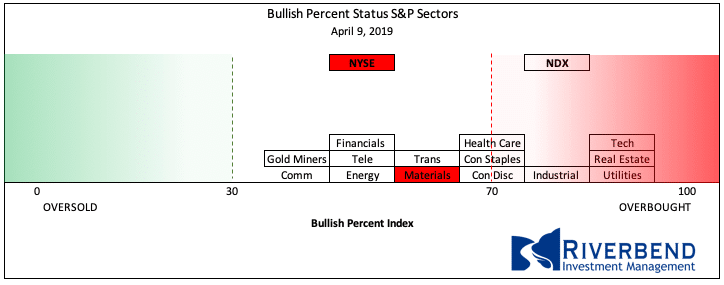
NYSE Bullish Percent Index: The NYSE Bullish % Index is still near overbought levels, while the Nasdaq 100 Index has reversed from its overbought top. The current levels of both indices plus the price action of the past month indicate traders are starting to reduce risk in their portfolios.
NASDAQ 100 Bullish Percent Index:
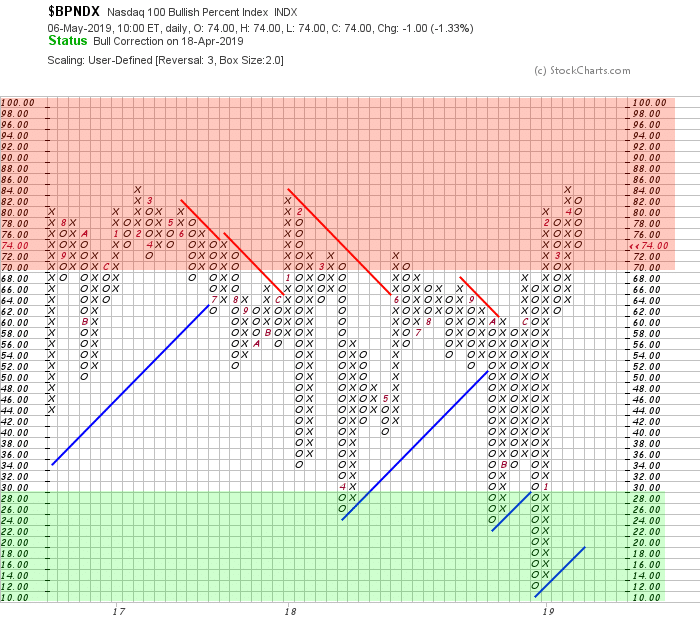
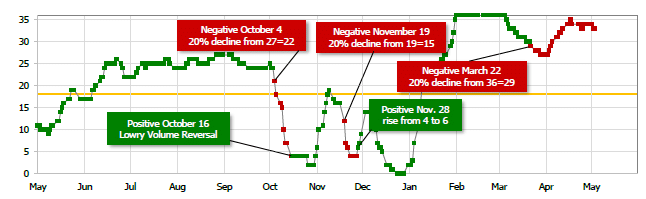
Short Term Trend: Our short term trend indicator is currently negative, confirming the Bullish Percent Indices of risk reduction in the US equity markets.
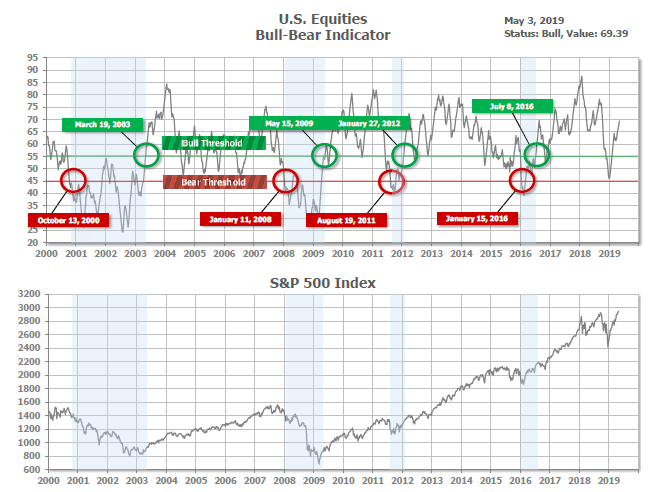
Bull/Bear Market Status: Our longer-term Bull/Bear Indicator is still in “Bull Market” territory. This may indicate that traders are waiting for a short term pull back in the markets before putting any new capital to work.
S&P Sector Bullish Percent Index/Bell Curve: Sector rotation was the theme of the past month, as shown by the Bullish Percent Indices of the major S&P 500 Sectors.
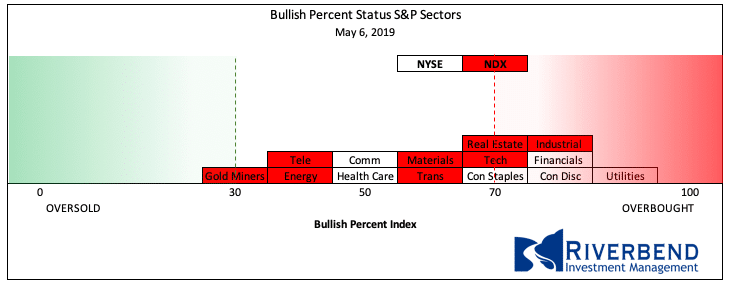
Currently, the US equity market is still a bit skewed into overbought territory — but we may start to see traders moving money into some of the more oversold sectors of the market.
Last Month:
This Month:
SHUT vs DIME
The ranking relationship between the defensive SHUT sectors is one way to gauge institutional investor sentiment in the market.
“S”=Staples [a.k.a. consumer non-cyclical]
“H”=Healthcare
“U”=Utilities and
“T”=Telecom
and the offensive DIME sectors:
“D”=Discretionary [a.k.a. Consumer Cyclical]
“I”=Industrial,
“M”=Materials
“E”=Energy
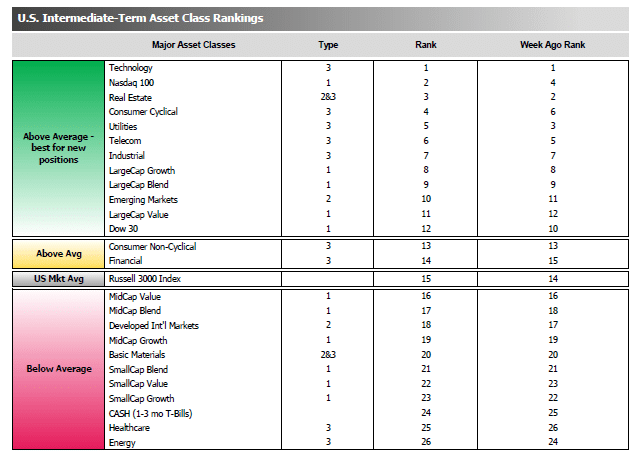
The average ranking of Defensive SHUT sectors declined to 12.25 from the prior week’s 11.75, and the average ranking of the Offensive DIME sectors was unchanged from the prior week at 14.25. The Defensive SHUT sectors’ lead over Offensive DIME sectors continued to shrink.
Note: these are “ranks”, not “scores”, so smaller numbers are higher ranks and larger numbers are lower ranks.
Chart of Interest
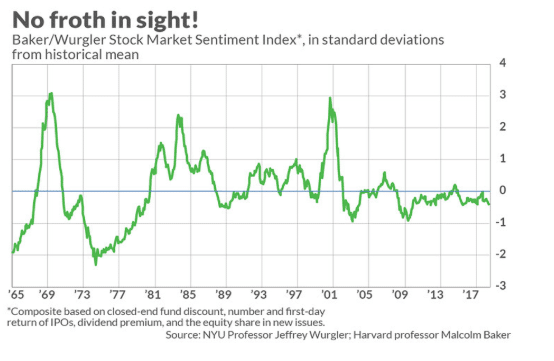
Is the bull market in stocks, now in its tenth year, reaching the frothy, speculative stage that is typical of a major top? Not according to an indicator created by top minds at the Harvard School of Business and NYU.
Harvard professor Malcolm Baker and NYU finance professor Jeffrey Wurgler created a stock market sentiment index that has an impressive historical record of identifying periods of extreme bullishness (marking many market tops) or extreme bearishness (marking many bottoms).
Note from the chart that the top of the internet bubble was the last time their index indicated extreme bullish sentiment that has occurred two standard deviations away from the mean, or only about 5% of the time. Currently, the index is not only significantly lower, it is actually below zero.
Obviously, not all tops are accompanied by extreme bullishness – the market top in 2007 was one of those instances – but when extreme bullishness does occur, historically a market top is also at hand.
What’s Happening in Your Portfolio?
(as of 5/6/19)
We are still investing portfolios very conservatively. Our current objective is to protect the year to date gains in the portfolio as the market transitions out of high risk and overbought territory.
Currently, client portfolios are heavily weighted in fixed income and cash. We will be watching the news regarding the US/China trade policy. Any significant short term pullback may provide an opportunity to start reallocating capital — especially into sectors that are extremely oversold.
If you have any questions, please reach out to me directly at john.rothe@riverbendinvestments.com
(sources: all index return data from Yahoo Finance; Reuters, Barron’s, Wall St Journal, Bloomberg.com, ft.com, guggenheimpartners.com, ritholtz.com, markit.com, financialpost.com, Eurostat, Statistics Canada, Yahoo! Finance, stocksandnews.com, marketwatch.com, wantchinatimes.com, BBC, 361capital.com, pensionpartners.com, cnbc.com, Financial Media Exchange, FactSet; Figs 1-5 source W E Sherman & Co, LLC)
© 2019 Riverbend Investment Management, LLC. This presentation is intended for informational purposes only.
The information and statistical data contained herein have been obtained from sources we believe to be reliable but in no way are warranted by us as to accuracy or completeness. The opinions expressed are those of Riverbend Investment Management, LLC. and are subject to change without notice. No part of this presentation may be reproduced in any manner without the written permission of Riverbend Investment Management, LLC. Any securities discussed should not be construed as a recommendation to buy or sell and there is no guarantee that these securities will be held for a client’s account nor should it be assumed that they were or will be profitable. Past performance does not guarantee future comparable results.
ADV II available upon request
Riverbend Investment Management, LLC
1818 Library Street, Suite 500
Reston VA 20190
Tel:703-349-6327
www.riverbendinvestments.com


