
Market Recap:
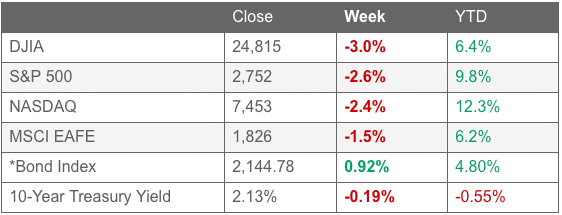
All major U.S. and International stock markets lost ground in May. The Dow Jones Industrial Average retreated -6.7%, the Nasdaq Composite retreated -7.9%, and the large cap S&P 500 gave up -6.6%. Small caps fell -7.9% and mid caps fared the worst giving up over -8.1%.
Canada’s TSX fell -3.3% while the United Kingdom’s FTSE gave up -3.5%. On Europe’s mainland, France’s CAC 40 fell -6.8%, Germany’s DAX retreated -5%, and Italy’s Milan FTSE plunged -9.5%.
In Asia, China’s Shanghai Composite fell -5.8% and Japan’s Nikkei retreated ‑7.5%.
Developed markets ended the month down -5.0%, while emerging markets fell an even deeper ‑7.3%.
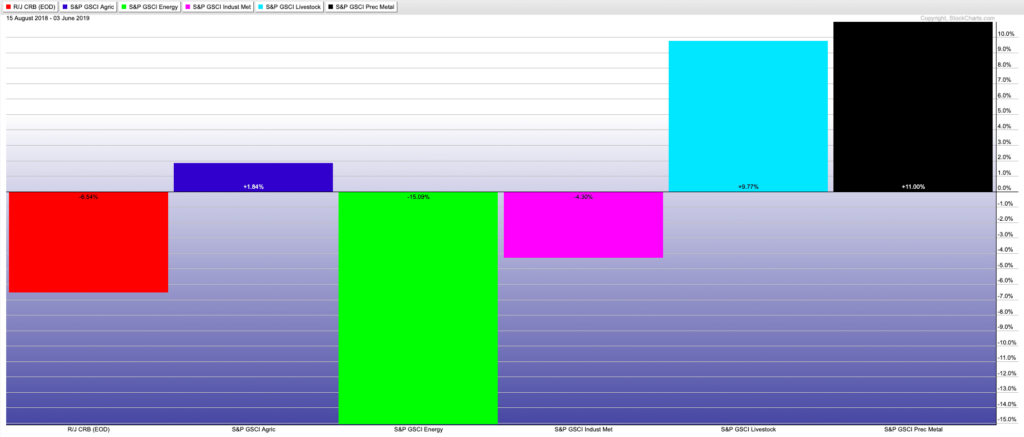
Precious metals ended the month mixed: Gold rose 2.0% while Silver declined -2.7%. West Texas intermediate crude oil plunged a whopping -16.3%, while copper gave up -9.1%.
U.S. Economic News:
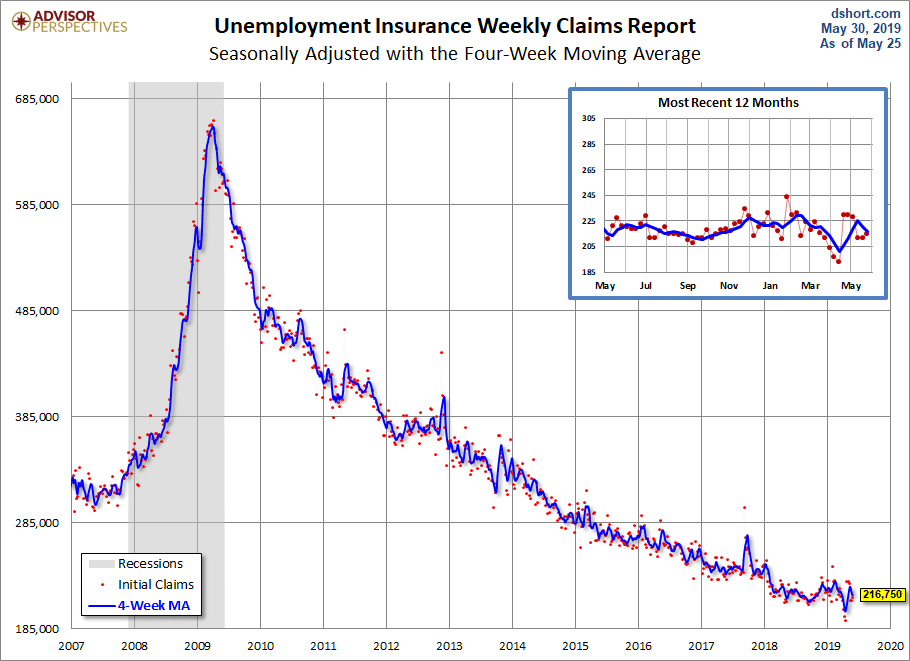
The number of Americans seeking first time unemployment benefits rose slightly to 215,000, but remained near multi-decade lows. The Labor Department reported initial jobless claims rose by 3,000 last week, matching economists’ estimates. The less-volatile monthly average of new claims fell by 3,750 to 216,750. Continuing claims, which counts the number of people already receiving unemployment benefits, declined by 26,000 to 1.66 million. That number is reported with a one-week delay.
The number of homes where a contract has been signed but has not yet closed fell a seasonally-adjusted 1.5% in April and were 2% lower than the same time last year, according to the National Association of Realtors (NAR). Contract signings precede closings by about 45-60 days, so the pending home-sales index is a leading indicator for upcoming existing-home sales reports. By region, only the Midwest saw an increase, with a 1.3% rise. Pending sales were down 1.8% in the Northeast, 2.5% in the South, and 1.8% in the West. Despite the declines, the NAR remained resoundingly upbeat. NAR Chief Economist Lawrence Yun stated, “It’s inevitable for sales to turn higher in a few months.”
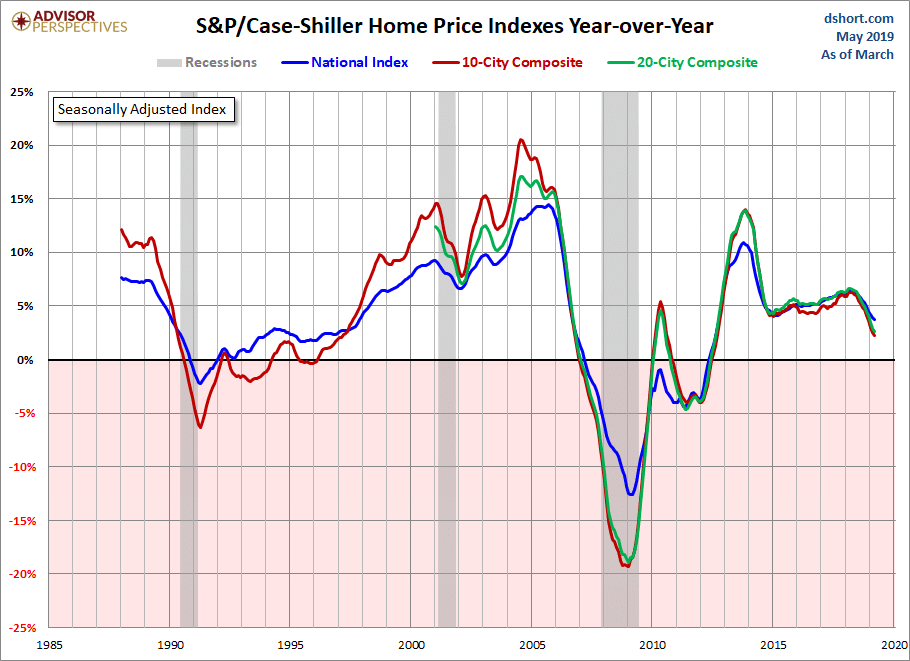
The rate of increase in home prices weakened again according to the latest data from S&P CoreLogic. The S&P CoreLogic Case-Shiller home price index rose an annualized 3.7% in March, down from 3.9% in February. As recently as last fall many regions had reported double-digit price increases. The latest report’s largest annual gain was 8.2% in Las Vegas, but Seattle’s previous 13% gain has dropped to just 1.6%. The 20-City Composite index dropped from 6.7% annual gains, to just 2.7% over the past year. David Blitzer, managing director and chairman of the Index Committee at S&P Dow Jones Indices stated, “Given the broader economic picture, housing should be doing better.”
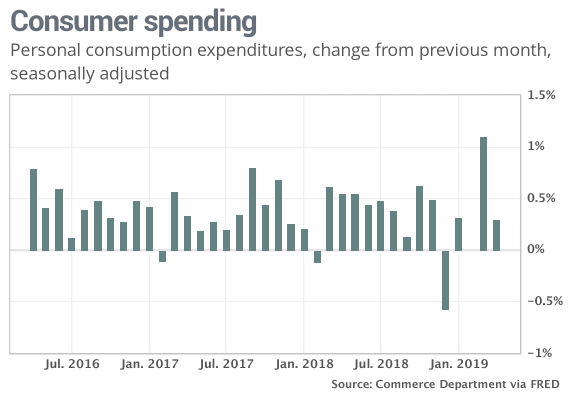
Confidence among the nation’s consumers surged in May to a six-month high, spurred by a robust labor market. The Consumer Confidence Index rose 4.9 points to 134.1 the Conference Board reported. Of note, the survey results were compiled before trade talks between the U.S. and China deteriorated. In the details, the survey that asked Americans how they view the economy at present rose to 175.2—its highest level since December 2000. In addition, the index that tracks how consumers view the economy 6 months from now rose 3.9 points to 106.6. Lynn Franco, director of economic indicators at the Board stated, “Despite weak retail sales in April, these high levels of confidence suggest no significant pullback in consumer spending in the months ahead.”
Americans cut back on spending in April after a surge in March, according to the Commerce Department. Consumer spending rose 0.3% last month, a steep drop from March’s 1.1% increase. Incomes rose 0.5% in April, the largest gain in four months while the Personal Consumption Expenditures index rose 0.3%. The rate of inflation over the past year rose to 1.5%–its highest level since December. Sal Guatieri senior economist at BMO Capital Markets stated, “Despite an escalating trade war, the American consumer is still kicking, and likely to keep the economy moving forward so long as hiring doesn’t give out.”
Consumer sentiment took a hit in the last half of May after the trade dispute between the U.S. and China escalated into another round of retaliatory tariffs. The University of Michigan’s final results for consumer sentiment was lowered 2.4 points to 100 in May, down from its highest reading in 15 years. In the details, over 30% of respondents “spontaneously” mentioned the new tariffs versus just 16% earlier in the month.
First-quarter GDP grew a bit slower than originally reported, predominantly due to weaker business investment, said the government’s Bureau of Economic Analysis. Gross domestic product, the official scorecard for the economy grew at a 3.1% annual pace in the first quarter—down a tick from the initial 3.2% estimate. Economists had expected first-quarter GDP to be revised down to 3%. Of note in the report, adjusted corporate profits before taxes fell at an annual -2.8% pace—the biggest decline since 2015. Chief Economist Scott Brown of Raymond James summed up the report writing, “The first quarter story remains the same — headline GDP growth was boosted by inventories and net exports, while consumer spending and business fixed investment rose at a lackluster pace.”
Current Indicators
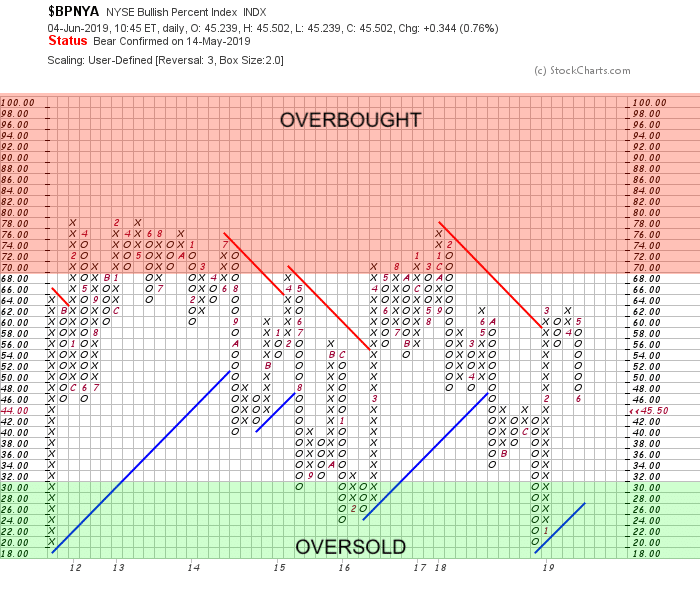
NYSE Bullish Percent Index: The NYSE Bullish % Index has declined over the past month. Traders have been reducing equity exposure as the US equity was overbought in numerous sectors. While the NYSE Bullish % Index is not in overbought territory, numerous sectors are. We may start to see selective buying at these levels.
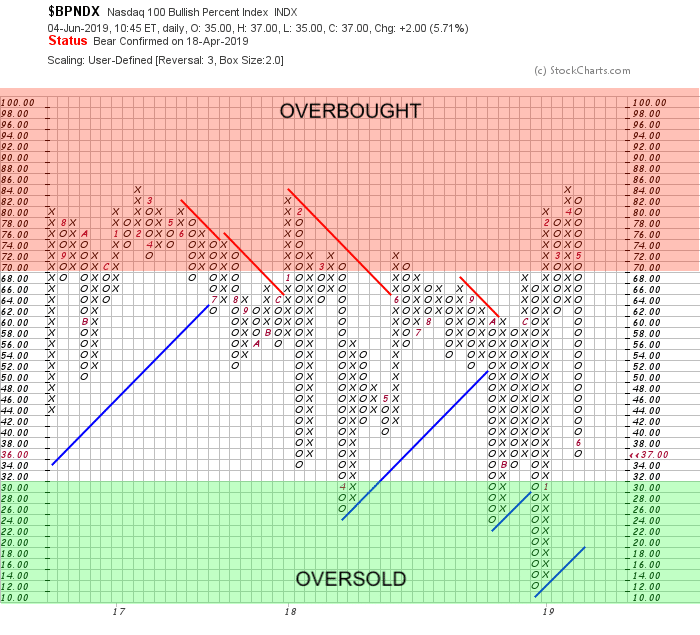
NASDAQ 100 Bullish Percent Index: The tech-heavy Nasdaq 100 Bullish % Index has gone from extremely overbought territory into almost oversold conditions:
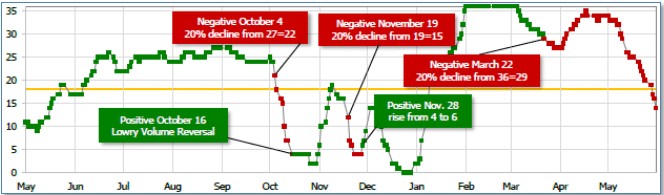
Short Term Trend: Our short term trend indicator is still negative, confirming the ongoing risk reduction by traders in the US equity markets.
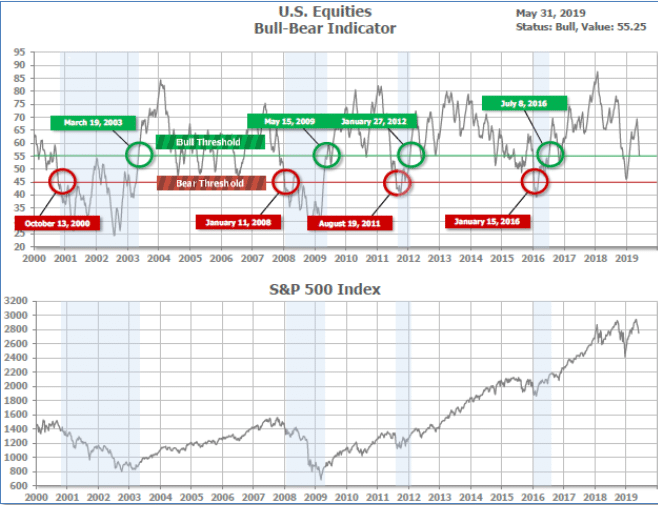
Bull/Bear Market Status: Our longer-term Bull/Bear Indicator is still in “Bull Market” territory. While the equity market has fallen over the past month, we are nowhere near “Bear Status”, indicating that the current market trend is short term in nature and not likely a larger, long term decline.
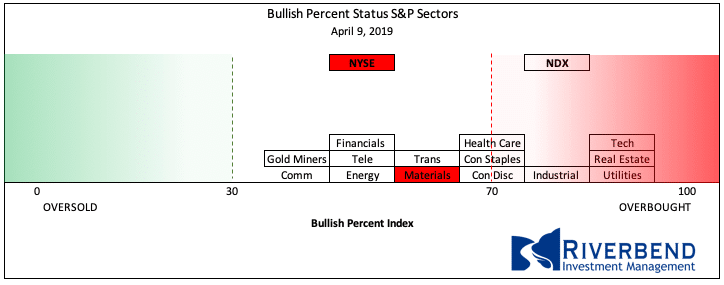
S&P Sector Bullish Percent Index/Bell Curve: Individual equity sectors continue to shift from an overbought status towards oversold status. At current levels, we may start to see traders reenter into some of the more oversold sectors.
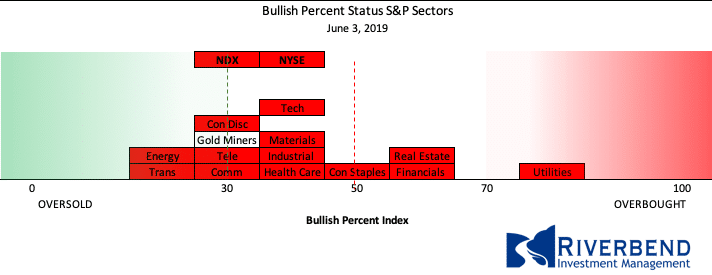
Comparing the current status with that of April’s, we can see the transition of the US equity market from overbought into oversold areas:
SHUT vs DIME
The ranking relationship between the defensive SHUT sectors is one way to gauge institutional investor sentiment in the market.
“S”=Staples [a.k.a. consumer non-cyclical]
“H”=Healthcare
“U”=Utilities and
“T”=Telecom
and the offensive DIME sectors:
“D”=Discretionary [a.k.a. Consumer Cyclical]
“I”=Industrial,
“M”=Materials
“E”=Energy
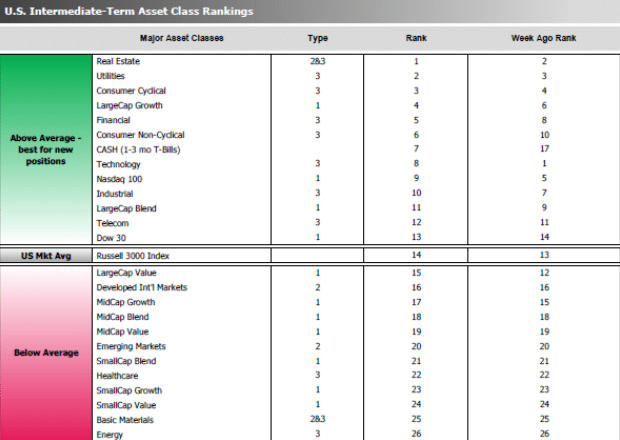
The average ranking of Defensive SHUT sectors rose to 10.50 from the prior week’s 11.50, and the average ranking of the Offensive DIME sectors declined to 16.00 from the prior week’s 15.50.
The Defensive SHUT sectors’ lead over Offensive DIME sectors has widened.
Note: these are “ranks”, not “scores”, so smaller numbers are higher ranks and larger numbers are lower ranks.
Chart of Interest
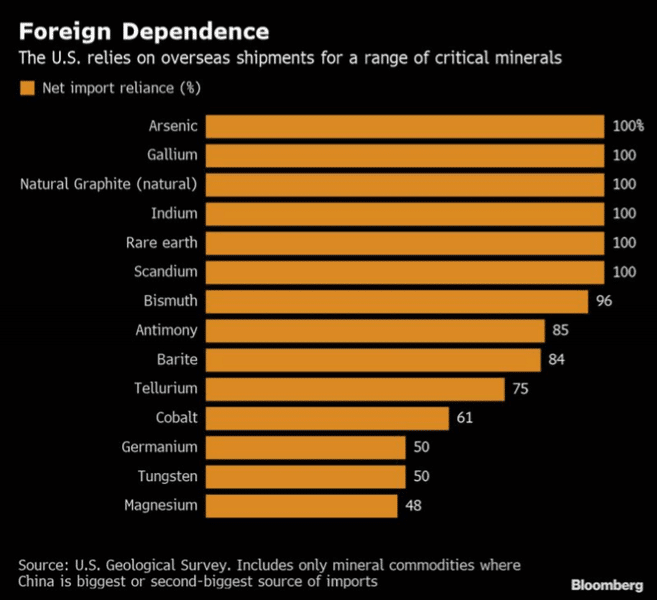
Pick up just about any consumer electronics product at one of the big box retailers and you’ll quickly realize why the growing trade tensions between the U.S. and China are so significant—it seems just about every product is stamped with “MADE IN CHINA”.
However, below the surface there is possibly a much more dangerous trade conflict brewing. According to media reports from China, Beijing appears to be gearing up its use of dominance in what are known as “rare earth metals” as a counter to its trade battle with Washington.
The U.S. relies on China for about 80% of its rare earths, which are used in a host of applications from smartphones to electric vehicles to sophisticated military gear. Not just “used in”, but “essential to” – these rare earth metals have become an irreplaceable part of modern electronics.
So what’s the problem? Many of the rare earth metals are only available from China, so when the Chinese government threatens to shut off rare earth metal exports, they are threatening the very existence of many of our most prized electronics.
The following chart illustrates this dangerous dependence (source: Bloomberg):
What’s Happening in Your Portfolio?
(as of 6/3/19)
We are still investing portfolios very conservatively. Our current objective is to protect the year to date gains in the portfolio as the market continues its transition out of high risk and overbought territory.
Currently, client portfolios are hedged and/or heavily weighted in fixed income and cash.
Various equity sectors are starting to show oversold signals. We will be closely watching for opportunities to take advantage of this.
If you have any questions, please reach out to me directly at john.rothe@riverbendinvestments.com
(sources: all index return data from Yahoo Finance; Reuters, Barron’s, Wall St Journal, Bloomberg.com, ft.com, guggenheimpartners.com, ritholtz.com, markit.com, financialpost.com, Eurostat, Statistics Canada, Yahoo! Finance, stocksandnews.com, marketwatch.com, wantchinatimes.com, BBC, 361capital.com, pensionpartners.com, cnbc.com, Financial Media Exchange, FactSet; Figs 1-5 source W E Sherman & Co, LLC)
© 2019 Riverbend Investment Management, LLC. This presentation is intended for informational purposes only.
The information and statistical data contained herein have been obtained from sources we believe to be reliable but in no way are warranted by us as to accuracy or completeness. The opinions expressed are those of Riverbend Investment Management, LLC. and are subject to change without notice. No part of this presentation may be reproduced in any manner without the written permission of Riverbend Investment Management, LLC. Any securities discussed should not be construed as a recommendation to buy or sell and there is no guarantee that these securities will be held for a client’s account nor should it be assumed that they were or will be profitable. Past performance does not guarantee future comparable results.
ADV II available upon request
Riverbend Investment Management, LLC
1818 Library Street, Suite 500
Reston VA 20190
Tel:703-349-6327
www.riverbendinvestments.com
