 Market Recap:
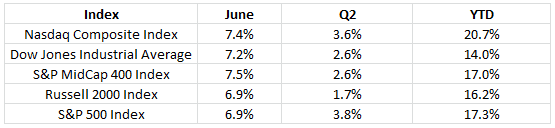
June and Q2 Summary, US Markets: It was a great June and a good Q2 for US markets. May’s declines were recovered in June, and then some.
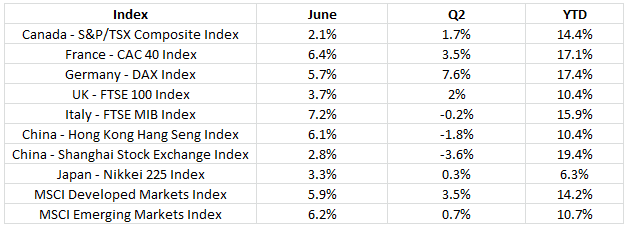
June and Q2 Summary, International Markets: As in the U.S., a strong June salvaged the quarter for most international indexes, with only Italy and the two Chinese indexes logging a negative quarter. Double-digit year to date returns are the rule for all but Japan’s Nikkei.
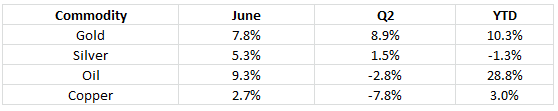
June and Q2 Summary, Commodities: Major commodities were up in June, but had a mixed Q2. After a very strong Q1, oil slumped in Q2, but still leads the way among commodities, up 28.8% for the year to date. Copper was down the most in Q2 as continued economic growth came into question. Gold and silver usually move in parallel directions, but have gone their own ways so far this year, with gold nicely up and silver down for the year to date.
U.S. Economic News:
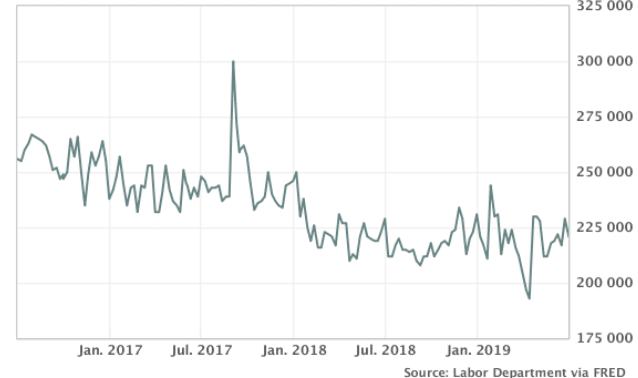
The number of people applying for first-time unemployment benefits fell by 8,000 to 221,000 last week, remaining near their lowest levels in 50 years. The reading bested economists’ forecasts of claims dropping to 223,000. The more stable monthly average rose by 500 to 222,250. Jobless claims remain well-below the 300,000-threshold analysts use to indicate a “healthy” jobs market.
Analysts note hiring has slowed during the first half of 2019, but there’s been no indication that companies are cutting jobs. Continuing claims, which counts the number of Americans already receiving benefits, also fell 8,000 to 1.69 million. That number is reported with a one-week delay.
The Labor Department’s monthly Non-Farm Payrolls (NFP) report showed the U.S. added 224,000 jobs in June as worries about the economy dissipated and hiring rebounded. The increase in new jobs easily beat the consensus forecast for 170,000 new jobs. The improved hiring last month dispels (at least for now) the threat of a dramatic slowdown in economic growth.
Escalating trade disputes and a slowing global economy have weighed on exports an undermined the confidence of consumers and businesses. Supporting the prospect of continued economic growth, the U.S. and China agreed last week to delay pending tariffs and return to negotiations.
Paradoxically, the NFP also showed the unemployment rate ticking up to 3.7% from 3.6%, but it was because more than 300,000 people came off the sidelines and entered the labor force in search of work. Still, the unemployment rate remains near a 50-year low.
Manufacturing activity in the United States grew at its slowest pace in more than two years as global trade tensions continued to rise. The Institute for Supply Management (ISM) reported its manufacturing index fell 0.4 point to 51.7 last month. The index hit a 14-year high of 60.8 last August but has steadily declined since. Despite the decline, the reading still managed to exceed economists’ forecasts of 51.3. In the details, customer orders were flat – its weakest reading since late 2015 – while inventories contracted.
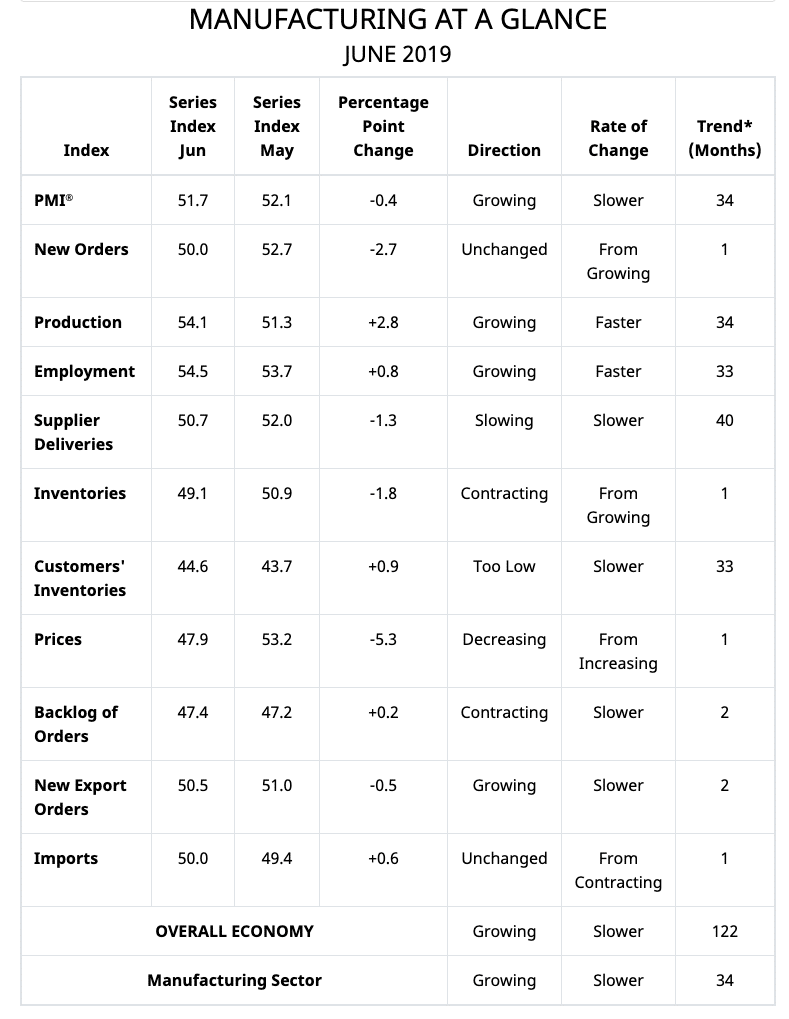
source: ISM
Exports managed a slight gain. The index is compiled from a survey of executives who order raw materials and other supplies for their companies. Some analysts noted that the survey was conducted during a tense period with China and Mexico. Thomas Simons, senior money market economist at Jefferies LLC stated, “Relations with both China and Mexico have improved since this survey data was collected, so next month should be better”.
ISM also reported that the much larger services side of the economy grew last month at its slowest pace in almost two years. ISM’s index of service-oriented companies such as banks, restaurants and hospitals slipped 1.8 points to 55.1 last month, matching its lowest reading since summer of 2017. While numbers over 50 are still viewed as positive for the economy, the index has trended lower since hitting a high of 60 less than a year ago.
In the details, the sub-index for business production dropped 3 points to 58.2, while new orders declined 2.8 points to 55.8 and employment fell 3.1 points to 55. Altogether it was still good news, as 16 of the 17 industries tracked by ISM said their businesses were expanding. The only one to contract was the arts and entertainment industry.
The Commerce Department reported that the U.S. trade deficit surged 8.4% in May, hitting its highest level of the year. The trade deficit rose $4.3 billion to $55.5 billion. Economists had forecast a deficit of $54.4 billion. In the details, U.S. exports rose 2% to $210.6 billion as the U.S. shipped more soybeans, planes, autos and networking equipment. However, imports increased a larger 3.3% to $266.2 billion as the U.S. imported more foreign autos, oil, semiconductors, computers and cell phones.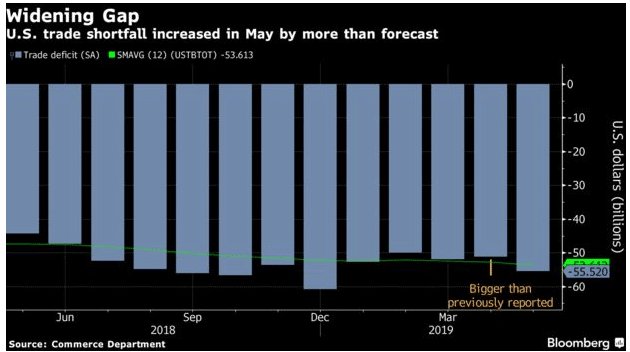
The trade gap with China rose slightly in May to $31.1 billion, but that number is running behind last year’s pace due to U.S. tariffs. Overall, the U.S. is still on track to record a larger annual trade deficit in 2019 than last year because trade gaps have expanded with other key partners like Mexico, Europe and Canada.
Current Indicators
NYSE Bullish Percent Index: The NYSE Bullish % Index has risen over the past month. Traders have been increasing equity exposure in the US during the month of June.
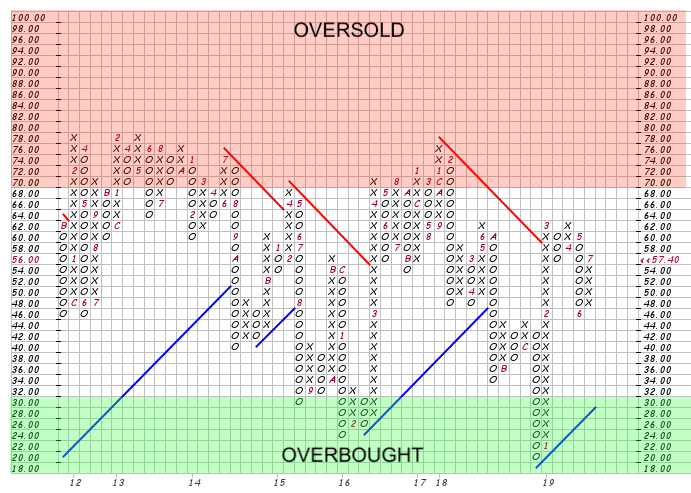
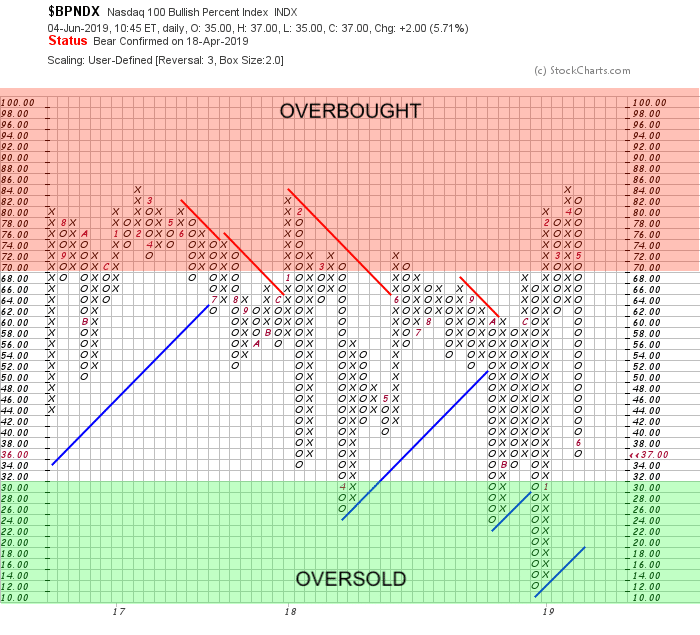
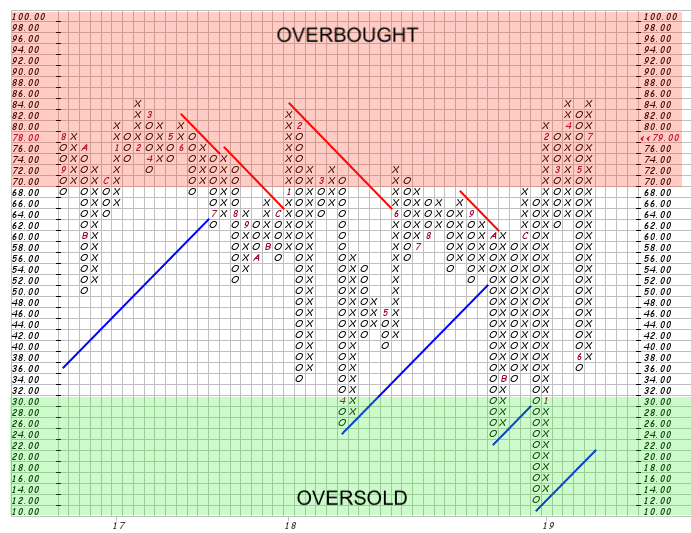
NASDAQ 100 Bullish Percent Index: The tech-heavy Nasdaq 100 Bullish % Index was becoming oversold relative to the rest of the market. This provided an opportunity to re-enter various equity sectors:
June 2019
The NASDAQ 100 now is in overbought territory. However, the market can remain overbought for some time, as traders rotate through overbought/oversold sectors. Active investors will want to focus on risk management at these levels.
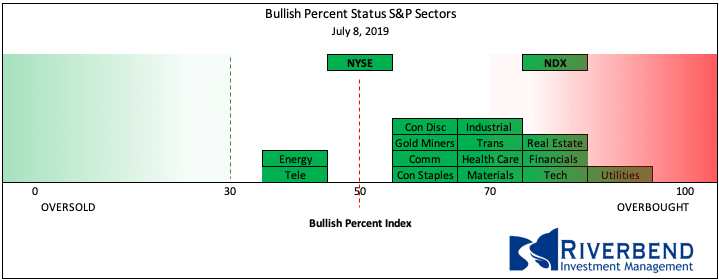
July 2019
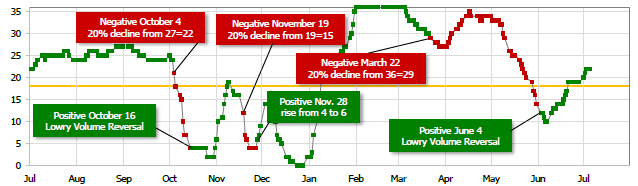
Short Term Trend: Our short term trend indicator turned positive in June and still remains in “bullish” mode:
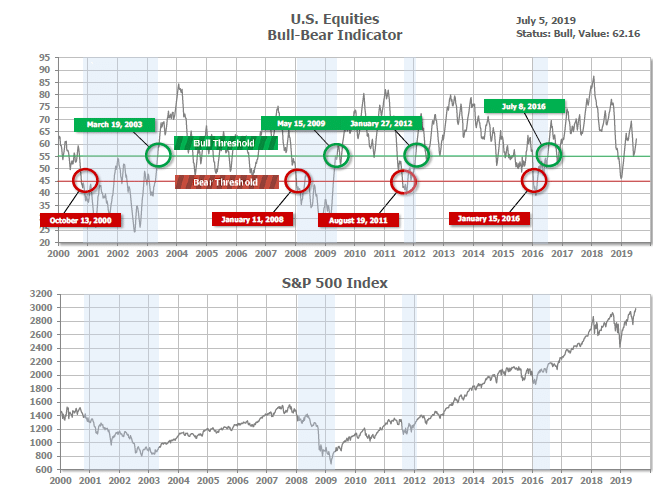
Bull/Bear Market Status: Our longer-term Bull/Bear Indicator is still in “Bull Market” territory:
S&P Sector Bullish Percent Index/Bell Curve: Individual equity sectors continue to rise from an oversold status in June:
June 2019
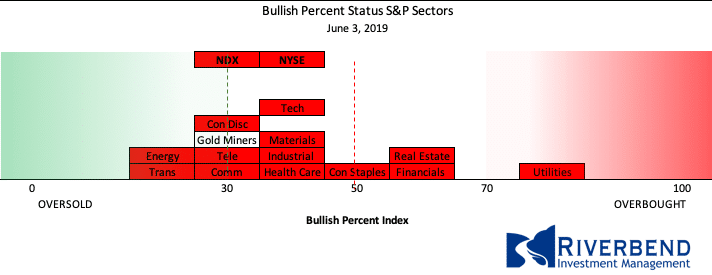
July 2019
SHUT vs DIME
The ranking relationship between the defensive SHUT sectors is one way to gauge institutional investor sentiment in the market.
“S”=Staples [a.k.a. consumer non-cyclical]
“H”=Healthcare
“U”=Utilities and
“T”=Telecom
and the offensive DIME sectors:
“D”=Discretionary [a.k.a. Consumer Cyclical]
“I”=Industrial,
“M”=Materials
“E”=Energy
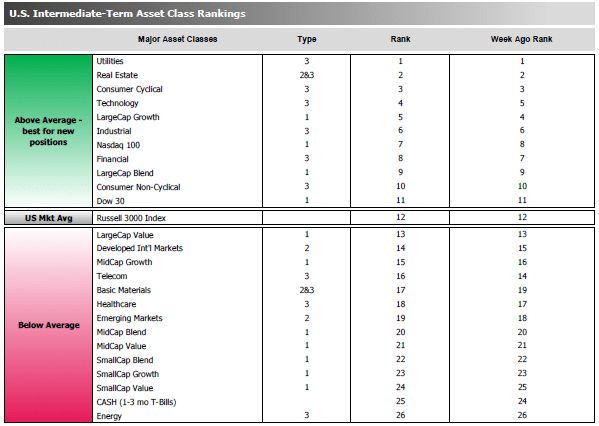
The average ranking of Defensive SHUT sectors dropped to 11.25 from the prior week’s 10.50, and the average ranking of the Offensive DIME sectors rose to 13.00 from the prior week’s 13.50.
The Defensive SHUT sectors’ lead over Offensive DIME sectors continues to contract.
Note: these are “ranks”, not “scores”, so smaller numbers are higher ranks and larger numbers are lower ranks.
Chart of Interest
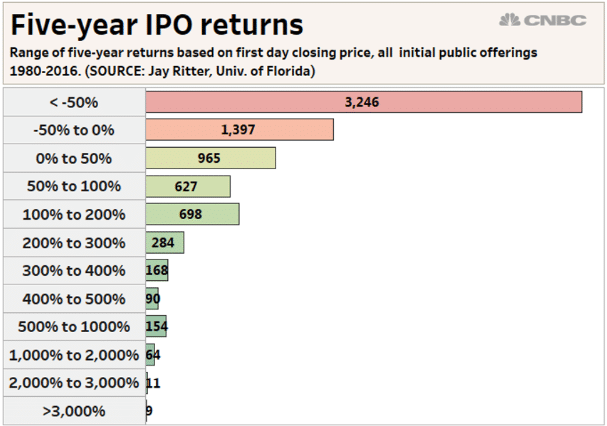
The dream of instant riches has enticed millions of investors to take a flyer on Initial Public Offerings (IPOs).
Everyone knows that early investors in Apple, Google, Microsoft and others have been richly rewarded. But, unfortunately, for every one of those huge winners, there are hundreds of huge losers.
Professor Jay Ritter at the University of Florida calculated the returns from thousands of IPOs over their first 5 years of existence as public corporations. He found that, 5 years after their IPO date, more than 60% were selling BELOW their first-day closing price, and more than 40% were selling at less than half their first-day closing price.
And the huge winners of stock market lore?
About 1.1% of the IPOs he studied were selling at levels 10 or more times above their first-day closing price.
What’s Happening in Your Portfolio?
(as of 7/8/19)
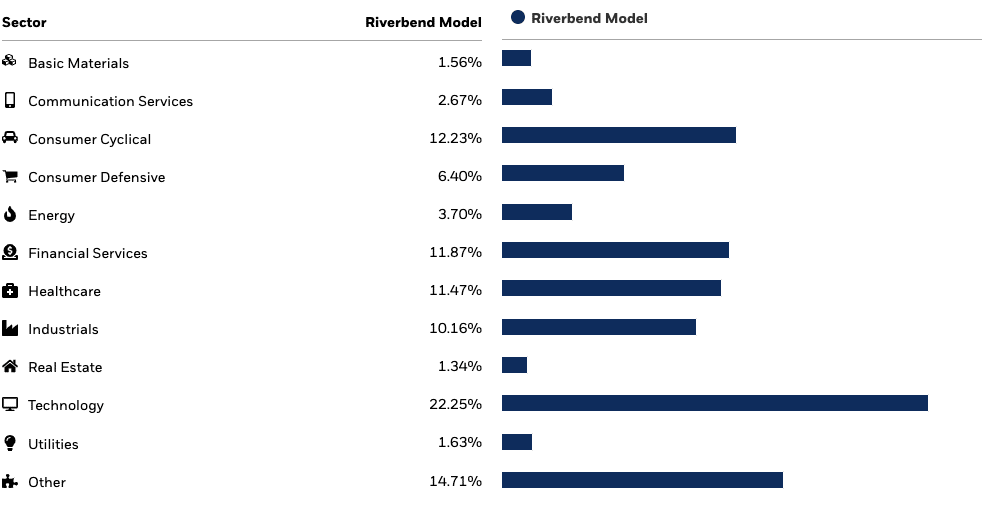
Client portfolios shifted from “conservative” to “growth” allocations at the beginning of June as our various indicators began to flash buy signals.
Currently, portfolios are overweight US equities and we will be closely watching for further opportunities as sectors rotate from overbought vs oversold status.
If you have any questions, please reach out to me directly at john.rothe@riverbendinvestments.com
as of 7/7/19. Source: Morningstar
(sources: all index return data from Yahoo Finance; Reuters, Barron’s, Wall St Journal, Bloomberg.com, ft.com, guggenheimpartners.com, ritholtz.com, markit.com, financialpost.com, Eurostat, Statistics Canada, Yahoo! Finance, stocksandnews.com, marketwatch.com, wantchinatimes.com, BBC, 361capital.com, pensionpartners.com, cnbc.com, Financial Media Exchange, FactSet; Figs 1-5 source W E Sherman & Co, LLC)
© 2019 Riverbend Investment Management, LLC. This presentation is intended for informational purposes only.
The information and statistical data contained herein have been obtained from sources we believe to be reliable but in no way are warranted by us as to accuracy or completeness. The opinions expressed are those of Riverbend Investment Management, LLC. and are subject to change without notice. No part of this presentation may be reproduced in any manner without the written permission of Riverbend Investment Management, LLC. Any securities discussed should not be construed as a recommendation to buy or sell and there is no guarantee that these securities will be held for a client’s account nor should it be assumed that they were or will be profitable. Past performance does not guarantee future comparable results.
ADV II available upon request
Riverbend Investment Management, LLC
1818 Library Street, Suite 500
Reston VA 20190
Tel:703-349-6327
www.riverbendinvestments.com


