
Market Recap:
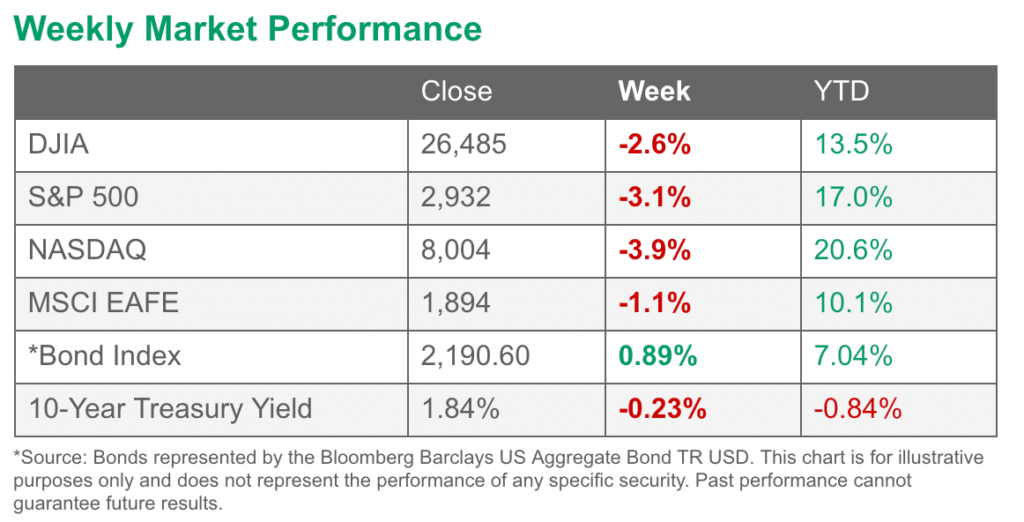
July was a modestly positive month for U.S. markets. The Dow rose 1.0% and the NASDAQ added 2.1%. The S&P 500 gained 1.3%, the mid cap S&P 400 rose 1.1%, and the small cap Russell 2000 rose the least, adding 0.5%.
International markets were not so unanimously positive, however. Canada’s TSX added 0.2% and the UK’s FTSE rose 2.2%, but France’s CAC 40 gave up -0.4% and Germany’s DAX lost -1.7%. China’s Shanghai Composite retreated -1.6%, while Japan’s Nikkei rose 1.2%.
Developed markets as a group gave up -2% while emerging markets as a group fell a steeper ‑2.7%.
Gold rose 1.7% in July, Silver surged 8%, while oil added just 0.2%. Copper ended the month down -1.7%.
U.S. Economic News:
The number of Americans claiming first-time unemployment benefits rose last week, but remained near historically low levels. The Labor Department reported initial jobless claims rose by 8,000 to 215,000. Economists had expected new claims would total 210,000.
The number remains far below the key 300,000 threshold analysts use to gauge a “healthy” jobs market and near 50-year lows. The more stable monthly average of new claims fell by 1,750 to 211,500. Continuing claims, which counts the number of Americans already receiving benefits, rose by 22,000 to 1.69 million. That number is also near a 40-year low.
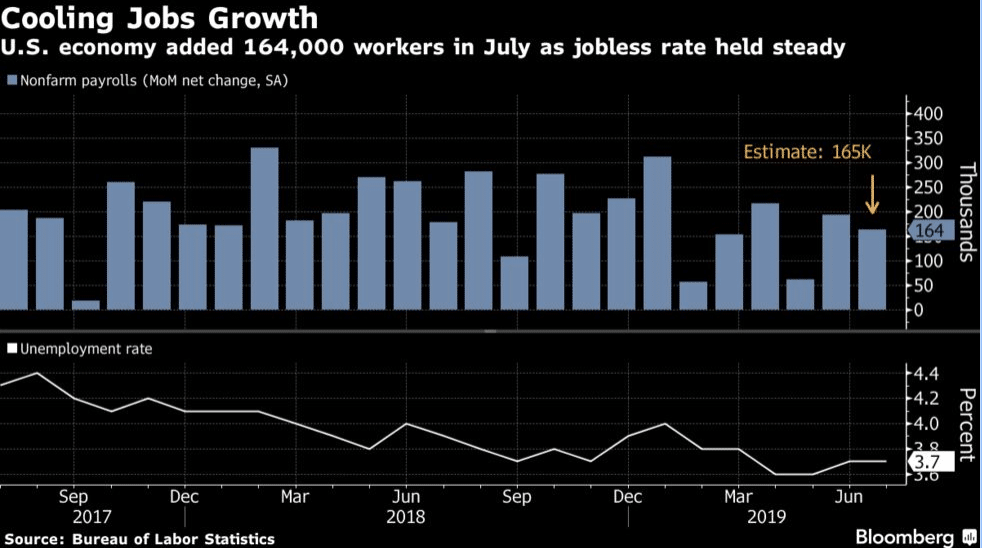
The Bureau of Labor Statistics reported the U.S. added 164,000 new jobs in July holding unemployment near its 50-year low of 3.7%. The strong jobs report underscored the strength of the U.S. labor market that shows little sign of deterioration despite an economy facing growing headwinds. The increase in new jobs was in line with economists’ forecasts.
Analysts note, however, that the lowest unemployment rate since the late 1960’s is not generating the kind of wage increases workers used to receive when the labor market was this tight. In the past wages typically rose as much as 4% a year when unemployment was extremely low—currently wages are up just 3.2%.
In the report, professional and business services led the way in hiring adding 31,000 jobs, while healthcare companies added 30,000, and social assistance providers increased by 20,000. Employment fell for sixth month in a row among retailers and media and information services also shed jobs.
Pending home sales (the number of homes in which a sales contract has been signed, but not yet closed) rose in June helped by gains in the western part of the U.S. The National Association of Realtors (NAR) reported pending home sales rose 2.8% across the country, with each of the four major regions reporting gains.
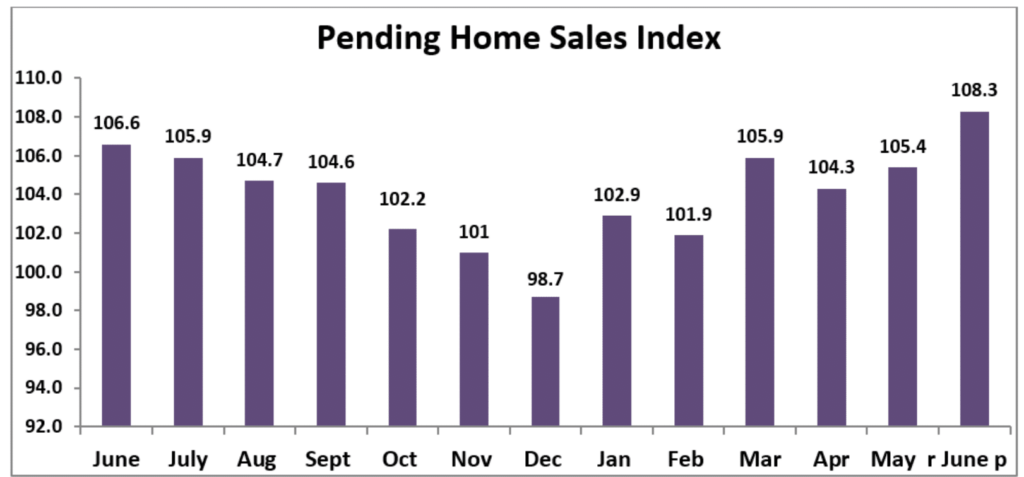
Source: NAR
Compared to the same time last year, sales were up 1.6%–their first year-over-year gain in 17 months. From the same time last year, pending home sales were up 0.9% in the Northeast, 1.7% in the Midwest, 1.4% in the South, and 2.5% in the West. Lawrence Yun, chief economist for the NAR wrote in the release, “Job growth is doing well, the stock market is near an all-time high and home values are consistently increasing.
When you combine that with the incredibly low mortgage rates, it is not surprising to now see two straight months of increases.”
Despite the increase in pending homes sales, the growth in home prices slowed further in May according to the latest report from S&P CoreLogic. The Case-Shiller 20-city home price index rose 0.1% in May compared with April.
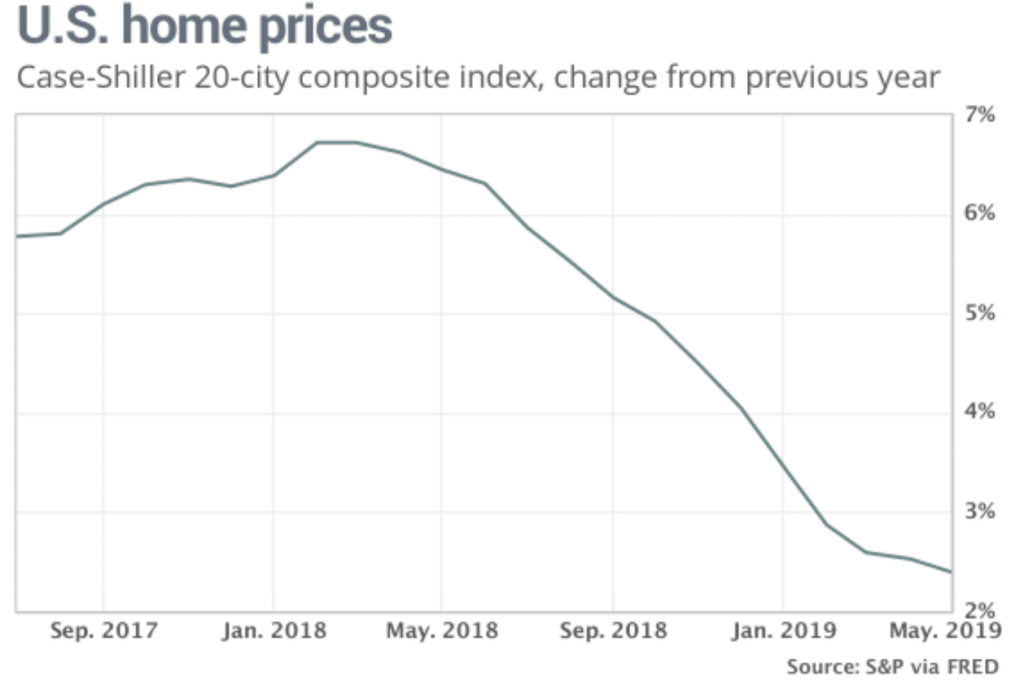
On an annual basis, prices were up 2.4% compared with a 2.5% annual rate the prior month. That marks the 14th consecutive month in which the annual rise in home prices has slowed and is the slowest growth rate since August 2012. Home prices have been slowing since March of 2018 and lower mortgage rates haven’t been able to stop the trend.
Reviewing some of the hot-spots, the Case Shiller report showed that Seattle home prices are down -1.2% from last year, but home prices in San Francisco and Las Vegas continued to increase—up 1% and 6.4%, respectively.
In a widely-expected move, the Federal Reserve cut interest rates this week, but the amount and the message disappointed financial markets. Stocks dropped after Fed chief Jerome Powell cut interest rates by a quarter point but implied that this might be a one-and-done deal instead of the first of several such cuts.
Markets were apparently hoping for a more aggressive monetary-easing campaign. Instead, Fed Chairman Jerome Powell described the interest-rate cut, the first since the 2008 financial crisis, as a “mid-cycle adjustment” that will hopefully get the economy going again. In addition, Powell stated he didn’t see the cut as the “beginning of a lengthy cutting cycle.”
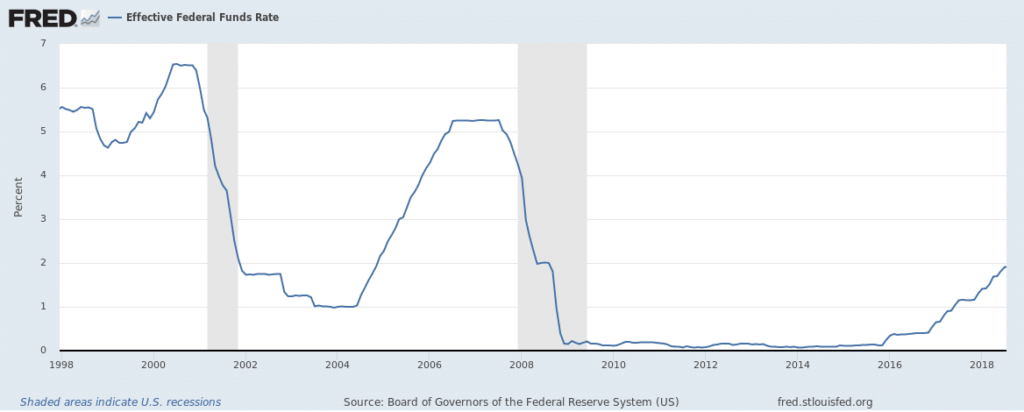
Markets sensed the Fed was less dovish than hoped as soon as the statement was announced, but dropped sharply once Powell rejected a large amount of easing. The Fed also said it was ending the program to shrink its balance sheet, known as quantitative tightening, on Aug. 1–two months earlier than planned.
Confidence among the nation’s consumers surged to a nearly 18-year high, the Conference board reported this week. The board’s consumer confidence index jumped 11.4 points to 135.7 in July, blowing away economists’ forecasts for a reading of 126.
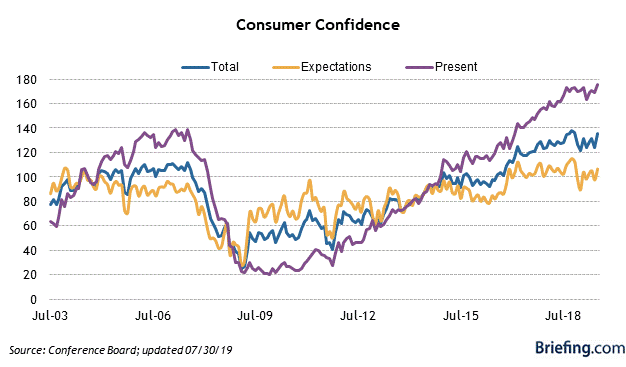
Confidence took a dive in June after trade talks with China hit an impasse and President Trump threatened to apply tariffs to all Mexican exports in a dispute over security at the Southern border. In the details, the present situation index, a measure of how consumers view the economy right now, rose to 170.9 from 164.3. Another index that asks consumers their views of the future also advanced. Both indexes are near the highest levels of the current economic expansion that began in mid-2009.
Lynn Franco, director of economic indicators at the board stated, “These high levels of confidence should continue to support robust spending in the near-term despite slower growth in GDP.”
The University of Michigan reported that the final reading of its consumer-sentiment index for July rose as well, up 0.2 point to 98.4 in July. Economists had expected a reading of 98.5. The index of consumer expectations rose while that for current conditions fell.
Recent surveys have shown the most favorable personal finance expectations since late spring of 2003, but consumers have also begun to take precautionary measures to increase savings and reduce debt. Attitudes toward buying homes and vehicles have significantly receded from their cyclical peaks despite declining interest rates, the University of Michigan said.
Current Indicators
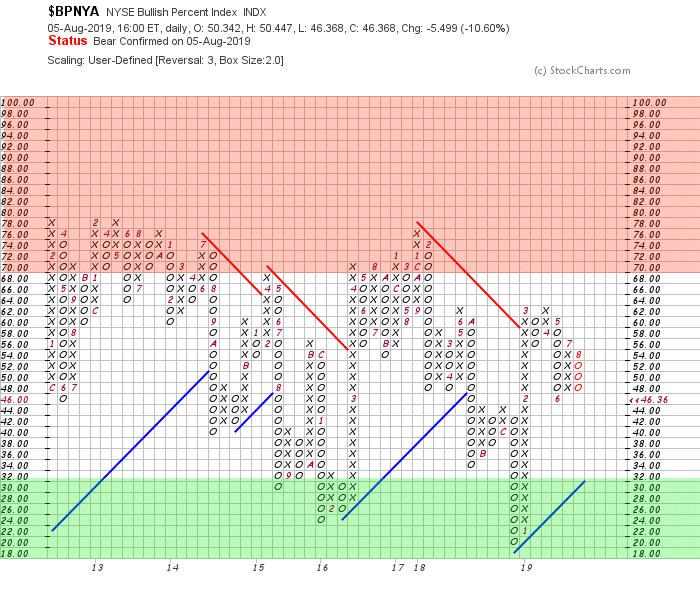
NYSE Bullish Percent Index: The NYSE Bullish % Index has fallen due to the decline in US equity markets during the last week of July. As a result, our models have switched from a “wealth accumulation” mode into “wealth preservation” mode.
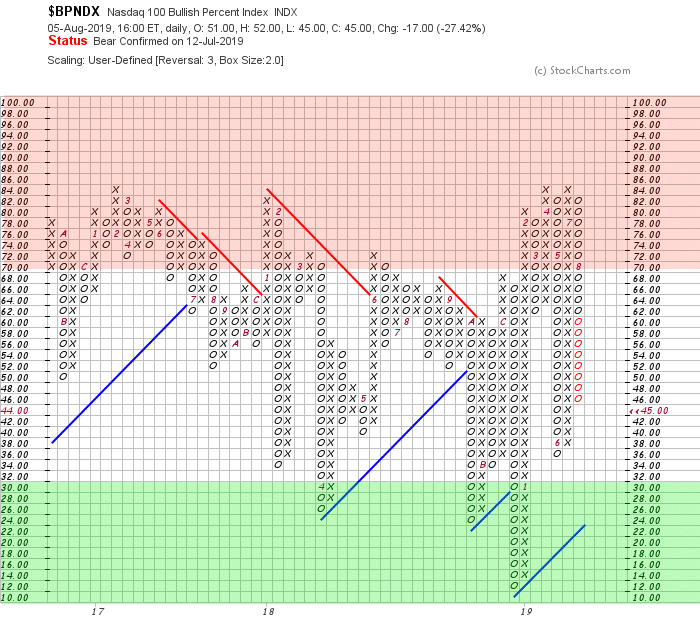
NASDAQ 100 Bullish Percent Index: The more volatile, tech-heavy Nasdaq 100 Bullish % Index is also declining. This indicator usually give us an early signal into directional changes of the market.
A reversal from lower levels may provide an opportunity to re-enter oversold market sectors.
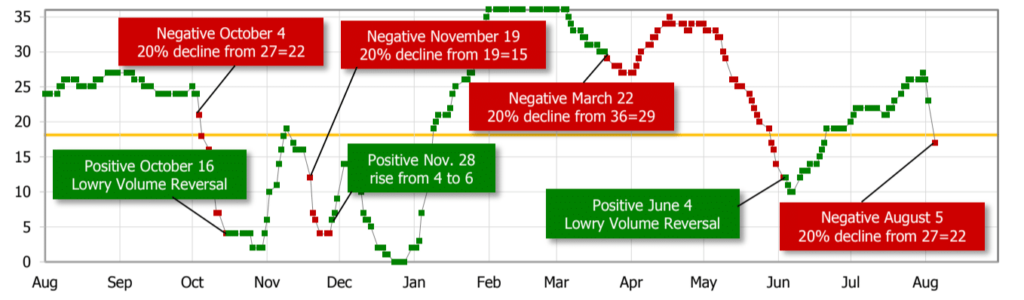
Short Term Trend: Our short term trend indicator has also reversed, confirming the change in the NYSE bullish percent indicator:
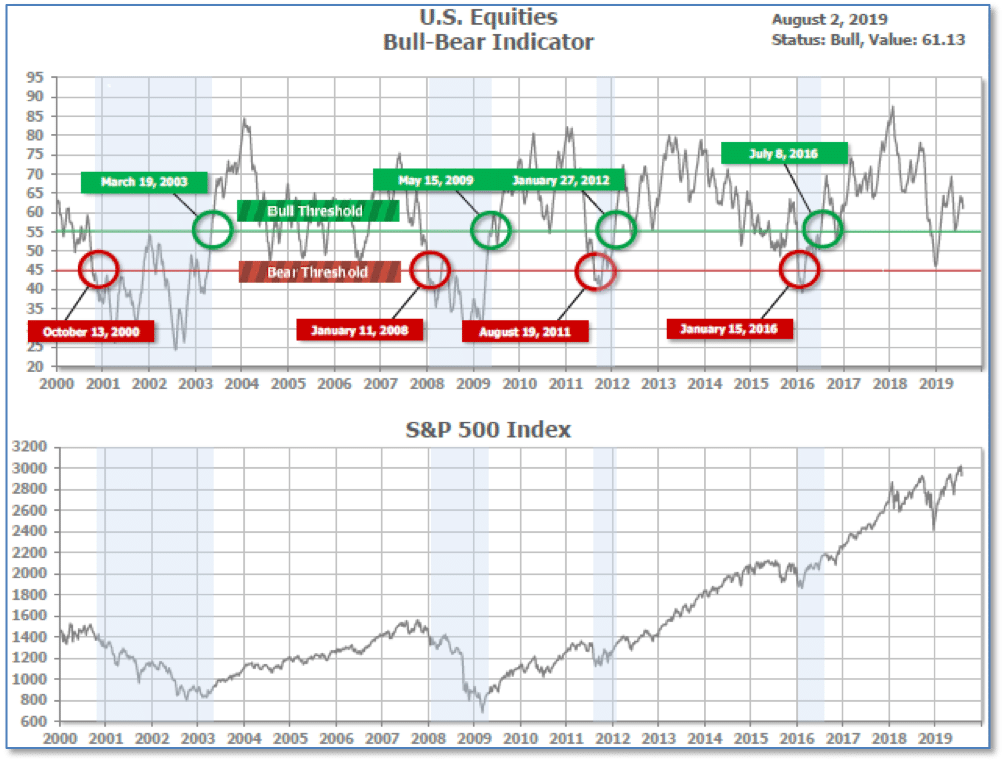
Bull/Bear Market Status: Our longer-term Bull/Bear Indicator, however, is still in “Bull Market” territory.
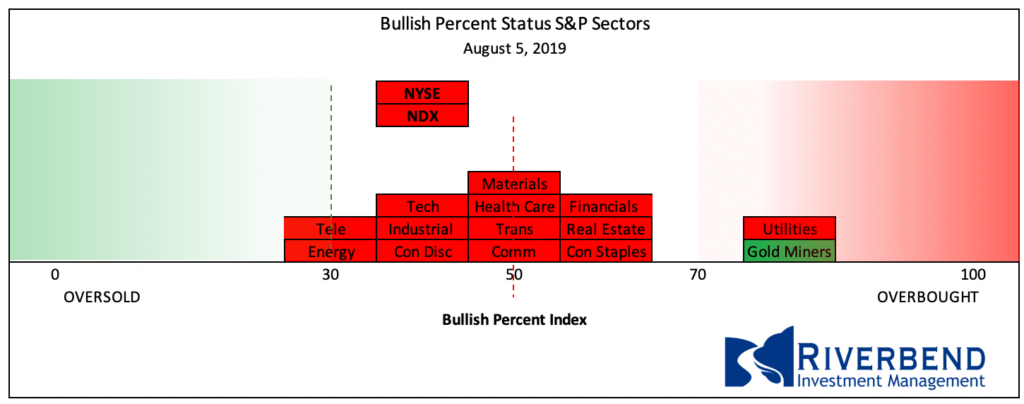
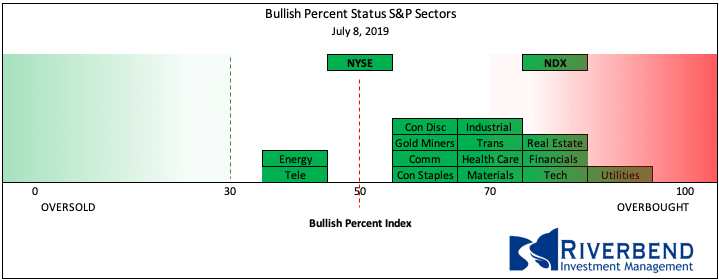
S&P Sector Bullish Percent Index/Bell Curve: Individual equity sectors have declined since last month’s reading:
August 2019
July 2019
SHUT vs DIME
The ranking relationship between the defensive SHUT sectors is one way to gauge institutional investor sentiment in the market.
“S”=Staples [a.k.a. consumer non-cyclical]
“H”=Healthcare
“U”=Utilities and
“T”=Telecom
and the offensive DIME sectors:
“D”=Discretionary [a.k.a. Consumer Cyclical]
“I”=Industrial,
“M”=Materials
“E”=Energy
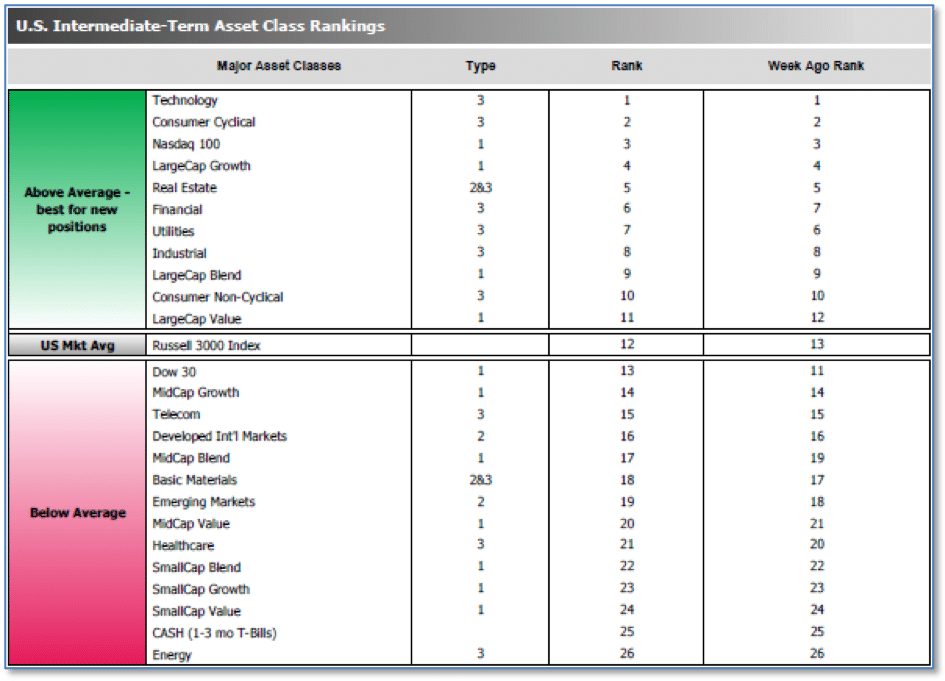
The average ranking of Defensive SHUT sectors dropped to 13.25 from the prior week’s 12.75, and the average ranking of the Offensive DIME sectors fell slightly to 13.50 from the prior week’s 13.25.
The Defensive SHUT sectors’ lead over Offensive DIME sectors continues to contract.
Note: these are “ranks”, not “scores”, so smaller numbers are higher ranks and larger numbers are lower ranks.
Chart of Interest
One non-obvious but historically accurate predictor of the stock market just hit its most bearish level since the internet bubble, says Marketwatch analyst Mark Hulbert.
It turns out July’s big increase in consumer confidence was actually bearish for the market, since the Conference Board’s Consumer Confidence Index (CCI) is a contrarian market indicator at its extremes.
In other words, extremely high values are bearish for stocks and extremely low values are bullish. The CCI stands today at its highest level in almost two decades, and that does not bode well for U.S. financial markets going forward, in Hulbert’s view.
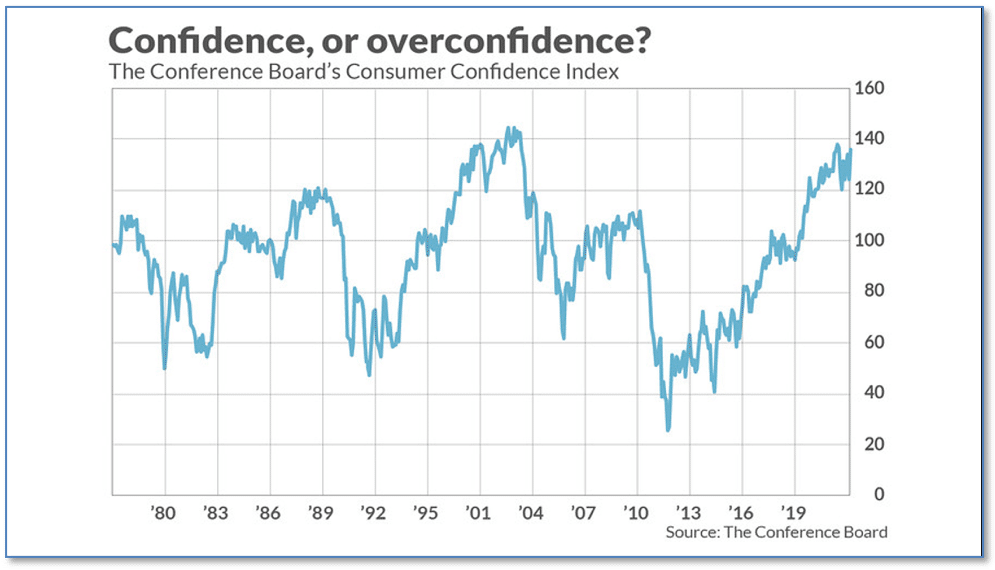
(Chart from Marketwatch.com, data from The Conference Board)
What’s Happening in Your Portfolio?
(as of 8/5/19)
At the start of August, our portfolio models switch from “wealth accumulation” mode to “wealth preservation” mode.
In late July portfolios started to raise cash as we took profits in overbought sectors.
Last week, we also hedged the core portion of our portfolios.
We will be closely watching for opportunities to re-enter the market when sectors begin to reverse from oversold conditions.
If you have any questions, please reach out to me directly at john.rothe@riverbendinvestments.com
(sources: all index return data from Yahoo Finance; Reuters, Barron’s, Wall St Journal, Bloomberg.com, ft.com, guggenheimpartners.com, ritholtz.com, markit.com, financialpost.com, Eurostat, Statistics Canada, Yahoo! Finance, stocksandnews.com, marketwatch.com, wantchinatimes.com, BBC, 361capital.com, pensionpartners.com, cnbc.com, Financial Media Exchange, FactSet; Figs 1-5 source W E Sherman & Co, LLC)
© 2019 Riverbend Investment Management, LLC. This presentation is intended for informational purposes only.
The information and statistical data contained herein have been obtained from sources we believe to be reliable but in no way are warranted by us as to accuracy or completeness. The opinions expressed are those of Riverbend Investment Management, LLC. and are subject to change without notice. No part of this presentation may be reproduced in any manner without the written permission of Riverbend Investment Management, LLC. Any securities discussed should not be construed as a recommendation to buy or sell and there is no guarantee that these securities will be held for a client’s account nor should it be assumed that they were or will be profitable. Past performance does not guarantee future comparable results.
ADV II available upon request
Riverbend Investment Management, LLC
1818 Library Street, Suite 500
Reston VA 20190
Tel:703-349-6327
www.riverbendinvestments.com


