Market Recap
U.S. Markets:
The Dow Jones Industrial Average logged its longest streak of weekly gains in nearly 25 years, as stocks finished the week modestly higher. The Dow rose 148 points last week to close at 26,031, a gain of 0.6%.
The technology-heavy NASDAQ Composite increased 0.7%, finishing the week at 7,527.
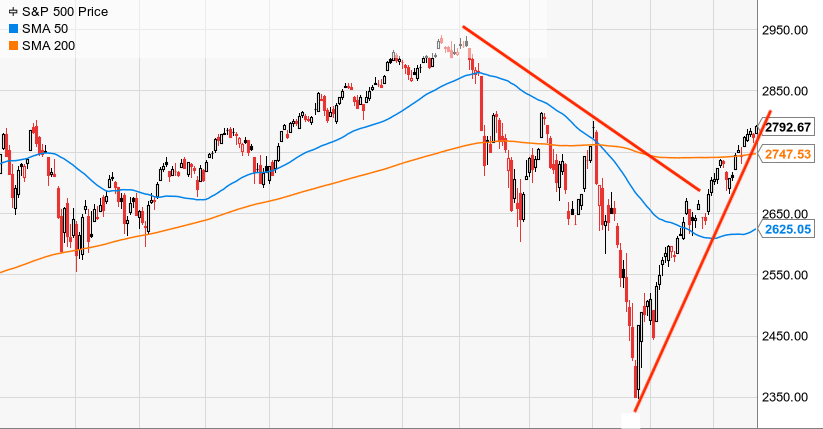
By market cap, smaller caps outperformed large caps with the S&P 400 Mid Cap Index and the small cap Russell 2000 gaining 1% and 1.3%, respectively, while the large cap S&P 500 rose 0.6%.
Canada’s TSX continued its winning streak by adding 1.1%, while the United Kingdom’s FTSE finished down -0.8%. On Europe’s mainland, France’s CAC 40 rose 1.2%, Germany’s DAX gained 1.4%, and Italy’s Milan FTSE ticked up a more modest 0.2%.
In Asia, China’s Shanghai Composite surged 4.5% and Japan’s Nikkei added 2.5%. As grouped by Morgan Stanley Capital International, developed markets rose 0.8% while emerging markets jumped 2.3%.
International Markets : Canada’s TSX continued its winning streak by adding 1.1%, while the United Kingdom’s FTSE finished down -0.8%. On Europe’s mainland, France’s CAC 40 rose 1.2%, Germany’s DAX gained 1.4%, and Italy’s Milan FTSE ticked up a more modest 0.2%.
In Asia, China’s Shanghai Composite surged 4.5% and Japan’s Nikkei added 2.5%. As grouped by Morgan Stanley Capital International, developed markets rose 0.8% while emerging markets jumped 2.3%.
Commodities: Precious metals finished the week up with Gold rising 0.8% to $1332.80 per ounce, and Silver closed at $15.91 an ounce, a gain of 1.1%.
Oil continued its rally, rising 2.3% and closing at $57.26 per barrel of West Texas Intermediate crude.
The industrial metal copper, seen as a barometer of world economic health due to its variety of uses, jumped 5.5% this week.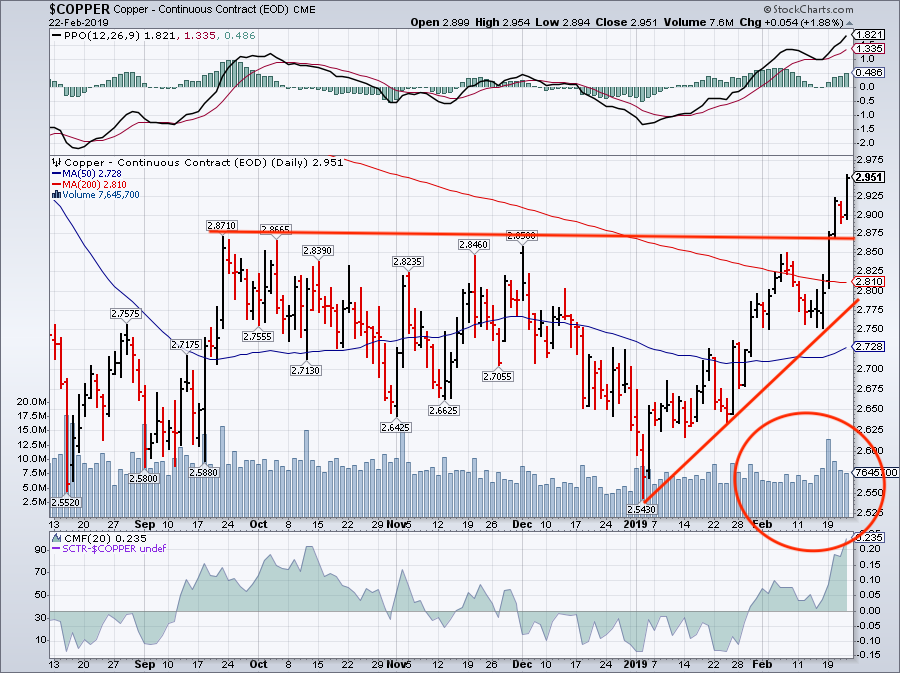
U.S. Economic News
Confidence among the nation’s homebuilders jumped this month to its highest level in four months. The National Association of Home Builder (NAHB) monthly confidence index jumped 4 points to a seasonally-adjusted level of 62 in February, beating consensus estimates of just a one point gain. The index rose for a second straight month, and the increase was the most since December of 2017.
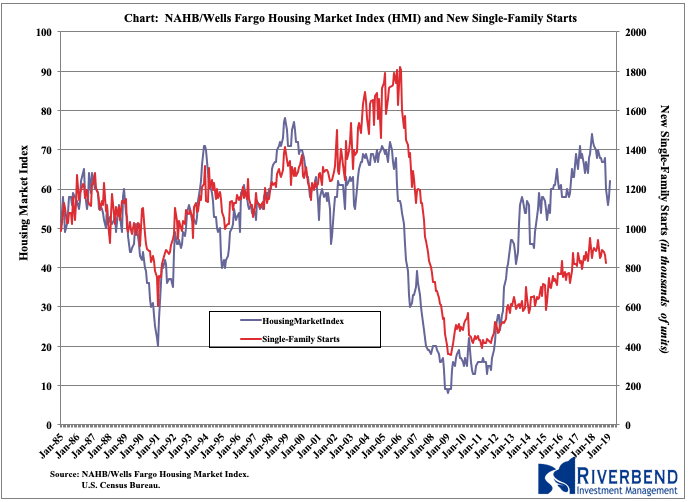
Analysts noted higher consumer confidence and lower mortgage rates boosted expectations were responsible for the gain. In addition, all of the index’s subcomponents advanced. However, the NAHB noted in its statement that “affordability remains a critical issue”, regulations are still “excessive”, and the Trump administration’s tariffs have made raw materials more expensive.
Despite the optimism among builders, sales of existing homes continued to decline, dropping 1.2% in January. The National Association of Realtors (NAR) reported sales fell to a 4.94 million unit annual rate—its lowest level since November of 2015 and its third consecutive decline.
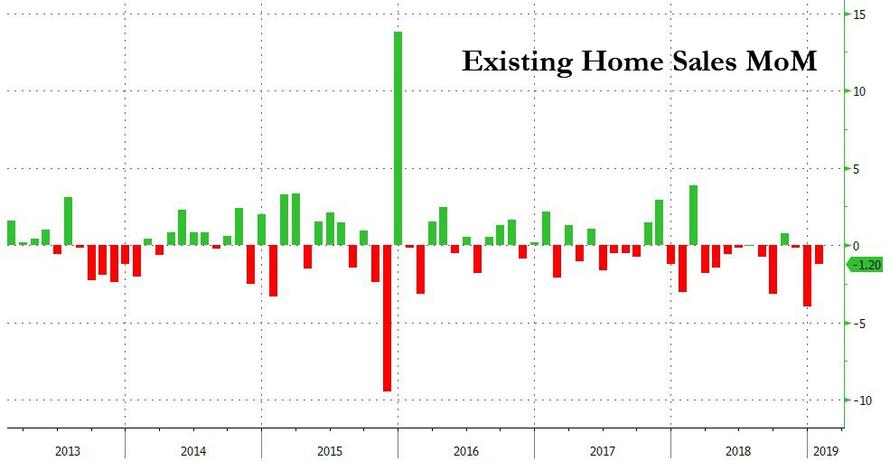
The reading missed the consensus for a 0.6% increase to a 5.02 million unit rate. Sales fell in three of the four regions, rising only in the Northeast. Single-family homes, which account for over 90% of total sales, fell 1.8% while condo/co-ops rebounded 3.6%.
The median price of a home sold in February was $247,500, up 2.8% compared to the same time last year. While some sales were undoubtedly delayed by the government shutdown, inventory shortages persisted. The “Months Available” supply of housing ticked up to 3.9 months from 3.7—still far below the 6 month supply that analysts consider a “balanced” housing market.
Orders for goods intended to last at least three years, so-called “durable goods”, rose 1.2% in December. The result missed consensus estimates of a 1.5% increase. However, analysts noted that in the details of the report things weren’t as good as they seemed. The result was led by orders for costly civilian aircraft and vehicles which can heavily skew the headline number.
Ex-transportation, orders ticked up a bare 0.1%. Furthermore, nondefense capital goods orders ex-aircraft, or “core” business orders, were actually off -0.7% and down four of the past five months. Year over year, durable goods orders moderated to 5.3% growth, while core orders edged up slightly to 4.1%. Both were close to their slowest rates since the spring of 2017.
In the city of Brotherly Love, manufacturing activity plunged sharply into negative territory in February for the first time in almost three years. The Philadelphia Fed’s General Business Activity Index dropped 21.1 points last month, the most since August 2011, to -4.1. This level indicates contraction for the first time since May 2016.
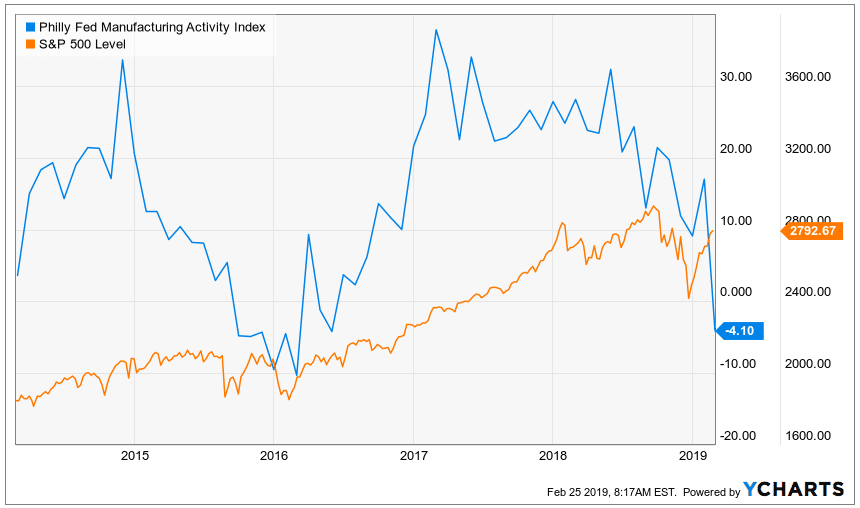
The consensus estimate was for just a 3 point pullback to 14. In the report’s details, new orders and shipments nosedived, although employment indicators held relatively steady. In the near term, the outlook for factory conditions in the region remained positive and virtually unchanged from the previous month. However, new orders were the weakest in three years, suggesting softer future demand. The inflation outlook also eased.
The Conference Board’s Leading Economic Index (LEI) fell last month suggesting a slowdown in growth, but analysts note there’s a catch. The LEI fell 0.1% in January, missing the consensus forecast of a 0.1% gain, but the latest results were incomplete because of the recently ended government shutdown. Ataman Ozyildirim, director of economic research, stated the decline in the leading index stemmed predominantly from an increase in initial jobless claims and “weaknesses in the labor market”. However three of the index’s ten components—building permits, orders for consumer goods, and orders for capital goods, were missing due to the federal shutdown.
Federal Reserve officials broke into two separate camps over future interest-rate hikes, according to the January meeting minutes released this week. In the release, “several” officials argued that rate increases might be needed only if inflation outcomes were higher than the baseline forecast.
However, the minutes also showed several other officials thought it would be appropriate to raise the federal funds rate later this year if the economy evolved as expected. Officials said they thought being patient posed “few risks at this point”.
The majority of Fed officials agreed that when the uncertainty over the outlook abated the Fed would reassess its characterization of policy as “patient”. Regarding the Fed’s balance sheet, “almost all” participants wanted to stop reducing the size of the balance sheet later this year and agreeing to reinvest mortgage-backed securities into Treasuries once the runoff stops.
Current Indicators
NYSE Bullish Percent Index: 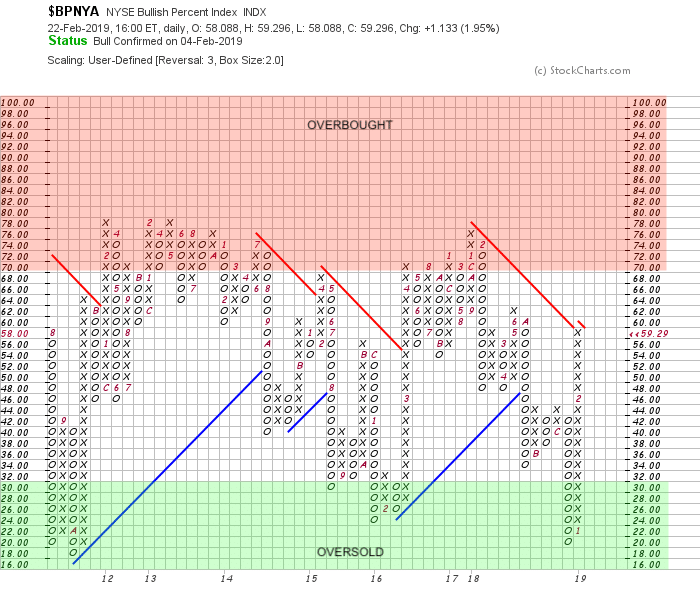
Short Term Trend: Our short term directional indicator is telling us that we are in an overbought market – however, overbought markets can last weeks or even months.
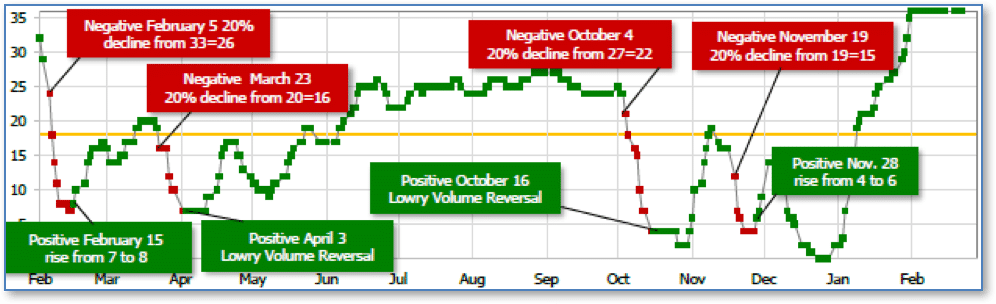
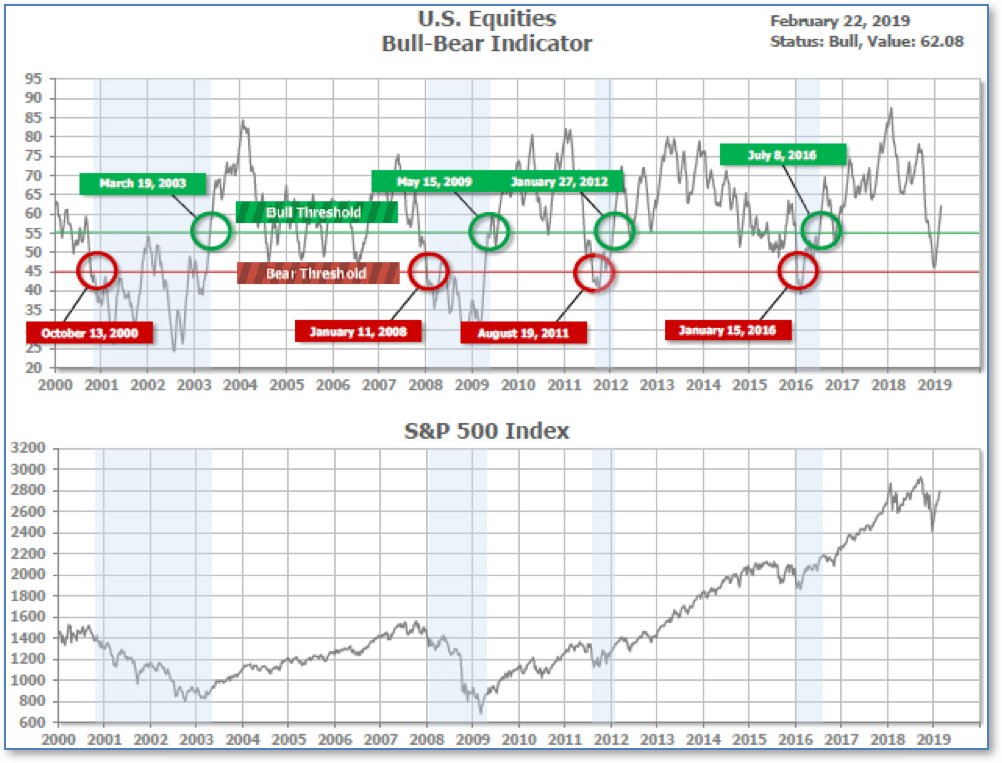
Bull/Bear Market Status
Our long-term bull/bear market trend indicator is still rising, indicating any short term pullbacks in US equities may be a buying opportunity:
S&P Sector Bullish Percent Index:
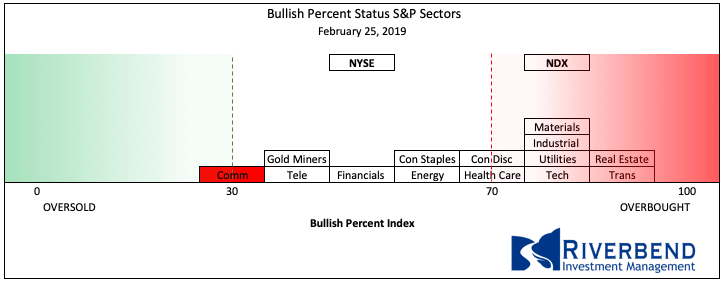
SHUT vs DIME
The ranking relationship between the defensive SHUT sectors is one way to gauge institutional investor sentiment in the market.
“S”=Staples [a.k.a. consumer non-cyclical]
“H”=Healthcare
“U”=Utilities and
“T”=Telecom
and the offensive DIME sectors:
“D”=Discretionary [a.k.a. Consumer Cyclical]
“I”=Industrial,
“M”=Materials
“E”=Energy
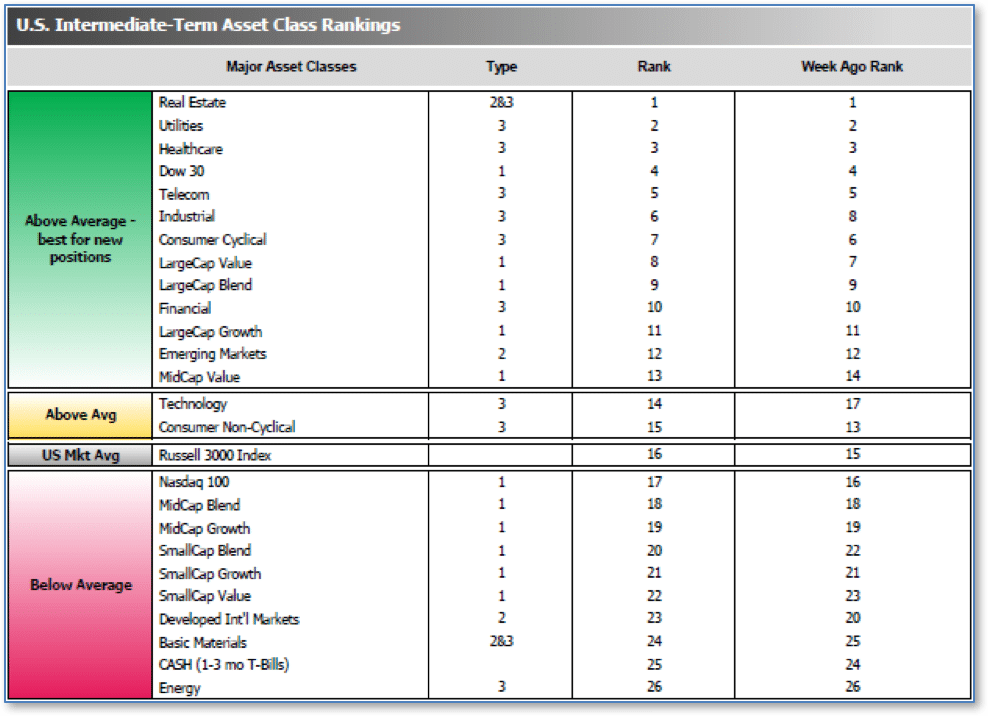
The average ranking of Defensive SHUT sectors slipped to 6.25 from the prior week’s 5.75, while the average ranking of Offensive DIME sectors rose to 15.75 from last week’s 16.25.
The Defensive SHUT sectors gave up more of their lead over Offensive DIME sectors.
Note: these are “ranks”, not “scores”, so smaller numbers are higher ranks and larger numbers are lower ranks.
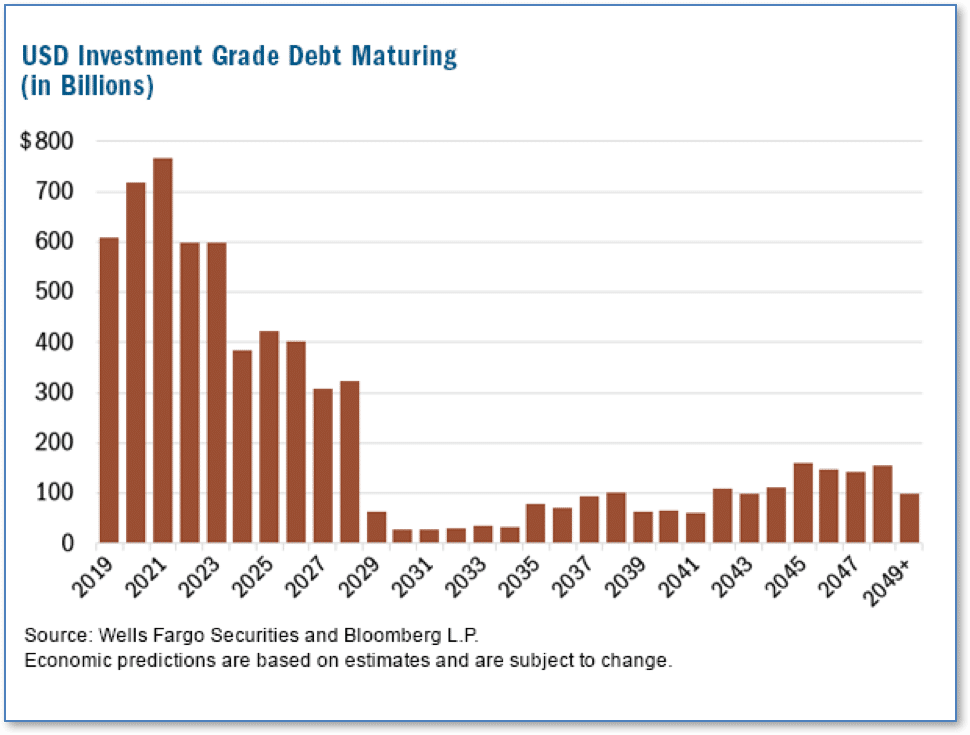
Chart of Interest
One area of the fixed income space that hasn’t received much press is investment grade corporate debt.
With historically low interest rates, a strong economy, and relaxed lending standards, the prevailing thought was that borrowing to buy back shares or finance acquisitions was a low-risk strategy for a company with a decent balance sheet.
What concerns analysts is the sheer size of the unprecedented borrowing that occurred. As shown in the chart below (from Wells Fargo), roughly $3.3 trillion—or 48% of all outstanding commercial debt—will come due in just the next four years.
The total volume would be challenging for the market to absorb in the best of economic times, let alone 10 years into an economic expansion. Analysts acknowledge that while the level of debt coming due is not necessarily a sign of an impending financial crisis, it will certainly be a headwind for companies in the intermediate term.
Riverbend Model Portfolio Allocation:
(as of 2/1/19)
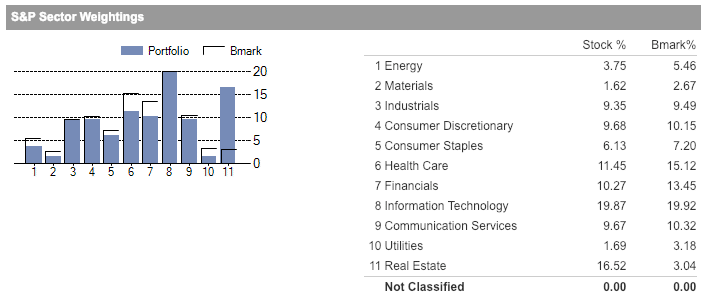
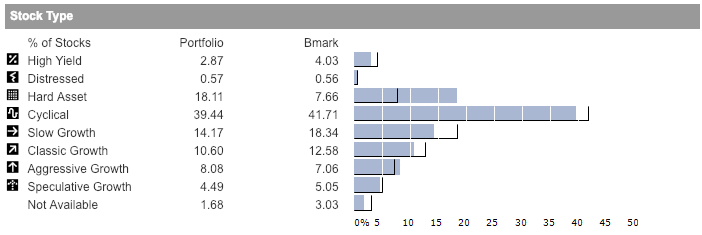 Source: Morningstar
(sources: all index return data from Yahoo Finance; Reuters, Barron’s, Wall St Journal, Bloomberg.com, ft.com, guggenheimpartners.com, ritholtz.com, markit.com, financialpost.com, Eurostat, Statistics Canada, Yahoo! Finance, stocksandnews.com, marketwatch.com, wantchinatimes.com, BBC, 361capital.com, pensionpartners.com, cnbc.com, FactSet; Figs 1-5 source W E Sherman & Co, LLC)
© 2019 Riverbend Investment Management, LLC. This presentation is intended for informational purposes only.
The information and statistical data contained herein have been obtained from sources we believe to be reliable but in no way are warranted by us as to accuracy or completeness. The opinions expressed are those of Riverbend Investment Management, LLC. and are subject to change without notice. No part of this presentation may be reproduced in any manner without the written permission of Riverbend Investment Management, LLC. Any securities discussed should not be construed as a recommendation to buy or sell and there is no guarantee that these securities will be held for a client’s account nor should it be assumed that they were or will be profitable. Past performance does not guarantee future comparable results.
Riverbend Investment Management, LLC is a Registered Investment Adviser in Northern VA
ADV II available upon request
Riverbend Investment Management, LLC
1818 Library Street, Suite 500
Reston VA 20190
Tel:703-349-6327
www.riverbendinvestments.com


