Please note: Due to a shortened trading week, there will be no video update this week
U.S. Markets:
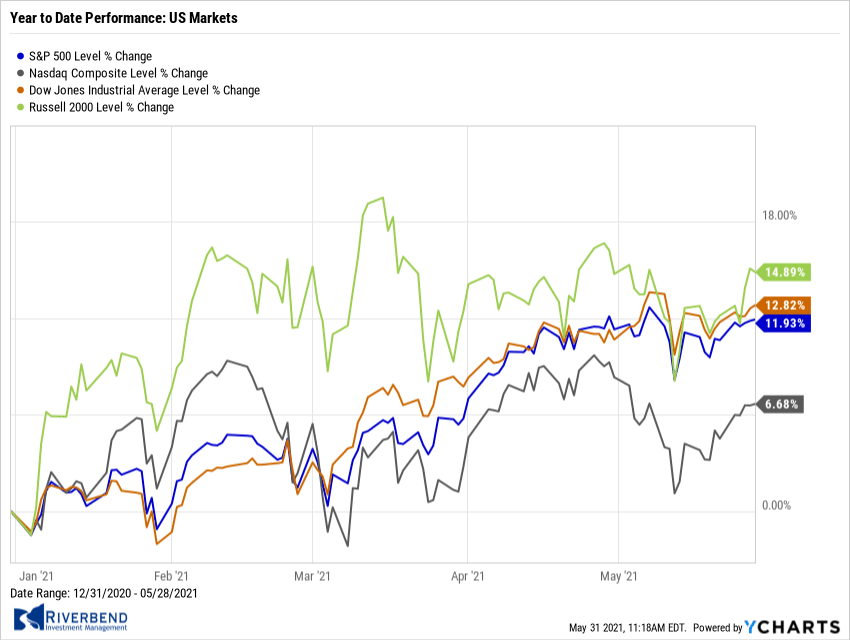
U.S. stocks recorded solid gains for the week, bringing the benchmark S&P 500 Index nearly back to its all-time highs.
The Dow Jones Industrial Average gained 322 points to close at 34,529, a rise of 0.9%. The technology-heavy NASDAQ Composite had its second week of gains, adding 2.1%.
By market cap, the large cap S&P 500 rose 1.2%, while the mid cap S&P 400 and small cap Russell 2000 indexes added 1.4% and 2.4%, respectively.
International Markets: 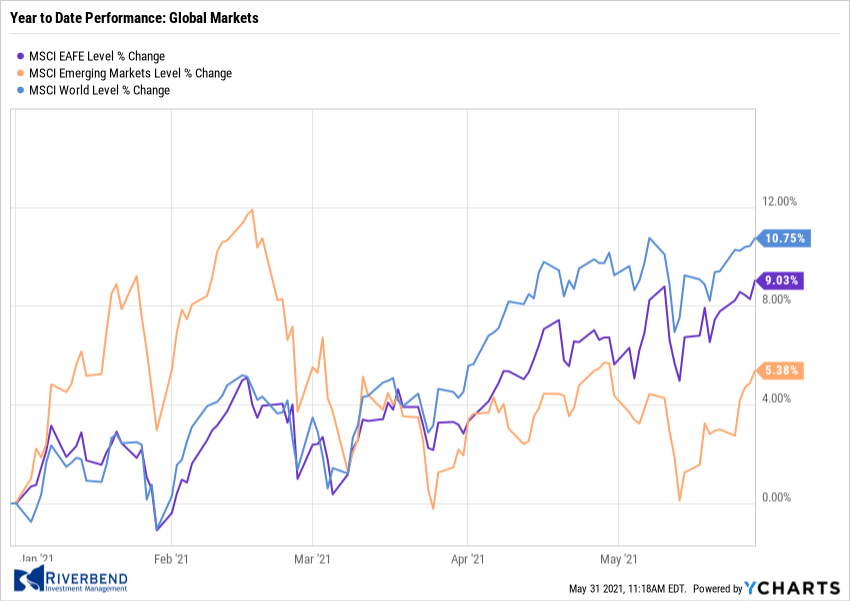
Major international markets finished the week in the green. Canada’s TSX rose 1.7%, while the United Kingdom’s FTSE 100 ticked up 0.1%.
France’s CAC 40 and Germany’s DAX rose 1.5% and 0.5%, respectively, while in Asia, China’s Shanghai Composite rose 3.3%. Japan’s Nikkei ended the week up 2.9%.
As grouped by Morgan Stanley Capital International, emerging markets rose 3.3%, while developed markets added 1.0%.
Commodities: 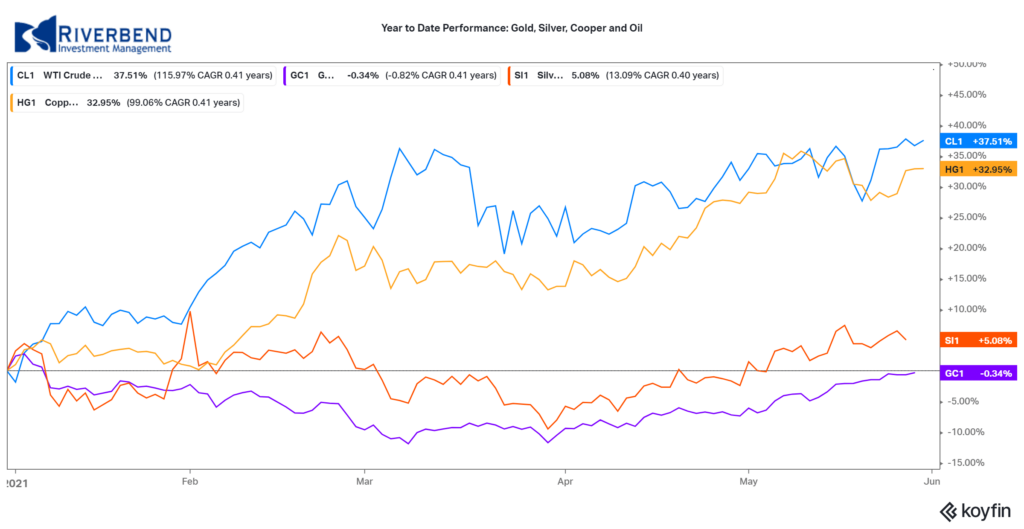
Precious metals continued their rise for a fourth week. Gold rose 1.5% to $1905.30 per ounce, while Silver finished the week up 1.9% to $28.01.
Oil continued to consolidate near its highs reached in early March. West Texas Intermediate crude oil finished the week up 4.3% to $66.32 per barrel.
The industrial metal copper, viewed by some analysts as a barometer of global economic health due to its wide variety of uses, retraced last week’s decline finishing the week up 4.4%.
May Summary:
U.S. markets were mixed for the month of May. The Dow Jones Industrial Average rose 1.9%, while the NASDAQ Composite gave up -4.4%. The large cap S&P 500 gained 0.5%, and the mid cap S&P 400 and small cap Russell 2000 each ticked up a scant 0.1%.
International markets outperformed U.S. indices for the month of May. Canada and the UK rose 3.9% and 0.8%, while France added 3.4% and Germany gained 2.5%.
China finished the month up 4.5% and Japan added 1.2%. Emerging markets rose 1.6% in May while developed markets added 3.5%.
Precious metals had an especially strong month with Gold rallying 7.8% and Silver surging 8.3%. Oil and copper gained 4.3% and 4.7%, respectively.
U.S. Economic News: 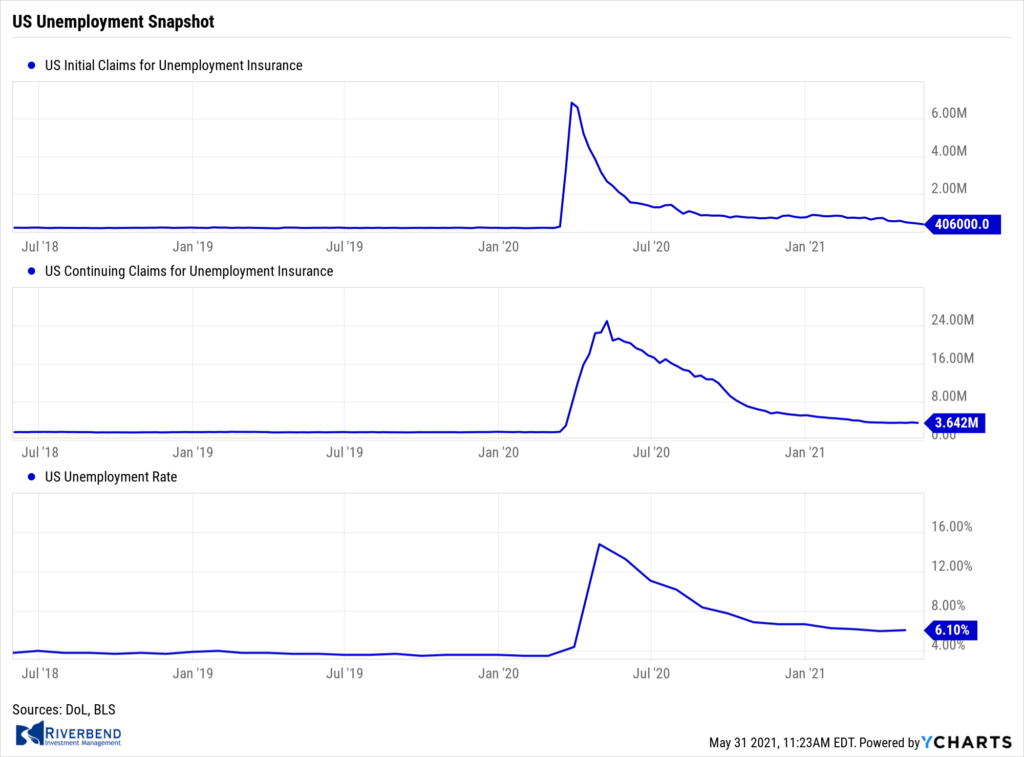
The number of Americans applying for first-time unemployment benefits fell to new pandemic lows as the U.S. economy continued to recover and companies to hired more workers. The Labor Department reported initial jobless claims sank by 38,000 to 406,000 in the week ended May 22. That was the fewest number of compensation claims since the onset of the pandemic nearly 15 months ago.
Economists had forecast new claims would total a seasonally-adjusted 425,000. New requests were down sharply from the nearly 900,000 readings seen in early January. Meanwhile, the number of people already collecting benefits, so-called “continuing claims”, fell by 96,000 to a seasonally-adjusted 3.64 million. That reading is reported with a one-week delay.
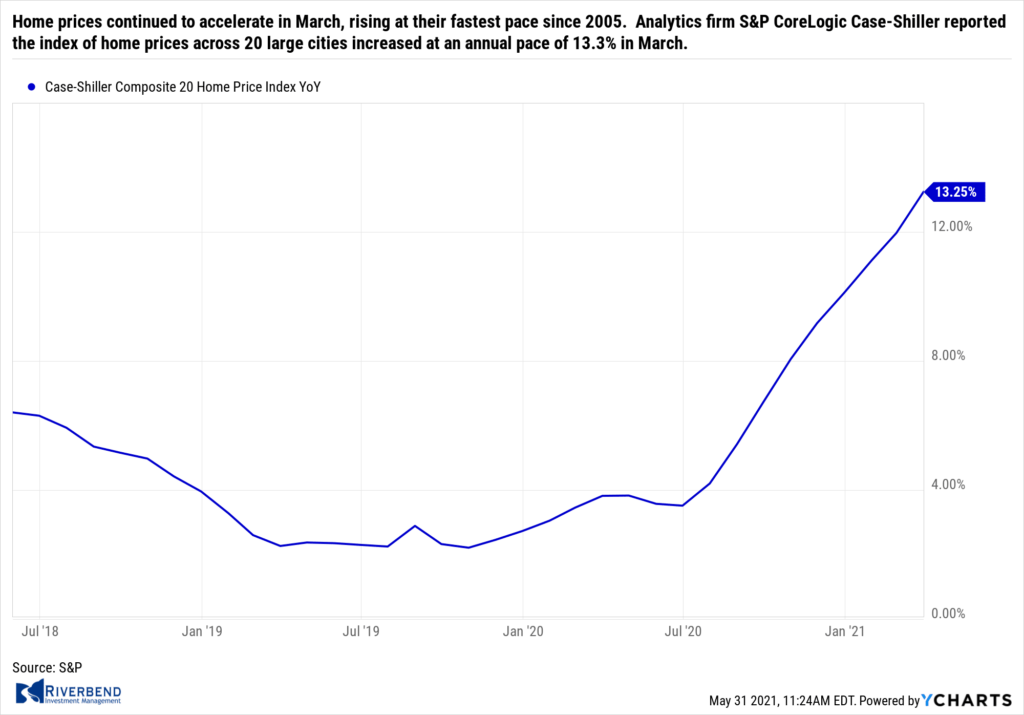
Home prices continued to accelerate in March, rising at their fastest pace since 2005. Analytics firm S&P CoreLogic Case-Shiller reported the index of home prices across 20 large cities increased at an annual pace of 13.3% in March. Among the 20 cities that the index tracks, Phoenix again saw the largest increase with a 20% jump, followed by San Diego (up 19.1%) and Seattle (up 18.3%). On a monthly basis, home prices were up 1.6%. Craig Lazzara, managing director and global head of index investment strategy at S&P DJI stated, “The market’s strength is broadly-based: all 20 cities rose, and all 20 gained more in the 12 months ended in March than they had gained in the 12 months ended in February.” Separately, the national home price index, which measures home prices across the country, rose a similar 13.2% over the past year. The latest reading is the highest annual gain since December 2005.
Sales of new homes fell in April by nearly 6% as affordability constraints begin to weigh on home buyers. The U.S. Census Bureau reported new residential sales occurred at a seasonally-adjusted annual rate of 863,000. Despite the lower reading, new home sales were still up 48% compared to the same time last year. The median forecast of economists polled was 959,000. Analysts noted the decline in mortgage demand could be a reflection of both buyers’ and builders’ concerns about affordability, as mortgage rates have risen this year alongside home prices. The market for new homes is seeing price pressures not just due to the high demand for housing but also because of rising material costs that are driving construction expenses substantially higher.
Source: Bloomberg, Conference Board
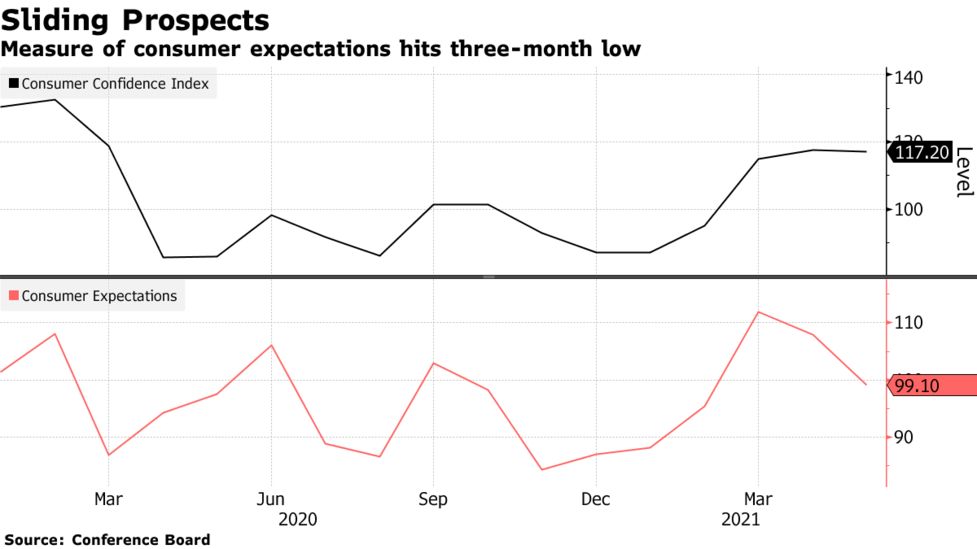
For the first time in six months, the confidence of American consumers slipped as they grew more worried about the rising cost of living and future job prospects. The Conference Board reported its closely followed survey of consumer confidence slipped 0.3 point to 117.2 in May. Economists had forecast a reading of 119.5. All three major surveys of consumer confidence declined in May even as states loosened or eliminated altogether restrictions put in place during the pandemic.
Nonetheless, the reopening of the economy combined with massive federal stimulus has unleashed a surge in pent-up demand. That demand has pushed the cost of many goods and services to record highs, increasing worries of inflation. The part of the survey that asks how consumers feel about the economy right now surged again to 144.3 from 131.9–a new pandemic high. However, the measure of how Americans view the next six months sank to 99.1 from 107.9—a three-month low.
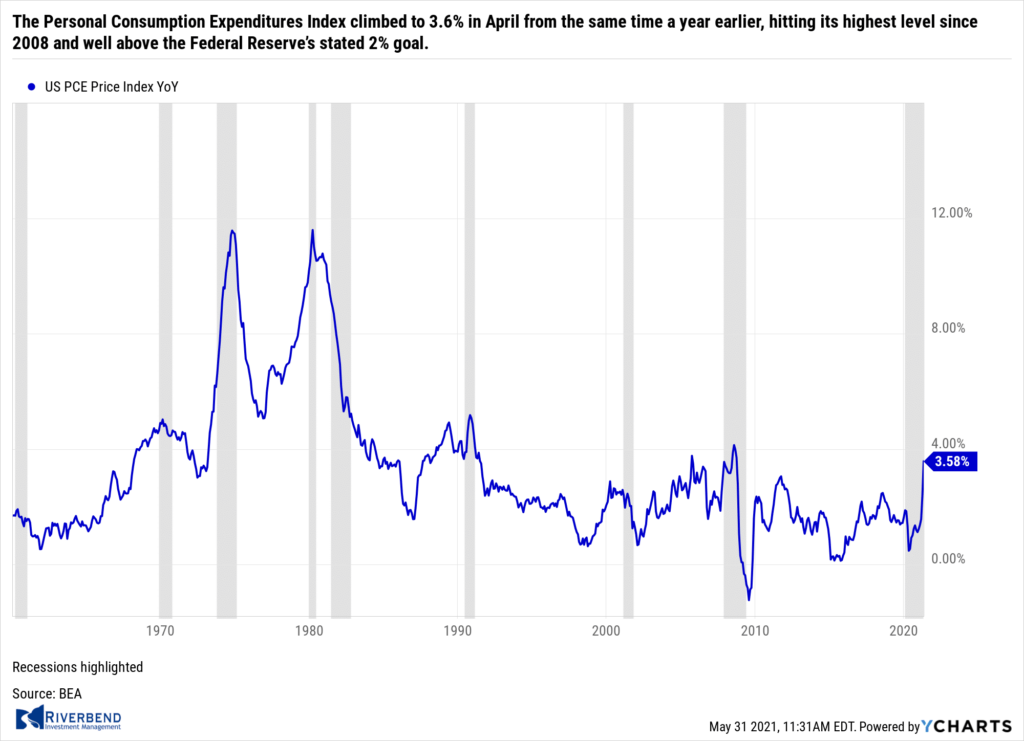
A key measure of inflation rose again last month hitting a 13-year high, reflecting the broad surge in consumer prices as the U.S. fully reopens for business. The Personal Consumption Expenditures Index climbed to 3.6% in April from the same time a year earlier, hitting its highest level since 2008 and well above the Federal Reserve’s stated 2% goal. A separate measure of inflation that strips out food and energy also rose to its highest level since 1992. Still, the Federal Reserve insists inflation will fade to its 2% target by next year, once the economy is on firmer footing and the pandemic is well behind us.
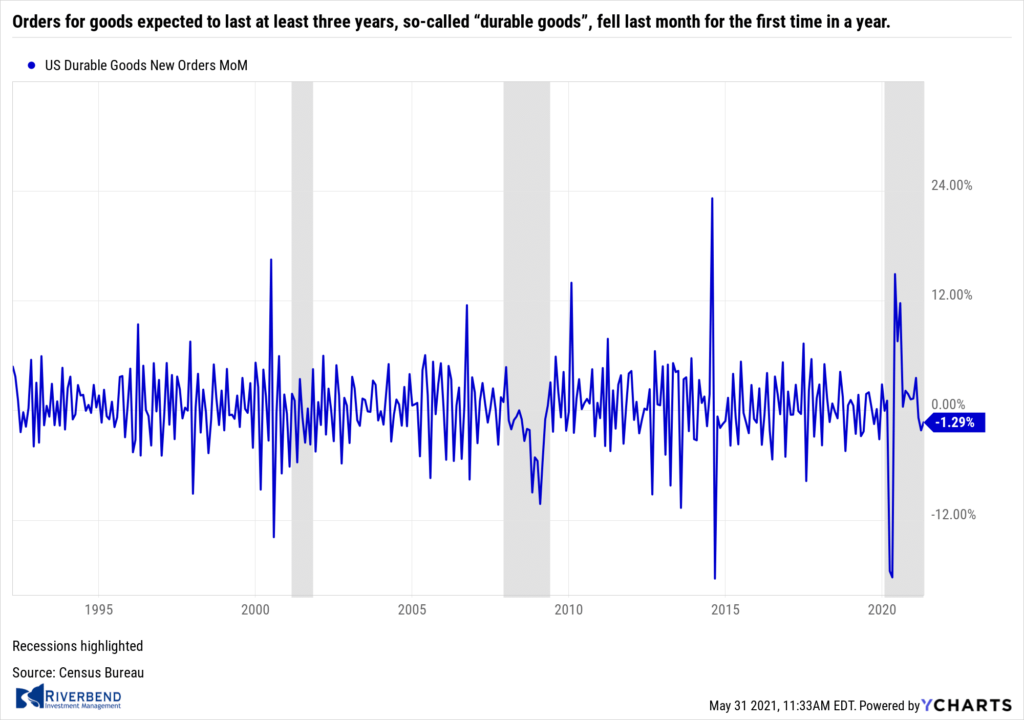
Orders for goods expected to last at least three years, so-called “durable goods”, fell last month for the first time in a year. The Census Bureau reported orders for durable goods slipped 1.3% in April. Economists had expected a 0.9% increase. The decline stemmed almost entirely from a big drop in orders for new cars and trucks. Automakers have plenty of demand, but they can’t fill new orders fast enough because of an ongoing global shortage of computer chips.
These shortages are likely to drag on for months until bottlenecks created by the pandemic are eliminated and pent-up demand is filled. Excluding transportation, new orders rose a healthy 1.1% in April. The best news in the report was a 2.3% increase in business investment. Companies are now investing more than they did before the pandemic and it’s likely to keep going up, economists say.
Chart of the Week: 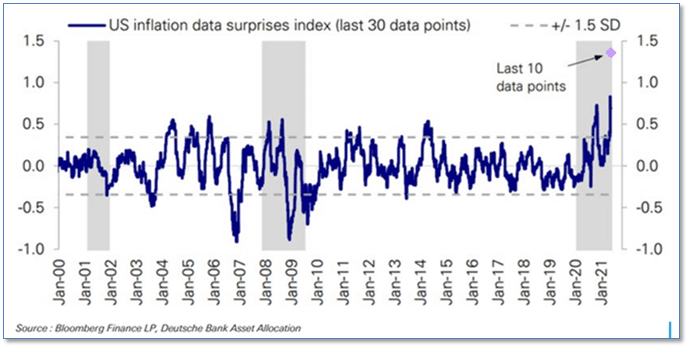
Despite the Fed’s insistence that the present jump in inflation readings is “transient” and “temporary”, indications of widespread inflation are becoming so numerous as to be overwhelming.
Deutsche Bank maintains a data series it calls the “Inflation Data Surprises Index”, which monitors unexpectedly-high or –low inflation reports across the economy.
The current readings are the highest in the 20-year history of the index. Deutsche Bank strategist Jim Reid described the last 10 data points as “almost off the chart”. (Chart from Deutsche Bank)
Riverbend Indicators:

Each week we post notable changes to the various market indicators we follow.
- As a reading of our Bull-Bear Indicator for U.S. Equities (comparative measurements over a rolling one-year timeframe), we remain in Cyclical Bull territory.
- Counting-up of the number of all our indicators that are ‘Up’ for U.S. Equities, the current tally is that four of four are Positive, representing a multitude of timeframes (two that can be solely days/weeks, or months+ at a time; another, a quarter at a time; and lastly, the {typically} years-long reading, that being the Cyclical Bull or Bear status).
The Week Ahead:
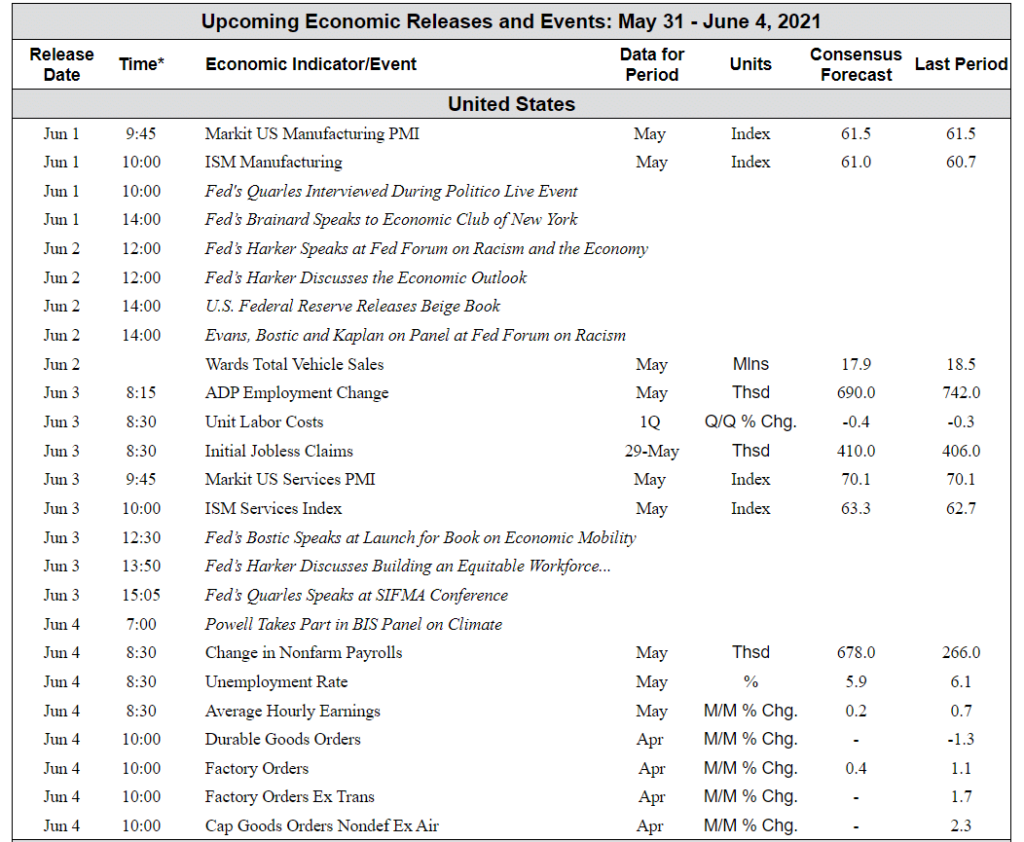
Source: Bloomberg. TD Economics
(Sources: All index- and returns-data from Yahoo Finance; news from Reuters, Barron’s, Wall St. Journal, Bloomberg.com, ft.com, guggenheimpartners.com, zerohedge.com, ritholtz.com, markit.com, financialpost.com, Eurostat, Statistics Canada, Yahoo! Finance, stocksandnews.com, marketwatch.com, wantchinatimes.com, BBC, 361capital.com, pensionpartners.com, cnbc.com, FactSet.)


