[fusion_builder_container hundred_percent=”no” equal_height_columns=”no” menu_anchor=”” hide_on_mobile=”small-visibility,medium-visibility,large-visibility” class=”” id=”” background_color=”” background_image=”” background_position=”center center” background_repeat=”no-repeat” fade=”no” background_parallax=”none” parallax_speed=”0.3″ video_mp4=”” video_webm=”” video_ogv=”” video_url=”” video_aspect_ratio=”16:9″ video_loop=”yes” video_mute=”yes” overlay_color=”” video_preview_image=”” border_size=”” border_color=”” border_style=”solid” padding_top=”” padding_bottom=”” padding_left=”” padding_right=””][fusion_builder_row][fusion_builder_column type=”1_6″ layout=”1_6″ spacing=”” center_content=”no” link=”” target=”_self” min_height=”” hide_on_mobile=”small-visibility,medium-visibility,large-visibility” class=”” id=”” hover_type=”none” border_size=”0″ border_color=”” border_style=”solid” border_position=”all” box_shadow=”no” box_shadow_blur=”0″ box_shadow_spread=”0″ box_shadow_color=”” box_shadow_style=”” background_type=”single” gradient_start_position=”0″ gradient_end_position=”100″ gradient_type=”linear” radial_direction=”center” linear_angle=”180″ background_color=”” background_image=”” background_image_id=”” background_position=”left top” background_repeat=”no-repeat” background_blend_mode=”none” animation_type=”” animation_direction=”left” animation_speed=”0.3″ animation_offset=”” filter_type=”regular” filter_hue=”0″ filter_saturation=”100″ filter_brightness=”100″ filter_contrast=”100″ filter_invert=”0″ filter_sepia=”0″ filter_opacity=”100″ filter_blur=”0″ filter_hue_hover=”0″ filter_saturation_hover=”100″ filter_brightness_hover=”100″ filter_contrast_hover=”100″ filter_invert_hover=”0″ filter_sepia_hover=”0″ filter_opacity_hover=”100″ filter_blur_hover=”0″ last=”no”][/fusion_builder_column][fusion_builder_column type=”2_3″ layout=”1_1″ background_position=”left top” background_color=”” border_size=”” border_color=”” border_style=”solid” border_position=”all” spacing=”yes” background_image=”” background_repeat=”no-repeat” padding_top=”” padding_right=”” padding_bottom=”” padding_left=”” margin_top=”0px” margin_bottom=”0px” class=”” id=”” animation_type=”” animation_speed=”0.3″ animation_direction=”left” hide_on_mobile=”small-visibility,medium-visibility,large-visibility” center_content=”no” last=”no” min_height=”” hover_type=”none” link=””][fusion_text]
[/fusion_text][fusion_vimeo id=”541862222″ alignment=”center” width=”1000″ height=”” autoplay=”false” api_params=”” hide_on_mobile=”small-visibility,medium-visibility,large-visibility” class=”” css_id=”” /][fusion_text]
U.S. Markets: 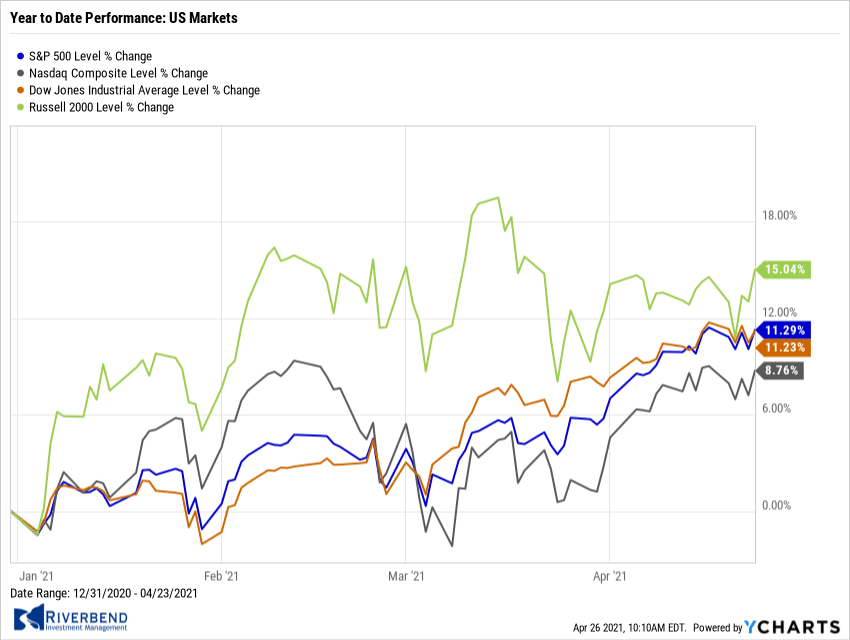
Domestic markets finished the week little changed, with some of the lightest daily trading volumes of the year. Mid- and small-caps performed better than large caps, and the technology-heavy Nasdaq Composite Index modestly lagged the broad market.
The Dow Jones Industrial Average finished the week down -157 points, a decline of ‑0.5%. The technology-heavy NASDAQ Composite ended the week down -0.3%, following three consecutive weeks of gains.
By market cap, the large cap S&P 500 ticked down -0.1%, while the mid cap S&P 400 and small cap Russell 2000 rose by 0.9% and 0.4%, respectively.
International Markets: 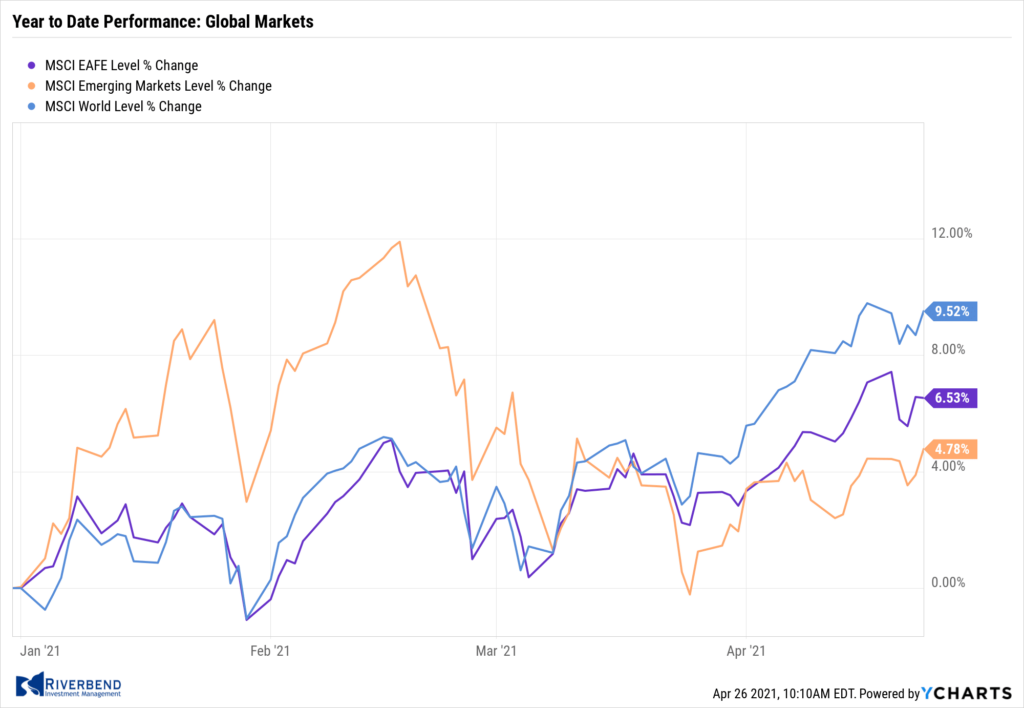
A majority of major international markets finished the week to the downside. Canada’s TSX declined ‑1.3%, while the United Kingdom’s FTSE 100 ended down -1.2%. On Europe’s mainland, France’s CAC 40 retreated -0.5%, while Germany’s DAX fell -1.2%.
In Asia, China’s Shanghai Composite rose 1.4%, but Japan’s Nikkei finished the week down -2.2% – its second consecutive decline.
As grouped by Morgan Stanley Capital International, developed markets finished down -0.3%, while emerging markets rose 0.5%.
Commodities: 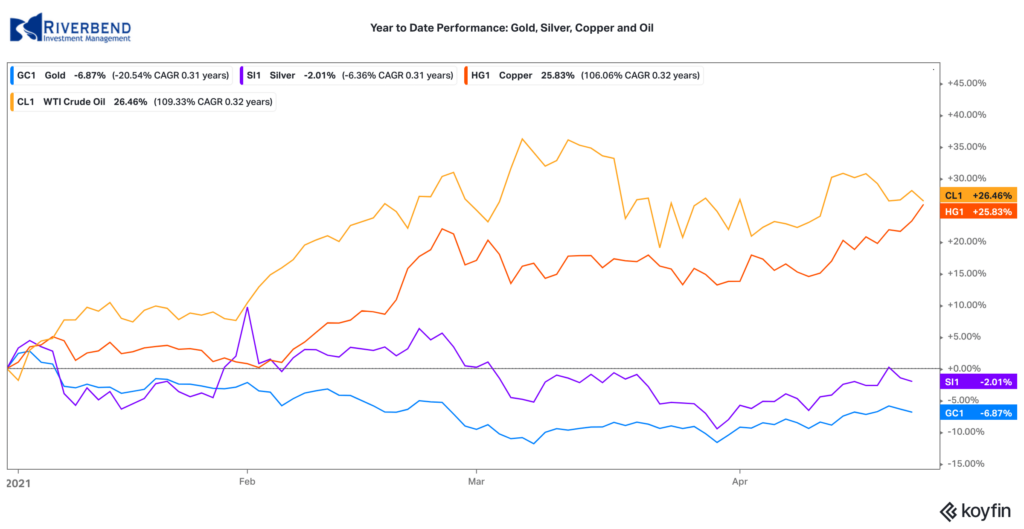
Gold ended the week down just -0.1%, finishing at $1777.80 per ounce, while Silver also declined ‑0.1% to $26.08.
Oil retraced some of last week’s advance. West Texas Intermediate crude oil declined -1.7% to $62.14 per barrel.
The industrial metal copper, viewed by some analysts as a barometer of world economic health due to its wide variety of uses, surged 4% this week.
U.S. Economic News: 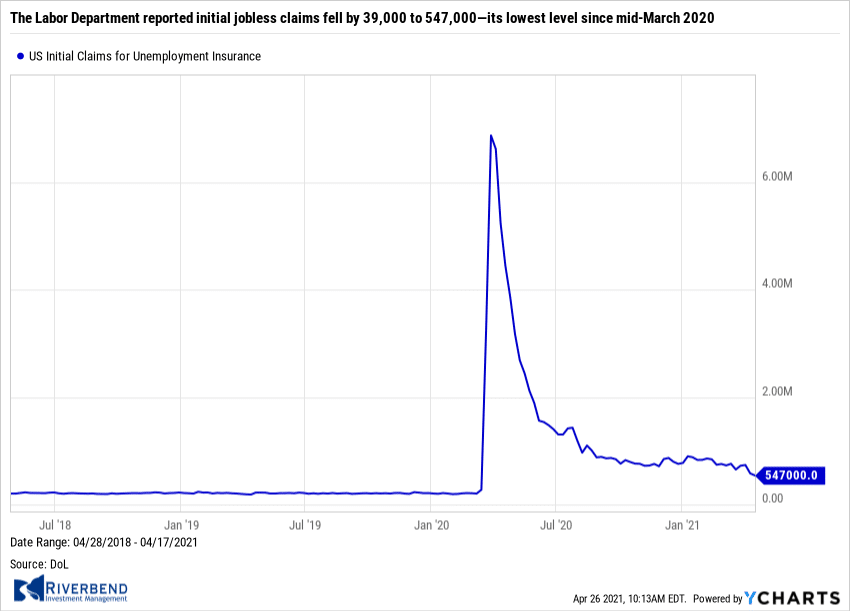
The number of Americans filing for first-time unemployment benefits fell again last week, the second consecutive significant decline. The Labor Department reported initial jobless claims fell by 39,000 to 547,000—its lowest level since mid-March 2020. Economists had expected 603,000 new claims. The four-week moving average for claims, which smooths out volatility, fell 27,750 to 651,000. That is also the lowest level since last March.
Declines in claims were widespread across the country with particularly sharp declines in Texas and New York. Continuing claims, which counts the number of Americans already receiving benefits, declined by 34,000 to a seasonally adjusted 3.67 million. That’s also the lowest level since last March.
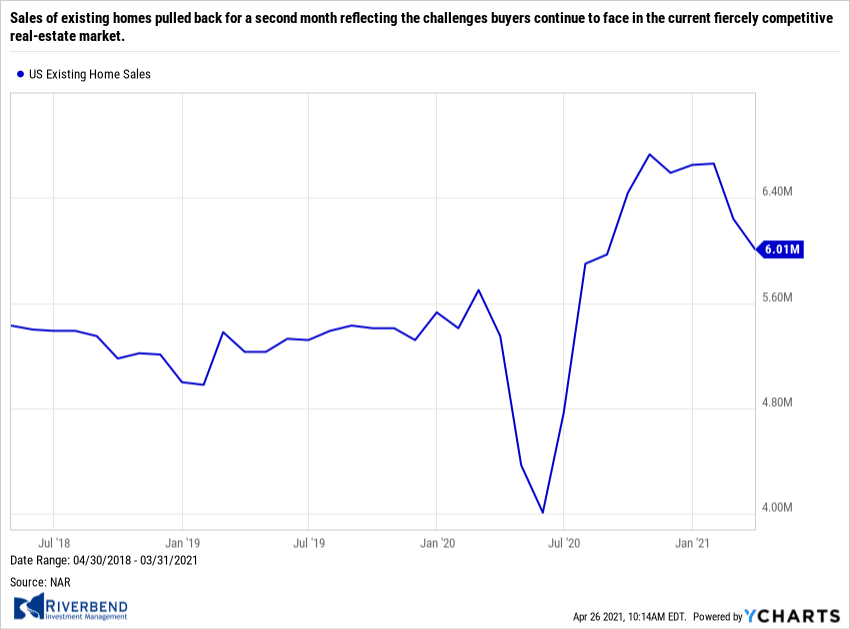 Sales of existing homes pulled back for a second month reflecting the challenges buyers continue to face in the current fiercely competitive real-estate market. The National Association of Realtors (NAR) reported existing home sales fell 3.7% in March to a seasonally-adjusted annual rate of 6.01 million. It was the lowest rate of home sales since August. Still, compared with the same time last year, home sales are up more than 12%.
Lawrence Yun, NAR chief economist, said in the report, “The sales for March would have been measurably higher, had there been more inventory. Without an increase in supply, the society wealth division will widen with homeowners enjoying sizable equity gains while renters will struggle to become homeowners.” Sales fell across every region, with the largest decline occurring in the West–where they dropped 8% since February. Currently, there’s a 2.1 month supply of homes on the market. A 6-month supply is generally considered a “balanced” housing market.
Sales of new homes surged past expectations as builders raced to meet demand. The Census Bureau reported new home sales occurred at a seasonally-adjusted annual rate of 1.021 million in March. It was the fastest pace of new home sales since 2006. Sales rose 20.7% from February, and compared with the same time last year sales have more than doubled. The median forecast had been for a sales rate of 888,000.
Sales rates increased in every part of the country, except the West where they fell 30%. The largest sales gain occurred in the South, with a 40% jump. Analysts don’t expect the shortage in housing to end anytime soon. Rubeela Farooqi, chief U.S. economist at High Frequency Economics wrote in a research note, “While mortgage rates are a significant factor for home purchases, the biggest issue currently seems to be inventories, and it will continue to be a headwind in the near term.”
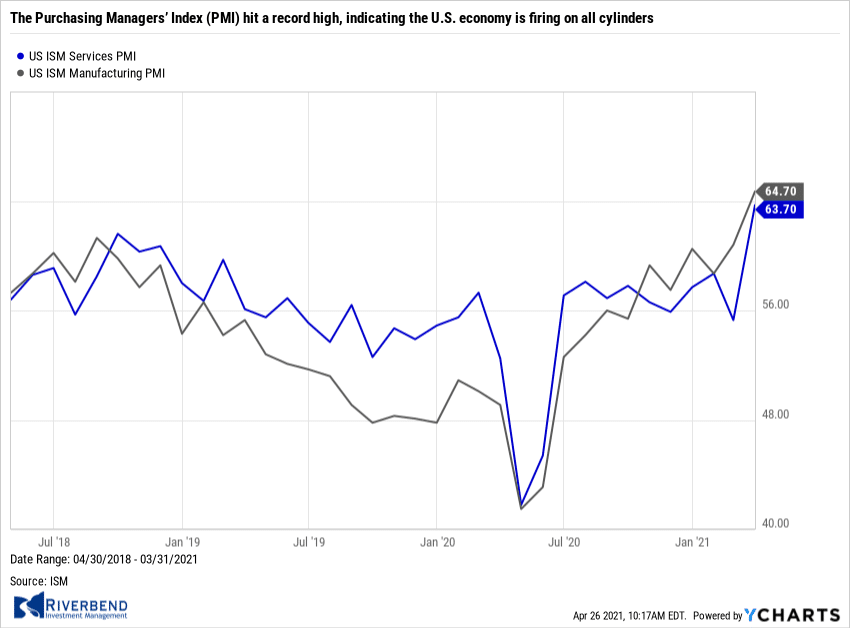 The “flash” U.S. Composite Purchasing Managers’ Index (PMI) hit a record high, indicating the U.S. economy is firing on all cylinders. Analytics firm IHS Markit reported its flash reading composite PMI rose to 62.2 in April from 59.7 in March. In the details, the services side of the PMI rose to a record 63.1 in April from 60.4 in March, while the manufacturing side hit a record 60.6, up from 59.1 the previous month.
Manufacturing output jumped, despite unprecedented supply chain disruptions, while service sector growth was driven by strong client demand and the reopening of core businesses. The flash estimate is typically based on approximately 85%–90% of total survey responses each month.
Chart of the Week: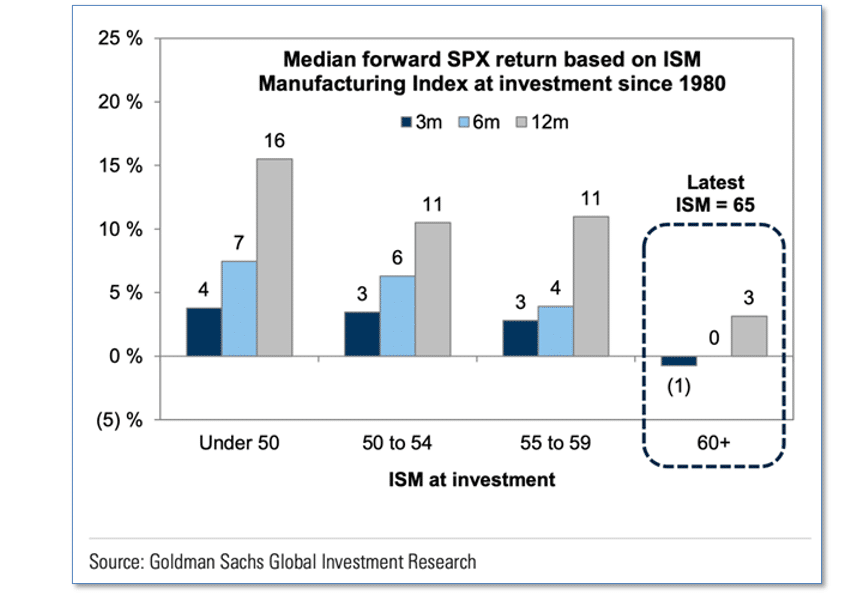
Strategists at Goldman Sachs recently noted that their economists expect U.S. GDP growth to remain above trend through the next few quarters; however, they caution that this will not necessarily translate to equally outsize gains in the stock market.
In the chart above, stock market gains for the following 3, 6 and 12 month periods are grouped by Institute for Supply Management (ISM) index values at the start of the periods.
What it shows clearly is that the best stock market gains come from good-but-not-spectacular ISM values, while the red-hot “greater than 60” ISM values are typically followed by low or even negative stock market returns.
The current ISM value is 65 – squarely in that red-hot category.
Riverbend Indicators:

Each week we post notable changes to the various market indicators we follow.
- As a reading of our Bull-Bear Indicator for U.S. Equities (comparative measurements over a rolling one-year timeframe), we remain in Cyclical Bull territory.
- Counting-up of the number of all our indicators that are ‘Up’ for U.S. Equities, the current tally is that three of four are Positive, representing a multitude of timeframes (two that can be solely days/weeks, or months+ at a time; another, a quarter at a time; and lastly, the {typically} years-long reading, that being the Cyclical Bull or Bear status).
The Week Ahead:
Monday:
- U.S. Durable Goods +2.3% exp, -1.2% prior
- Bank of Japan Statement
- Earnings: TSLA, NXPI
Tuesday:
- U.S. CB Consumer Confidence 112 exp, 109.7% prior
- Australia CPI 0.9% exp, 0.9% prior
- Earnings: MSFT, GOOG, V, LLY, TXN, UPS
Wednesday:
- FOMC Statement
- Canada Retail Sales N/A exp, -1.1%% prior
- OPEC-JMMC Meetings
- Earnings: AAPL, FB, SHOP
Thursday:
- U.S. Q1 GDP 6.6% exp, 4.3% prior
- U.S. Unemployment Claims 560k exp, 547k prior
- U.S. Pending Home Sales +4.6% exp, -10.6% prior
- China Manufacturing PMI 55.9 exp, 51.9 prior
- Earnings: AMZN, MA, MCD
Friday:
- Germany GDP -1.5% exp, +0.3% prior
- Canada GDP N/A exp, +0.7% prior
(Sources: All index- and returns-data from Yahoo Finance; news from Reuters, Barron’s, Wall St. Journal, Bloomberg.com, ft.com, guggenheimpartners.com, zerohedge.com, ritholtz.com, markit.com, financialpost.com, Eurostat, Statistics Canada, Yahoo! Finance, stocksandnews.com, marketwatch.com, wantchinatimes.com, BBC, 361capital.com, pensionpartners.com, cnbc.com, FactSet.)
[/fusion_text][/fusion_builder_column][fusion_builder_column type=”1_6″ layout=”1_6″ spacing=”” center_content=”no” link=”” target=”_self” min_height=”” hide_on_mobile=”small-visibility,medium-visibility,large-visibility” class=”” id=”” hover_type=”none” border_size=”0″ border_color=”” border_style=”solid” border_position=”all” border_radius=”” box_shadow=”no” dimension_box_shadow=”” box_shadow_blur=”0″ box_shadow_spread=”0″ box_shadow_color=”” box_shadow_style=”” padding_top=”” padding_right=”” padding_bottom=”” padding_left=”” margin_top=”” margin_bottom=”” background_type=”single” gradient_start_color=”” gradient_end_color=”” gradient_start_position=”0″ gradient_end_position=”100″ gradient_type=”linear” radial_direction=”center” linear_angle=”180″ background_color=”” background_image=”” background_image_id=”” background_position=”left top” background_repeat=”no-repeat” background_blend_mode=”none” animation_type=”” animation_direction=”left” animation_speed=”0.3″ animation_offset=”” filter_type=”regular” filter_hue=”0″ filter_saturation=”100″ filter_brightness=”100″ filter_contrast=”100″ filter_invert=”0″ filter_sepia=”0″ filter_opacity=”100″ filter_blur=”0″ filter_hue_hover=”0″ filter_saturation_hover=”100″ filter_brightness_hover=”100″ filter_contrast_hover=”100″ filter_invert_hover=”0″ filter_sepia_hover=”0″ filter_opacity_hover=”100″ filter_blur_hover=”0″ last=”no”][/fusion_builder_column][/fusion_builder_row][/fusion_builder_container]


