U.S. Markets: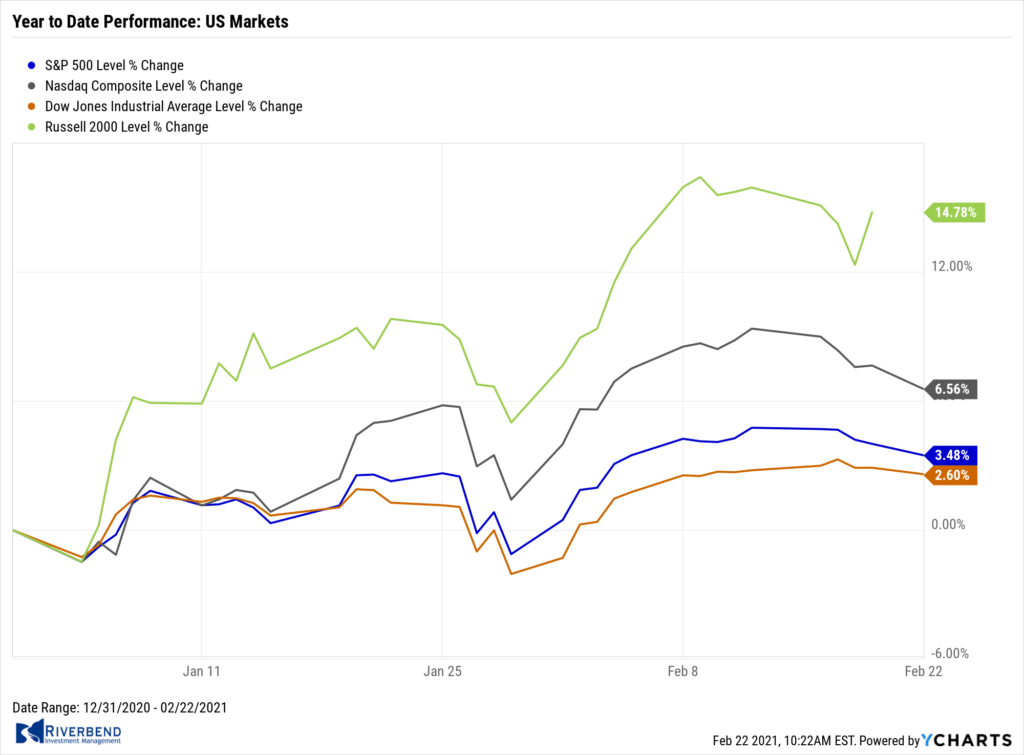
The major U.S. indexes finished the week mostly to the downside with the large-cap benchmarks and technology-heavy NASDAQ Composite index hitting record intraday highs before falling back.
The Dow Jones Industrial Average ticked up 0.1% to 31,494, its third consecutive week of gains. The NASDAQ reversed most of last week’s gain finishing down -1.6%.
By market cap, the large cap S&P 500 gave up -0.7%, while the mid cap S&P 400 and small cap Russell 2000 retreated -0.4% and -1.0%, respectively.
International Markets: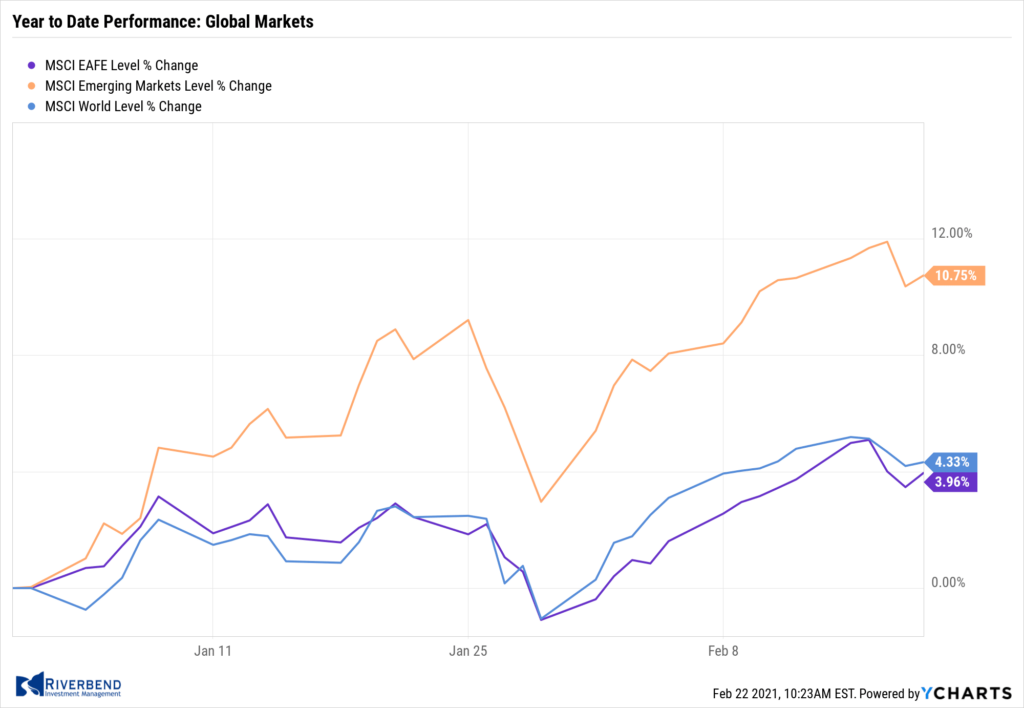
International markets were mixed on the week. Canada’s TSX retreated -0.4%, while the United Kingdom’s FTSE 100 added 0.5%.
On Europe’s mainland, France’s CAC 40 and Germany’s DAX finished mixed with the CAC rising 1.2%, while the DAX declined -0.4%.
Markets finished the week in the green in Asia. China’s Shanghai Composite rose 1.1%, while Japan’s Nikkei added 1.7%.
As grouped by Morgan Stanley Capital International, developed markets ticked down -0.1%, while emerging markets fell a steeper -0.5%.
Commodities: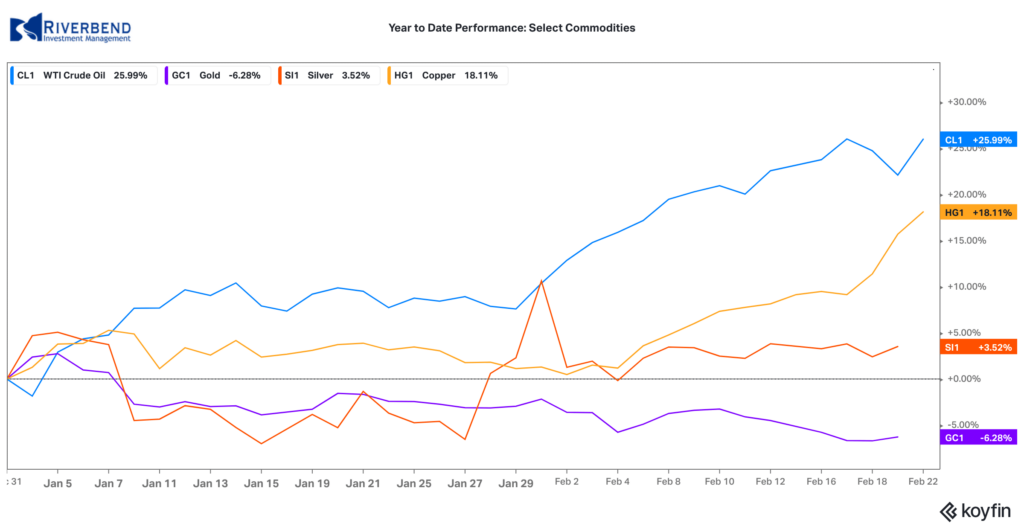
Precious metals finished the week to the downside. Gold fell by $45.80 to $1777.40 an ounce, a decline of -2.5%. Silver closed down -0.3% to $27.25 per ounce.
Following two weeks of strong gains, energy ended the week lower. West Texas Intermediate crude oil declined -0.4% to $59.26 per barrel.
Copper, viewed by some analysts as a barometer of world economic health due to its wide variety of industrial uses, surged over 7.5% last week.
U.S. Economic News: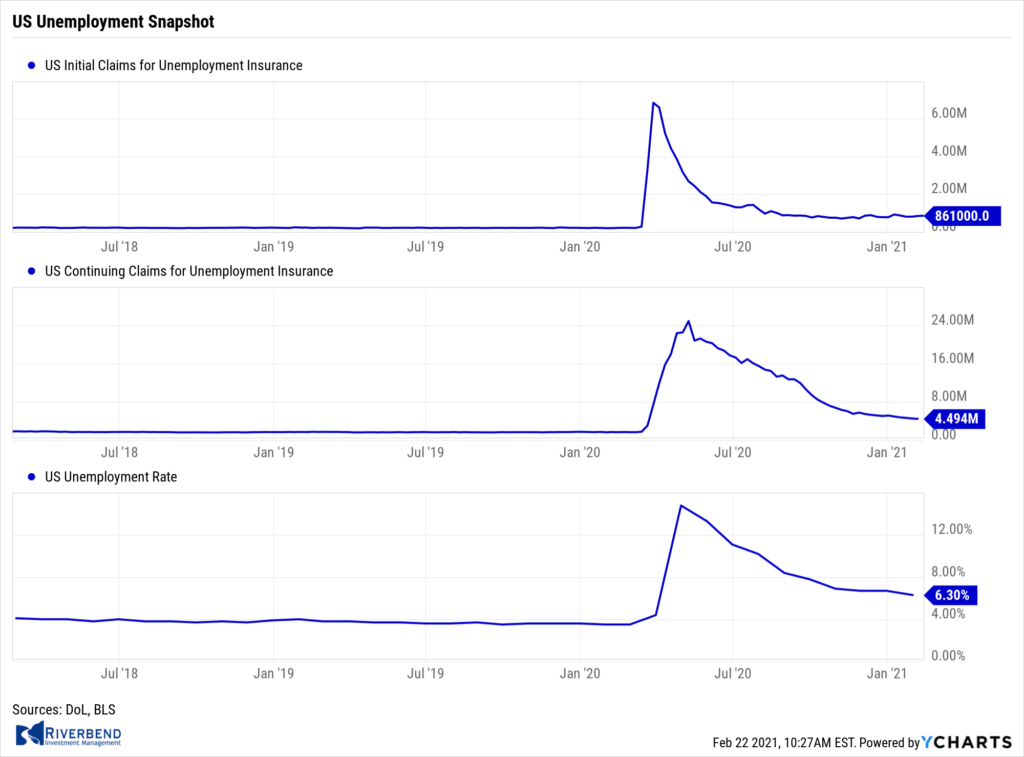
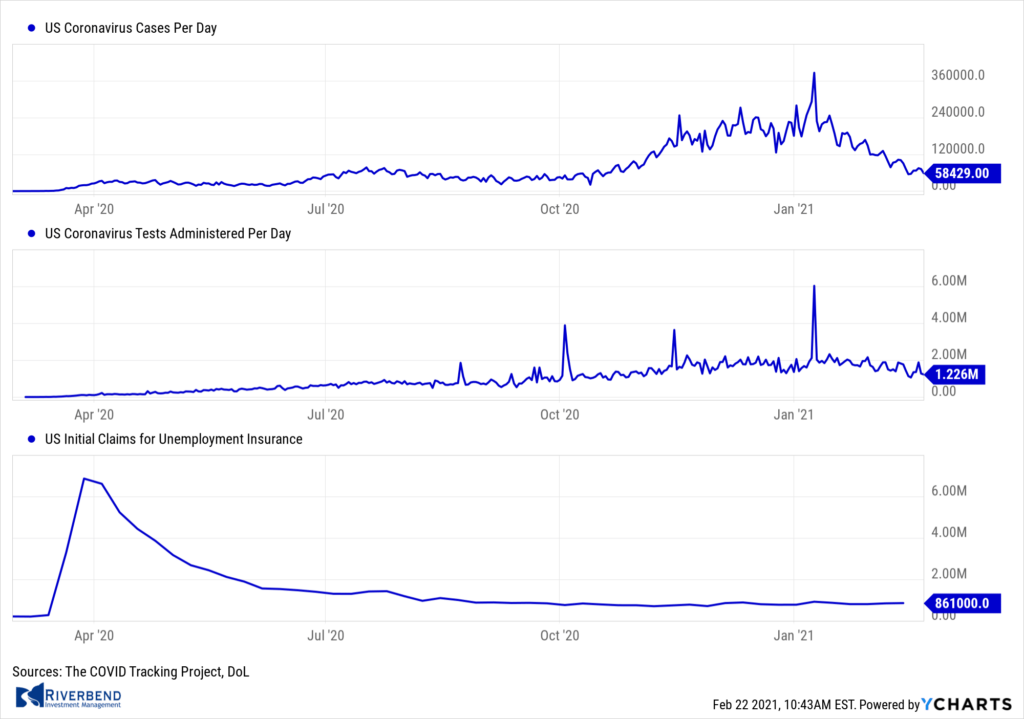
The number of Americans claiming first-time unemployment benefits rose last week to a four-week high, as Americans continue losing their jobs nearly a year after the onset of the coronavirus pandemic. The Labor Department reported initial jobless claims rose by 13,000 to 861,000. Economists had expected new claims would fall to 770,000.
New applications for jobless benefits rose the most in Illinois, California and Virginia, while the biggest declines took place in Texas and Georgia. Continuing claims, which counts the number of people already collecting traditional unemployment benefits, fell by 64,000 to a seasonally adjusted 4.49 million.
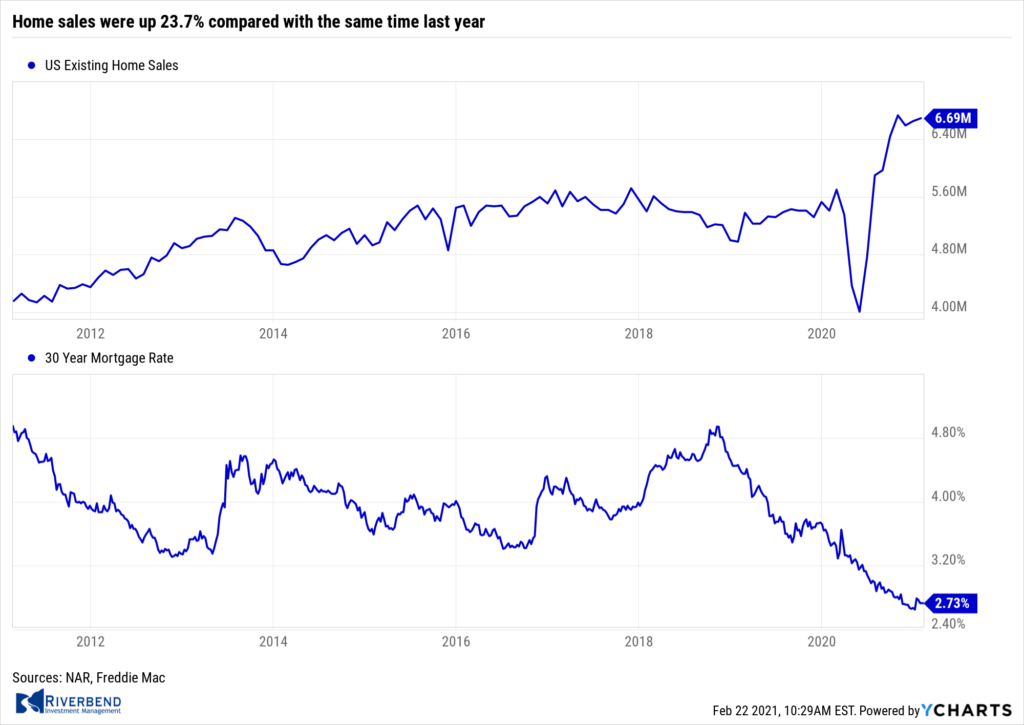 Sales of existing homes ticked up 0.6% to a seasonally-adjusted annual rate of 6.69 million, the National Association of Realtors (NAR) reported. Home sales were up 23.7% compared with the same time last year. The median existing-home price rose to $303,900, a 14.1% increase from a year ago. Furthermore, the inventory of homes for sale fell to record low of just 1.04 million units—that’s a 25.7 decline from the same time last year. Overall, the market now has just a 1.9 month supply of homes for sale. Economists generally consider a 6-month supply a balanced housing market.
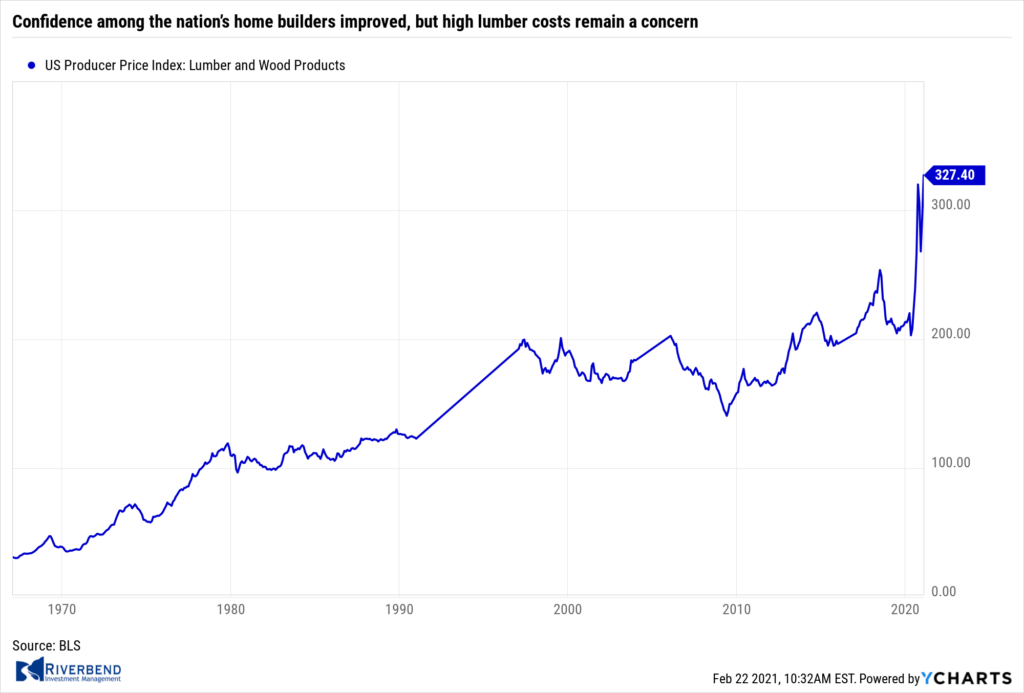 Confidence among the nation’s home builders improved, but high construction costs remain a concern. The National Association of Home Builders’ (NAHB) reported its monthly confidence index rose one point to 84 in February as foot traffic from home buyers improved. The modest increase comes following two consecutive months of declines. In the details, the index that measures sentiment of prospective buyers increased four points to 72.
Despite high demand, the NAHB voiced its concern over rising costs of building materials. Chuck Fowke, current chairman of the National Association of Home Builders stated, “Lumber prices have been steadily rising this year and hit a record high in mid-February, adding thousands of dollars to the cost of a new home and causing some builders to abruptly halt projects at a time when inventories are already at all-time lows.”
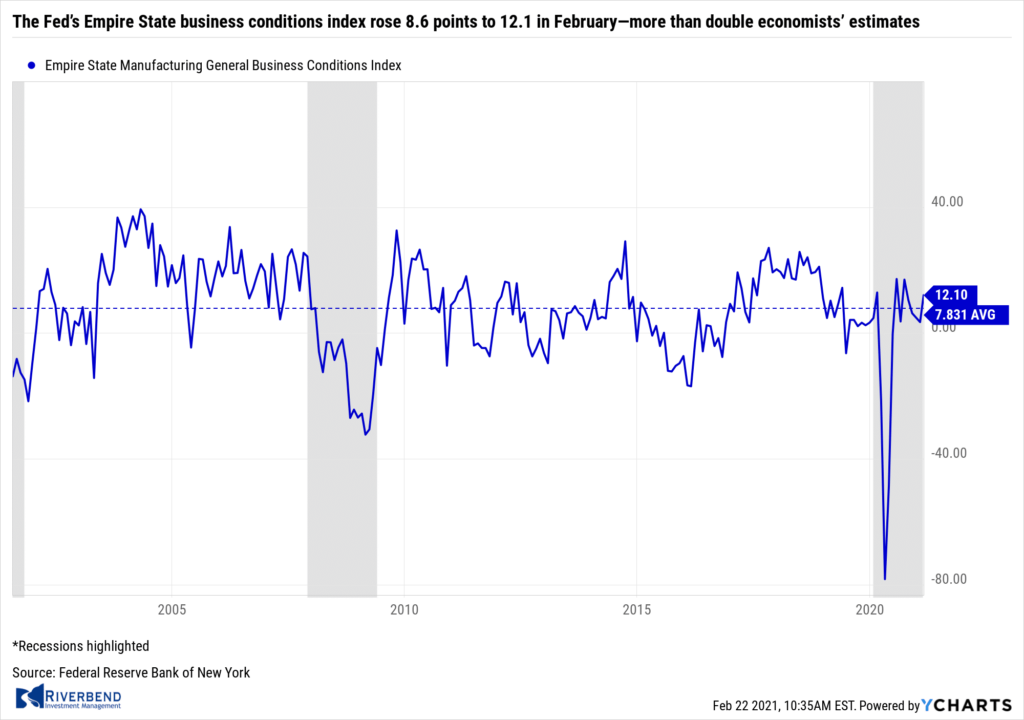 Manufacturing activity in the New York-region hit its highest level in seven months according to the latest report from the New York Fed. The Fed’s Empire State business conditions index rose 8.6 points to 12.1 in February—more than double economists’ estimates. Economists had expected a reading of just 5.9.
In the report, the new orders index rose 4.2 points to 10.8, while shipments fell 3.3 points to 4. Notably, prices paid for goods jumped 12.3 points to 57.8 – the highest level since 2011. Manufacturers’ expectations for business conditions in the next six months rose 3 points to 34.9.
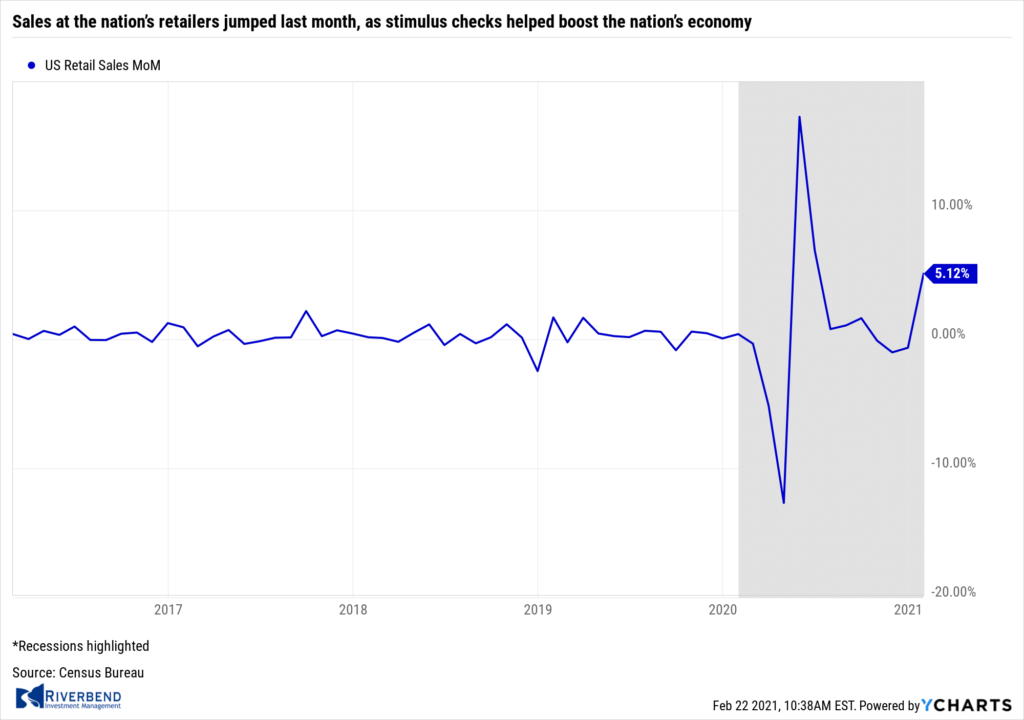 Sales at the nation’s retailers jumped last month, as stimulus checks helped boost the nation’s economy. The Census Bureau reported retail sales surged 5.1% in January, its first increase in four months and the largest increase in eight months. Economists had expected just a 1% increase.
In the details, sales were strong in every category. Department store chains, Internet retailers, electronic stores and home-furnishing outlets all recorded double digit percentage gains. Bars and restaurants also registered a nearly 7% increase in sales after receipts had fallen three months in a row. The increase in spending was fueled in part by $600 stimulus checks sent to millions of Americans and more generous unemployment benefits. Economist Katherine Judge of CIBC Economics wrote in a note, “With additional fiscal stimulus on the way, new Covid cases trending lower, and many states moving to relax social distancing measures, the worst looks to be in the rear view mirror.”
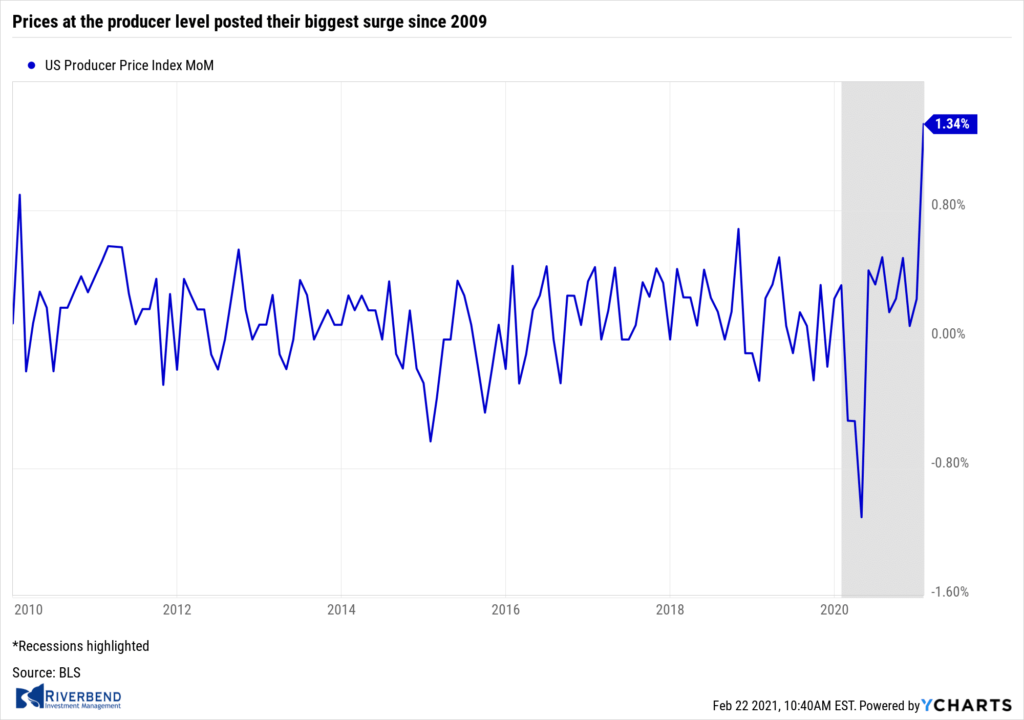 Prices at the producer level posted their biggest surge since 2009, but some analysts stated it is unlikely to be sustained. The Labor Department reported the Producer Price Index jumped 1.3% last month. Economists had forecast a 0.5% gain. Over the past 12 months, the rate of wholesale inflation climbed to 1.7 in January, from just 0.8% at the end of 2020.
Most of the increase in wholesale prices last month was tied to higher costs of gasoline, health care and financial services. Energy prices have risen in the past several months as more people have resumed traveling, the weather has turned colder, and supplies have tightened. The core rate of wholesale inflation, which strips out the often-volatile food and energy categories, also surged by 1.3%. The increase in the core rate over the past 12 months nearly doubled in January to 2% from 1.1% in December and is now above pre-pandemic levels.
 In Fed news, minutes of the January meeting of the Federal Reserve showed officials were more optimistic about the long-term health of the economy. The voting members of the Fed’s interest-rate committee agreed that expected progress on vaccinations and the change in the outlook for fiscal policy had improved the longer-run prospects for the economy so much that officials “decided that the reference in previous post-meeting statements to risks to the economic outlook over the medium term was no longer warranted,” according to the minutes. Notably, Fed officials were seemingly not concerned about inflation, with “most” officials saying that inflation risks were weighted towards too low rather than too high.
Chart of the Week:
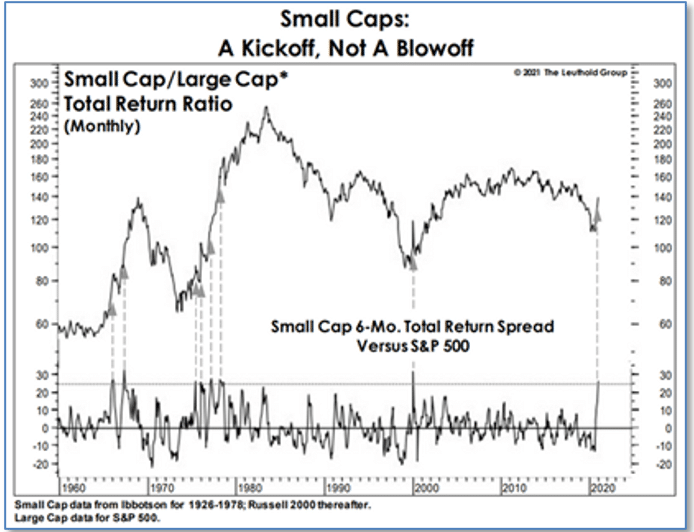
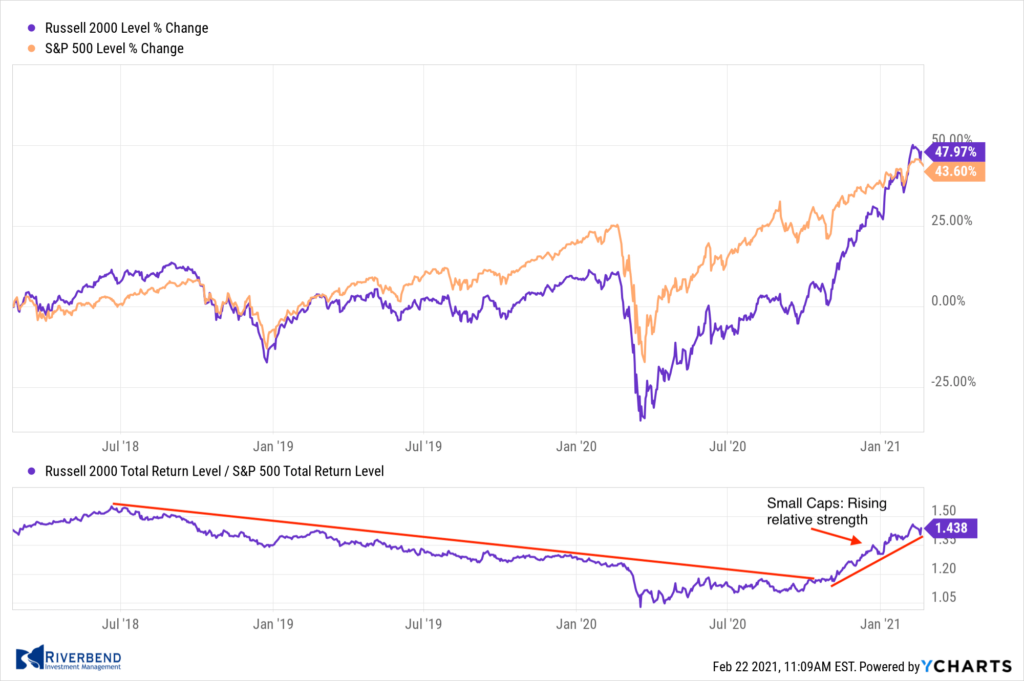
For the past several months, small-caps have greatly outperformed large-caps. Many observers have derided it as a “blow off” of excess that will soon reverse, but researchers at the Leuthold Group disagree.
Instead, they point out that similar periods of “extreme strength” have kicked off periods of multi-year leadership by small-caps.
The chart above, from The Leuthold Group, shows that in every one of the 7 prior instances of a 25% total-return differential between the 6‑month returns of the Russell 2000 small-cap index and the S&P 500 large-cap index, the dominance of the small-caps continued for another 2 to 10 years.
Thus, they argue that the surge in small-caps is more likely to be a “Kickoff” than a “Blow off” — which is similar to what happened during the early 2000s.
Riverbend Indicators Update:

Each week we post notable changes to the various market indicators we follow.
- As a reading of our Bull-Bear Indicator for U.S. Equities (comparative measurements over a rolling one-year timeframe), we remain in Cyclical Bull territory.
- Counting-up of the number of all our indicators that are ‘Up’ for U.S. Equities, the current tally is that four of four are Positive, representing a multitude of timeframes (two that can be solely days/weeks, or months+ at a time; another, a quarter at a time; and lastly, the {typically} years-long reading, that being the Cyclical Bull or Bear status).
Observations:
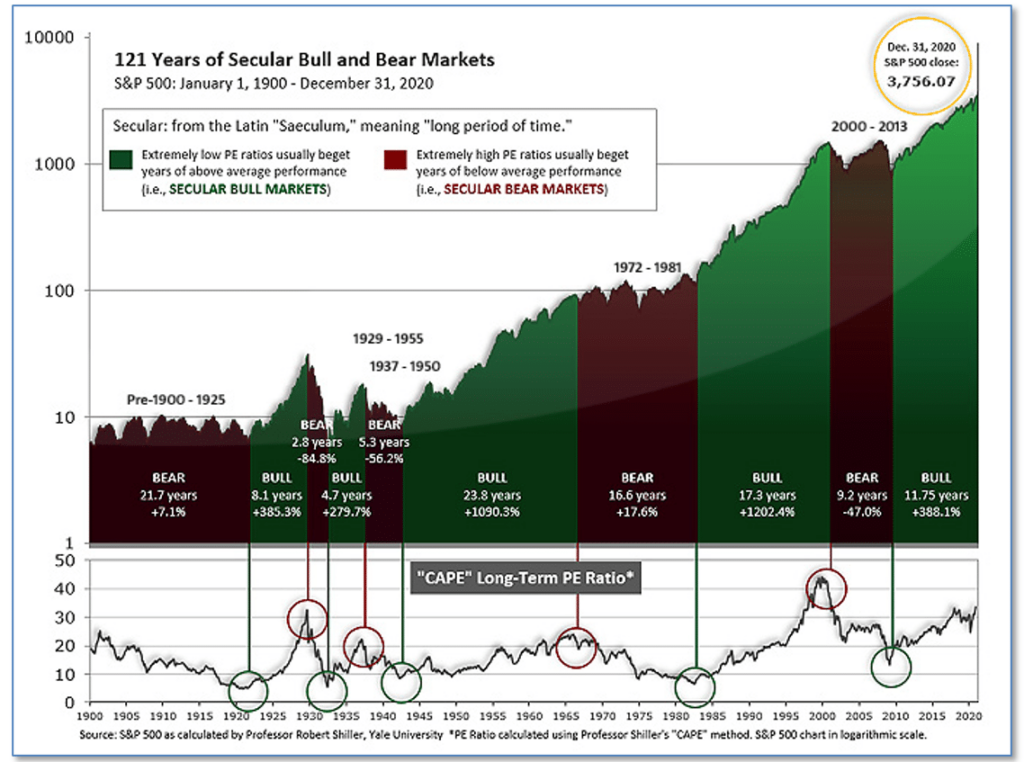
Once a month, I like to take a look at the CAPE figures. For those unfamiliar with CAPE (Cyclically Adjusted Price to Earnings ratio), it’s a long-term valuation of the market, created by Yale economist Robert Shiller.
The CAPE smooths-out shorter-term earnings swings in order to get a longer-term assessment of market valuations. A CAPE level of 30 is considered to be the upper end of the normal range and the level at which further PE-ratio expansion comes to a halt.
Of course, a “mania” could come along and drive prices higher – much higher, even – and for some years to come. Manias occur when valuation no longer seems to matter, and caution is thrown completely to the wind – as buyers rush in to buy first, and ask questions later.
Two manias in the last century – the “Roaring Twenties” of the 1920s, and the “Tech Bubble” of the late 1990s – show that the sky is the limit when common sense is overcome by a blind desire to buy. But, of course, the piper must be paid, and the following decade or two were spent in Secular Bear Markets, giving most or all of the mania gains back.
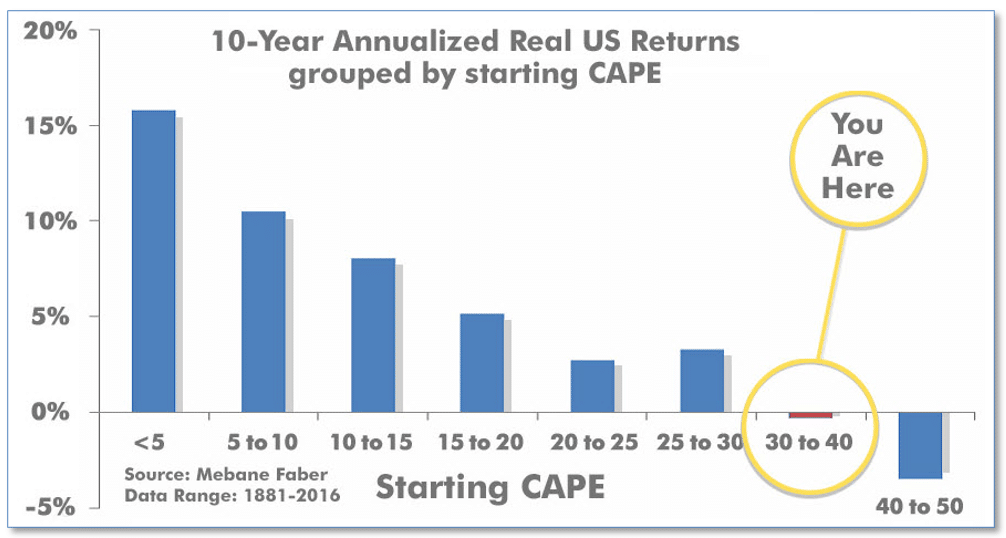
The CAPE is now at 35.58 — since 1881, the average annual return for all ten-year periods that began with a CAPE in the 30-40 range has been slightly negative:
So what does this all mean for investors?
If we take a look at past bear market cycles, the CAPE ratio was much lower. This eventually led to an expansion of PE values as the markets pushed higher into a newly formed bull market.
Last year’s pullback, due to COVID, didn’t leave us with the low CAPE values that one would expect. (Partially thanks to a very aggressive Fed). In fact, CAPE values were at levels higher than that of past bull market cycles at their peak:
Without a “mania”, investors using a buy and hold style of investing, may be facing a decade – or longer – of disappointment.
I continue to believe an active management style of investing that rotates into the stronger growing areas of the market will benefit investors during this cycle.
Year to date, we are seeing this style of investment management benefit our models. Relative strength has been increasing within the small and mid-cap areas of the market:
As a result of this, our client accounts have been overweight the small and mid-caps areas of the market for the first time in years. Going forward, I will be keeping a close eye on this relationship and continue to manage risk accordingly.
Note: We do not use CAPE as an official input into our methods. However, if history is any guide – and history is typically some kind of guide – it’s always good to simply know where we are compared to historical market cycles. This can give us insight into what may lay ahead for the markets and how to best craft investment strategies to take advantage of trends that may be present during the market cycle.
The Week Ahead:
Monday:
- German ifo Business Climate 90.5 exp, 90.1 prior
Tuesday:
- U.S. S&P/CS Composite-20 HPI y/y 9.1% prior
- U.S. CB Consumer Confidence 90.2 exp, 89.3 prior
- U.S. Richmond Fed Manufacturing Index 17 exp, 14 prior
- Fed Chair Powell Testifies
Wednesday:
- U.S. New Home Sales 859k exp, 842k prior
- Fed Chair Powell Testifies (Day 2)
Thursday:
- U.S. Prelim GDP q/q +4.1% exp, +4.0% prior
- U.S. Durable Goods orders m/m +1.3% exp, +0.5% prior
- U.S. Unemployment Claims N/A exp, 861k prior
- U.S. Pending Home Sales m/m +0.2% exp, -0.3% prior
Friday:
- U.S. Personal Income m/m +10.0% exp, +0.6% prior
- U.S. Personal Spending m/m +0.7% exp, -0.2% prior
- U.S. Chicago PMI 61.0 exp, 63.8 prior
(Sources: All index- and returns-data from Yahoo Finance; news from Reuters, Barron’s, Wall St. Journal, Bloomberg.com, ft.com, guggenheimpartners.com, zerohedge.com, ritholtz.com, markit.com, financialpost.com, Eurostat, Statistics Canada, Yahoo! Finance, stocksandnews.com, marketwatch.com, wantchinatimes.com, BBC, 361capital.com, pensionpartners.com, cnbc.com, CNBC, FactSet.)


