[fusion_builder_container hundred_percent=”no” equal_height_columns=”no” menu_anchor=”” hide_on_mobile=”small-visibility,medium-visibility,large-visibility” class=”” id=”” background_color=”” background_image=”” background_position=”center center” background_repeat=”no-repeat” fade=”no” background_parallax=”none” parallax_speed=”0.3″ video_mp4=”” video_webm=”” video_ogv=”” video_url=”” video_aspect_ratio=”16:9″ video_loop=”yes” video_mute=”yes” overlay_color=”” video_preview_image=”” border_size=”” border_color=”” border_style=”solid” padding_top=”” padding_bottom=”” padding_left=”” padding_right=””][fusion_builder_row][fusion_builder_column type=”1_6″ spacing=”” center_content=”no” link=”” target=”_self” min_height=”” hide_on_mobile=”small-visibility,medium-visibility,large-visibility” class=”” id=”” hover_type=”none” border_size=”0″ border_color=”” border_style=”solid” border_position=”all” box_shadow=”no” box_shadow_blur=”0″ box_shadow_spread=”0″ box_shadow_color=”” box_shadow_style=”” background_type=”single” gradient_start_position=”0″ gradient_end_position=”100″ gradient_type=”linear” radial_direction=”center” linear_angle=”180″ background_color=”” background_image=”” background_image_id=”” background_position=”left top” background_repeat=”no-repeat” background_blend_mode=”none” animation_type=”” animation_direction=”left” animation_speed=”0.3″ animation_offset=”” filter_type=”regular” filter_hue=”0″ filter_saturation=”100″ filter_brightness=”100″ filter_contrast=”100″ filter_invert=”0″ filter_sepia=”0″ filter_opacity=”100″ filter_blur=”0″ filter_hue_hover=”0″ filter_saturation_hover=”100″ filter_brightness_hover=”100″ filter_contrast_hover=”100″ filter_invert_hover=”0″ filter_sepia_hover=”0″ filter_opacity_hover=”100″ filter_blur_hover=”0″ last=”no”][/fusion_builder_column][fusion_builder_column type=”2_3″ layout=”1_1″ background_position=”left top” background_color=”” border_size=”” border_color=”” border_style=”solid” border_position=”all” spacing=”yes” background_image=”” background_repeat=”no-repeat” padding_top=”” padding_right=”” padding_bottom=”” padding_left=”” margin_top=”0px” margin_bottom=”0px” class=”” id=”” animation_type=”” animation_speed=”0.3″ animation_direction=”left” hide_on_mobile=”small-visibility,medium-visibility,large-visibility” center_content=”no” last=”no” min_height=”” hover_type=”none” link=””][fusion_text]
[/fusion_text][fusion_vimeo id=”551552425″ alignment=”center” width=”1000″ height=”” autoplay=”false” api_params=”” hide_on_mobile=”small-visibility,medium-visibility,large-visibility” class=”” css_id=”” /][fusion_text]
U.S. Markets: 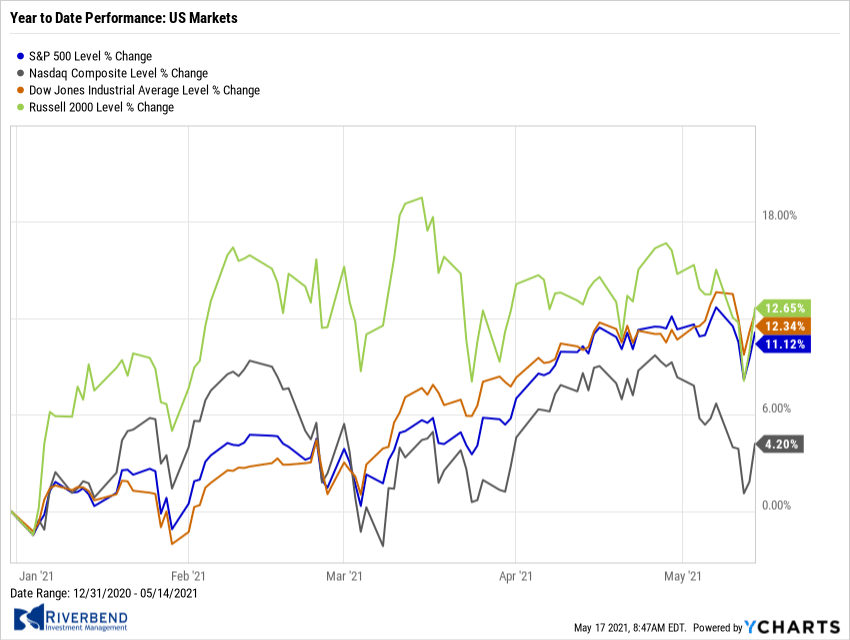
U.S. stocks fell further from record highs as investors confronted clear signs of higher inflation, but a rally late in the week lessened the week’s declines.
The Dow Jones Industrial Average retraced some of last week’s gain shedding -1.1% to 34,482. The technology-heavy NASDAQ Composite had its fourth consecutive week of declines, falling -2.3%.
By market cap, the large cap S&P 500 retreated -1.4%, while the mid cap S&P 400 and small cap Russell 2000 finished the week down -1.7% and -2.1%, respectively.
Within each market cap grouping, the “Value” group performed considerably better than the “Growth” group.
International Markets:
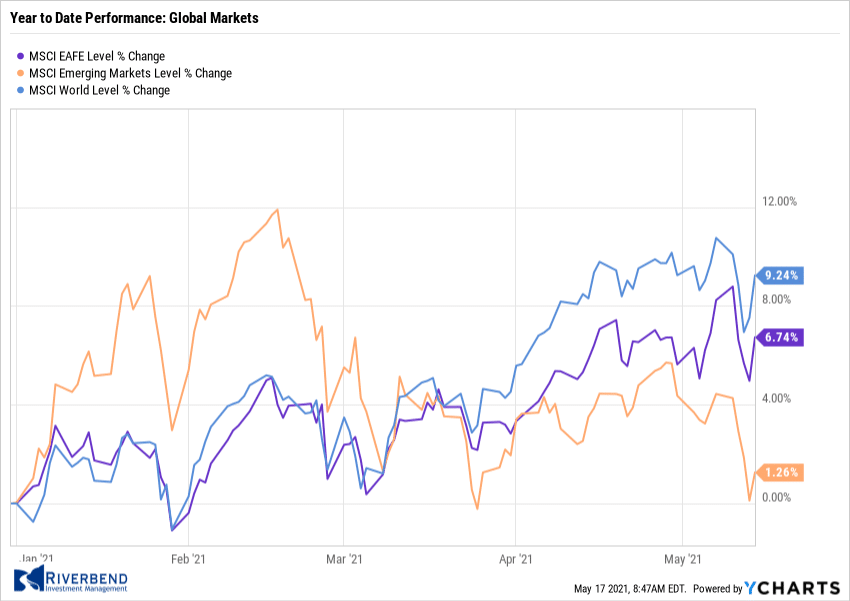
Canada’s TSX declined -0.5%, while the United Kingdom’s FTSE 100 gave up -1.2%.
On Europe’s mainland, France’s CAC 40 finished the week unchanged, while Germany’s DAX added 0.1%.
In Asia, China’s Shanghai Composite rose 2.1% while Japan’s Nikkei dropped a sharp -4.3%.
As grouped by Morgan Stanley Capital International, developed markets declined -1.1% and emerging markets retreated -3.2%.
Commodities: 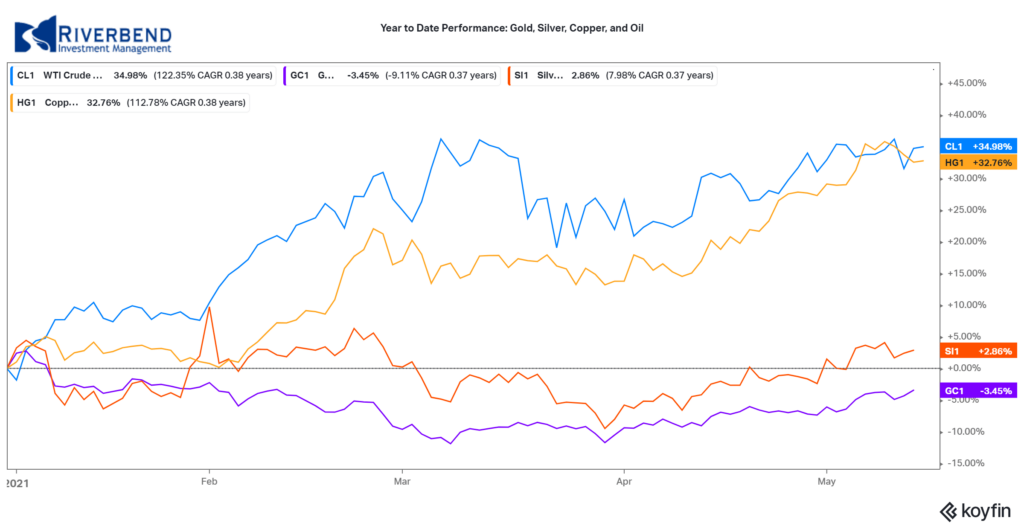
Precious metals finished the week mixed. Gold rose 0.4% to $1838.10 per ounce, while Silver declined -0.4% to $27.36.
Crude oil rose for a third consecutive week. West Texas Intermediate crude finished the week up 0.7% to $65.37 per barrel.
The industrial metal copper, viewed by some analysts as a barometer of world economic health due to its wide variety of uses, finished the week down -1.98% after five consecutive weeks of gains.
U.S. Economic News: 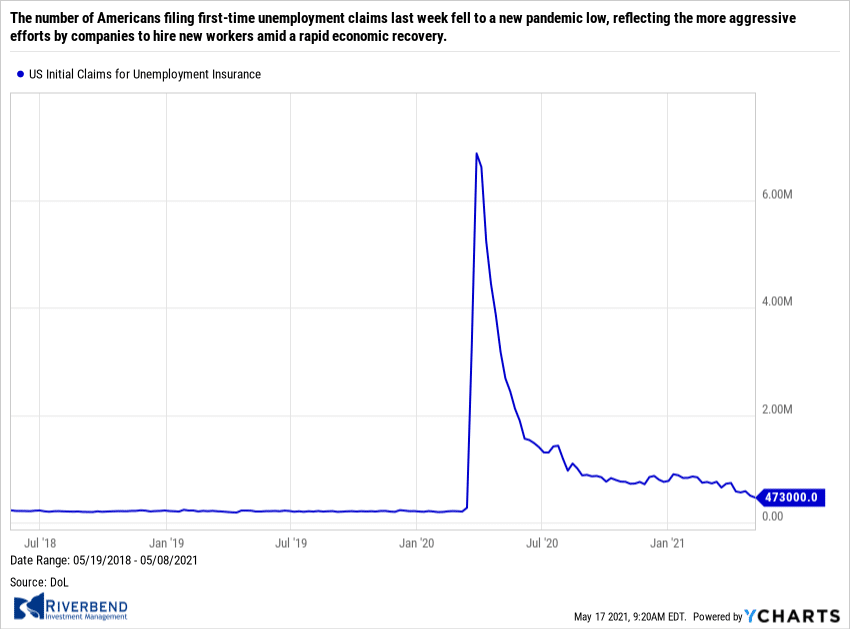
The number of Americans filing first-time unemployment claims last week fell to a new pandemic low, reflecting the more aggressive efforts by companies to hire new workers amid a rapid economic recovery. The Labor Department reported initial jobless claims dropped by 34,000 to 473,000 last week. It was the fifth decline in a row. Economists had forecast new claims would total a seasonally-adjusted 500,000.
Businesses are hiring more people as the economy moves toward a full re-opening and consumers venturing back out to shop and dine. New applications for jobless benefits fell the most in Michigan, New York, Florida and Vermont. The only states to post a notable increase in new claims were Georgia and Washington.
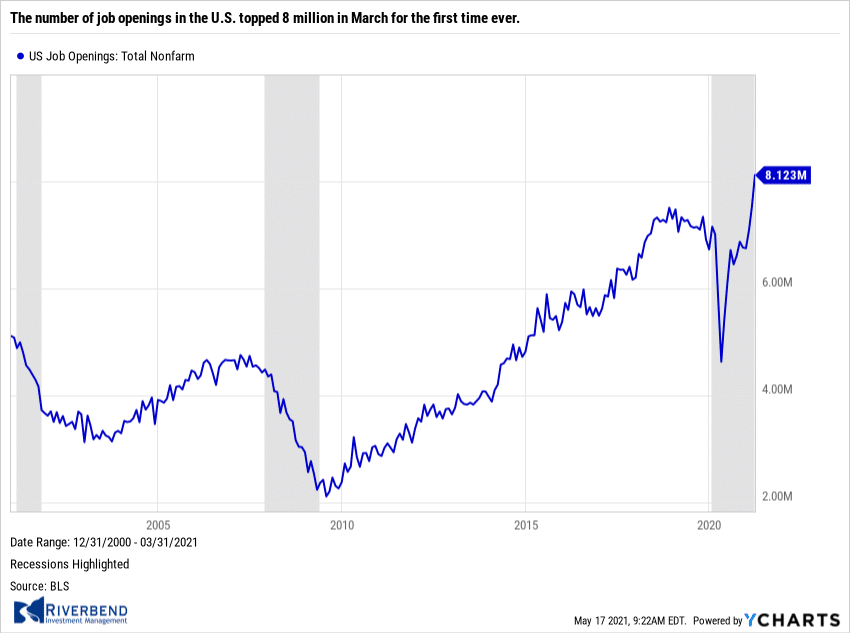
The number of job openings in the U.S. topped 8 million in March for the first time ever, the Labor Department reported. The number of job openings is now well above pre-pandemic levels and easily exceeds the all-time peak of 7.57 million set in November 2018. They had fallen to as low as 4.6 million last year in the early stages of the pandemic.
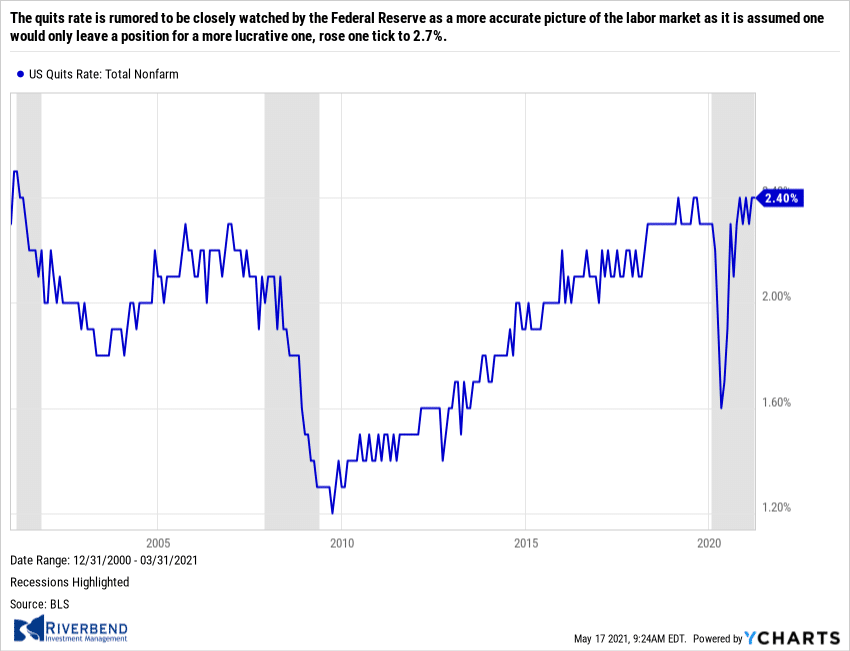
Job openings rose the most in March at restaurants and hotels, two of the industries deeply damaged by the pandemic. Job openings in the sector increased by 185,000 to 993,000—the second highest level ever. Meanwhile, the “quits rate” rose one tick to 2.7%, matching a 20-year high. The quits rate is rumored to be closely watched by the Federal Reserve as a more accurate picture of the labor market as it is assumed one would only leave a position for a more lucrative one, rose one tick to 2.7%.
A record number of small business owners reported they were unable to fill open jobs last month, adding to the controversy over whether enhanced unemployment benefits are encouraging scores of people to remain out of the labor force. The National Federation of Independent Business (NFIB) reported 44% of small businesses said job openings went unfilled in April.
The NFIB is the nation’s largest small-business lobbying group. NFIB chief economist Bill Dunkelberg stated, “Small-business owners are seeing a growth in sales but are stunted by not having enough workers. Finding qualified employees remains the biggest challenge for small businesses and is slowing economic growth.” After the disappointing jobs report, the U.S. Chamber of Commerce called on Washington to end a temporary $300 federal stipend that’s not set to expire until September. About one in four unemployed workers earns more from government benefits than they would from their prior job, according to the Chamber.
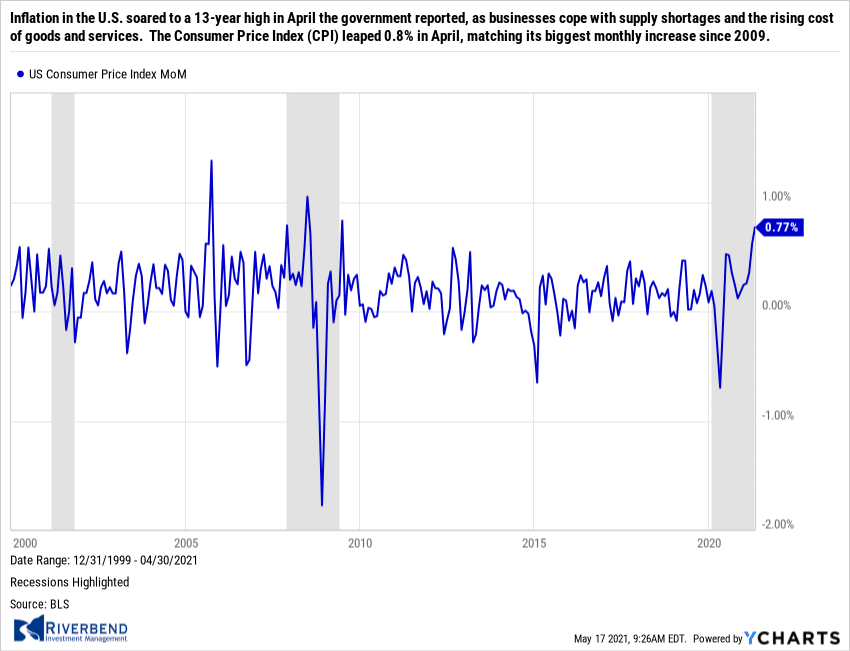
Inflation in the U.S. soared to a 13-year high in April the government reported, as businesses cope with supply shortages and the rising cost of goods and services. The Consumer Price Index (CPI) leaped 0.8% in April, matching its biggest monthly increase since 2009. Economists had been expecting just a 0.2% advance. The rate of inflation over the past year jumped to 4.2% from 2.6%–the highest level since 2008. The pace of inflation surged after years of being range-bound, largely due to the rapid reopening of the U.S. economy.
Senior Federal Reserve officials insist the increase is temporary, contending that inflation will subside by next year once the pandemic fades. Meanwhile, core CPI, which excludes the often-volatile food and energy categories, rose an even bigger 0.9%. That pushed the annual core inflation rate up to 3% from 1.6%–the highest level in 26 years.
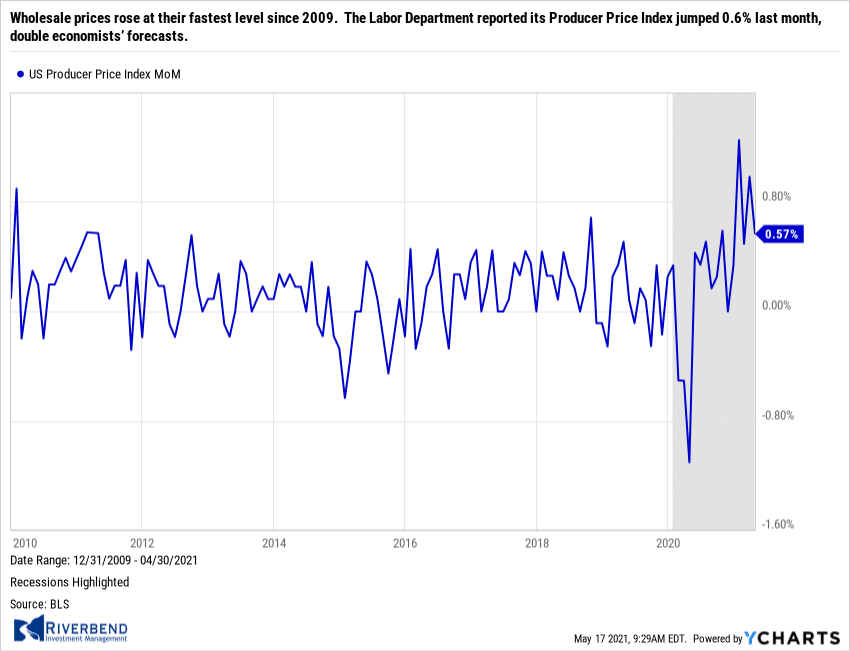
Wholesale prices rose at their fastest level since 2009. The Labor Department reported its Producer Price Index jumped 0.6% last month, double economists’ forecasts. Furthermore, the rate of wholesale inflation over the last 12 months climbed to 6.2% from 4.2% in the prior month. The current reading is at its highest level since the index was reformulated in 2009. Back then a record spike in the price of oil drove most of the increases in wholesale prices. Now the costs of a broad range of raw and partly finished goods are rising, ranging from farm produce to computer chips.
About two-thirds of the increase in wholesale prices last month was concentrated in services such as air travel, medical care, financial advice, retailing and transportation. The core rate of wholesale inflation, meanwhile, also rose by 0.7% last month. The core rate is a less volatile measure that strips out food, energy and trade margins. The increase in the core rate over the past 12 months moved to 4.6% from 3.1%. That’s the biggest gain since the government first began calculating the rate in 2014. Senior economist Jennifer Lee of BMO Capital Markets wrote in a note to clients, “There is only so much that producers can absorb before they begin to share the pain with the consumer level and that has already begun.”
Chart of the Week: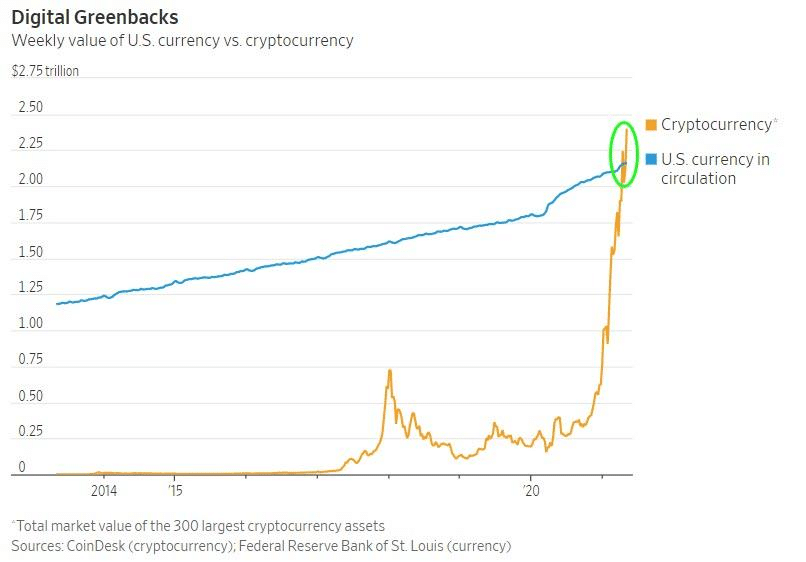
An interesting event occurred this past week. The total market value of the 300 largest cryptocurrency assets surpassed the value of all physical U.S. dollars in circulation.
Statistician Willy Woo analyzed recent trading data and concluded this year’s bull run is different from the rest because speculative hands are not holding and seasoned investors – including banks and institutions – are buying up the slack at higher prices than ever. “This cycle is different; the movement of coins to strong holders is unprecedented,” he summarized.
Riverbend Indicators:
Each week we post notable changes to the various market indicators we follow.
- As a reading of our Bull-Bear Indicator for U.S. Equities (comparative measurements over a rolling one-year timeframe), we remain in Cyclical Bull territory.
- Counting-up of the number of all our indicators that are ‘Up’ for U.S. Equities, the current tally is that three of four are Positive, representing a multitude of timeframes (two that can be solely days/weeks, or months+ at a time; another, a quarter at a time; and lastly, the {typically} years-long reading, that being the Cyclical Bull or Bear status).
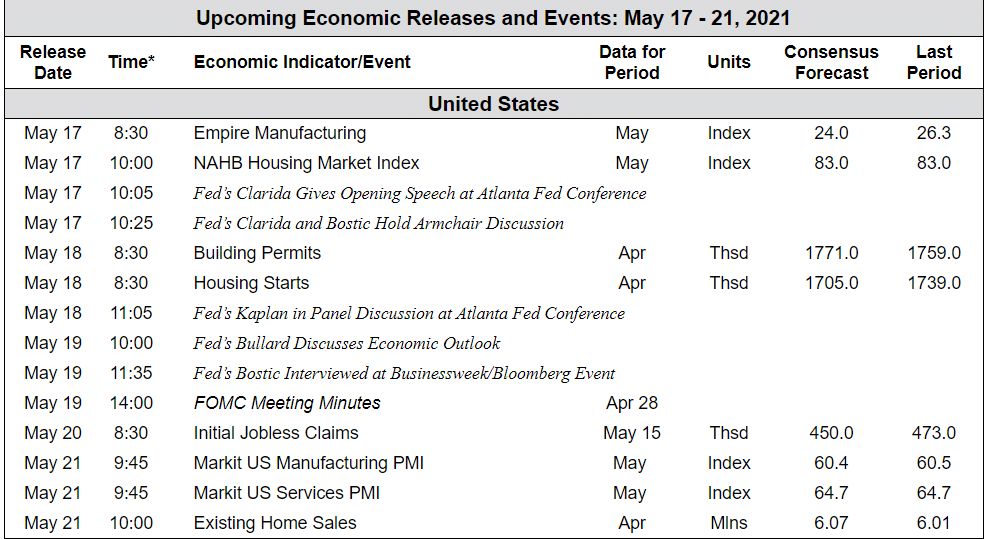
The Week Ahead:
*Eastern Standard Time. Source: Bloomberg, TD Economics
(Sources: All index- and returns-data from Yahoo Finance; news from Reuters, Barron’s, Wall St. Journal, Bloomberg.com, ft.com, guggenheimpartners.com, zerohedge.com, ritholtz.com, markit.com, financialpost.com, Eurostat, Statistics Canada, Yahoo! Finance, stocksandnews.com, marketwatch.com, wantchinatimes.com, BBC, 361capital.com, pensionpartners.com, cnbc.com, FactSet.)
[/fusion_text][/fusion_builder_column][fusion_builder_column type=”1_6″ spacing=”” center_content=”no” link=”” target=”_self” min_height=”” hide_on_mobile=”small-visibility,medium-visibility,large-visibility” class=”” id=”” hover_type=”none” border_size=”0″ border_color=”” border_style=”solid” border_position=”all” border_radius=”” box_shadow=”no” dimension_box_shadow=”” box_shadow_blur=”0″ box_shadow_spread=”0″ box_shadow_color=”” box_shadow_style=”” padding_top=”” padding_right=”” padding_bottom=”” padding_left=”” margin_top=”” margin_bottom=”” background_type=”single” gradient_start_color=”” gradient_end_color=”” gradient_start_position=”0″ gradient_end_position=”100″ gradient_type=”linear” radial_direction=”center” linear_angle=”180″ background_color=”” background_image=”” background_image_id=”” background_position=”left top” background_repeat=”no-repeat” background_blend_mode=”none” animation_type=”” animation_direction=”left” animation_speed=”0.3″ animation_offset=”” filter_type=”regular” filter_hue=”0″ filter_saturation=”100″ filter_brightness=”100″ filter_contrast=”100″ filter_invert=”0″ filter_sepia=”0″ filter_opacity=”100″ filter_blur=”0″ filter_hue_hover=”0″ filter_saturation_hover=”100″ filter_brightness_hover=”100″ filter_contrast_hover=”100″ filter_invert_hover=”0″ filter_sepia_hover=”0″ filter_opacity_hover=”100″ filter_blur_hover=”0″ last=”no”][/fusion_builder_column][/fusion_builder_row][/fusion_builder_container]


