[fusion_builder_container hundred_percent=”no” equal_height_columns=”no” menu_anchor=”” hide_on_mobile=”small-visibility,medium-visibility,large-visibility” class=”” id=”” background_color=”” background_image=”” background_position=”center center” background_repeat=”no-repeat” fade=”no” background_parallax=”none” parallax_speed=”0.3″ video_mp4=”” video_webm=”” video_ogv=”” video_url=”” video_aspect_ratio=”16:9″ video_loop=”yes” video_mute=”yes” overlay_color=”” video_preview_image=”” border_size=”” border_color=”” border_style=”solid” padding_top=”” padding_bottom=”” padding_left=”” padding_right=””][fusion_builder_row][fusion_builder_column type=”1_1″ layout=”1_1″ background_position=”left top” background_color=”” border_size=”” border_color=”” border_style=”solid” border_position=”all” spacing=”yes” background_image=”” background_repeat=”no-repeat” padding_top=”” padding_right=”” padding_bottom=”” padding_left=”” margin_top=”0px” margin_bottom=”0px” class=”” id=”” animation_type=”” animation_speed=”0.3″ animation_direction=”left” hide_on_mobile=”small-visibility,medium-visibility,large-visibility” center_content=”no” last=”no” min_height=”” hover_type=”none” link=””][fusion_text]
It’s impossible to understand today’s economy and markets without a clear perspective on global supply chain disruptions. From computer chips to the availability of workers, supply bottlenecks are raising concerns around economic growth and inflation.
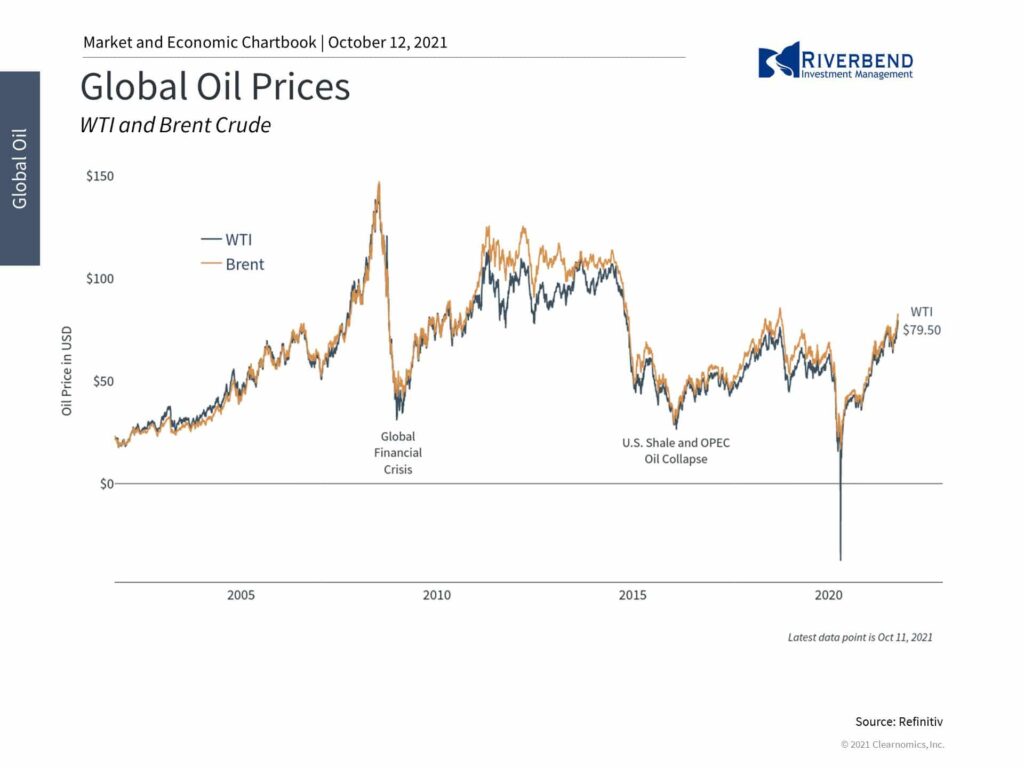
One major contributor to these worries is the energy sector with oil prices rising above $80 per barrel, the highest since 2014. Many investors are wondering what implications this will have for the economy and the stock market.
Even as investors focus more and more on renewable energy sources, the world is still primarily driven by fossil fuels. The International Energy Agency (IEA) estimates that global oil demand was 100 million barrels per day prior to the pandemic and could recover to 96.2 million barrels per day by the end of 2021.
The sharp economic rebound has helped to boost demand after oil prices plummeted during the pandemic. At one point, the price of the front-month contract fell to negative territory for the first time in history due to a lack of oil storage capacity.
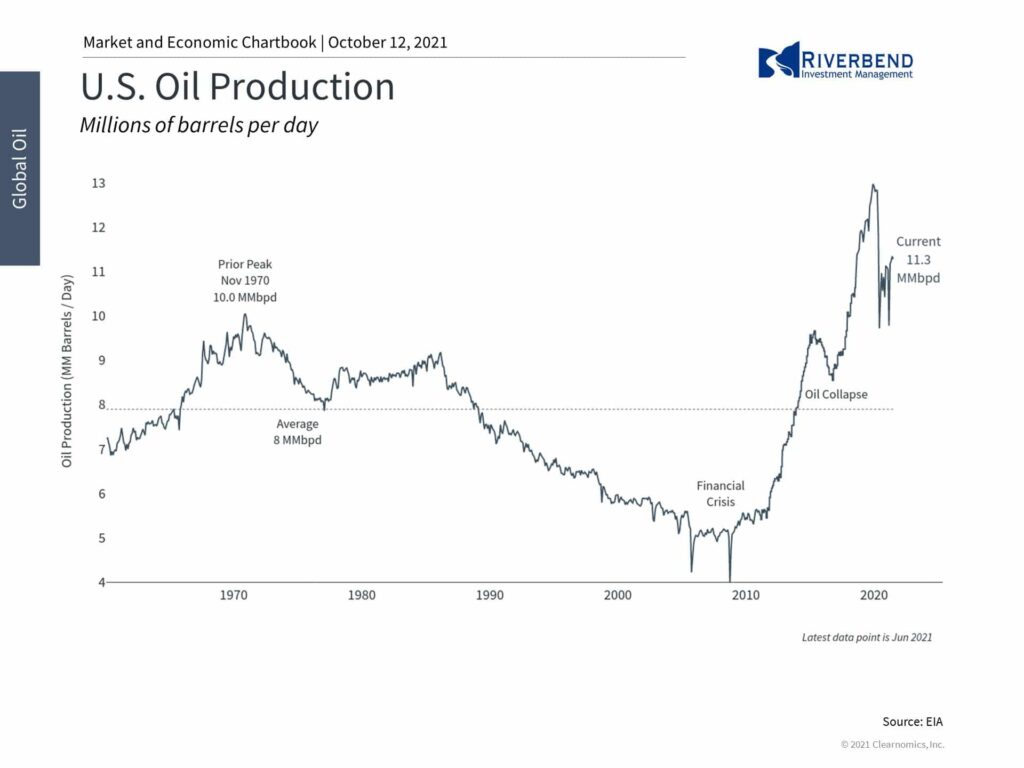
Supply has been slower to keep up. OPEC and Russia (known collectively as OPEC+) have raised production only modestly and U.S. producers haven’t filled the gap as they have cut costs and improve efficiency.
Dwindling natural gas supplies and inventories are expected to spill over into oil markets. Places like the U.K. are dealing with gasoline shortages while China is suffering rolling blackouts. Altogether, these forces are pushing energy prices higher.
Energy prices affect investors in many ways. First, today’s oil and natural gas prices are symptomatic of supply chain issues facing almost all industries. Not only are shortages of raw materials and labor impacting production and manufacturing, but logistics are hamstrung with container ships stuck waiting to unload.
While it’s normal for energy costs to rise over the course of a business cycle, as they did before 2008 and during the last cycle, today’s situation is somewhat unique.
Thus, even with U.S. consumers in a strong financial position, supply constraints are impacting economic growth. While this should eventually be resolved, it’s hard to estimate how long it will take and will depend on each industry.
Some economists, the Fed included, still believe that these factors are “transitory” and could be resolved in 2022.
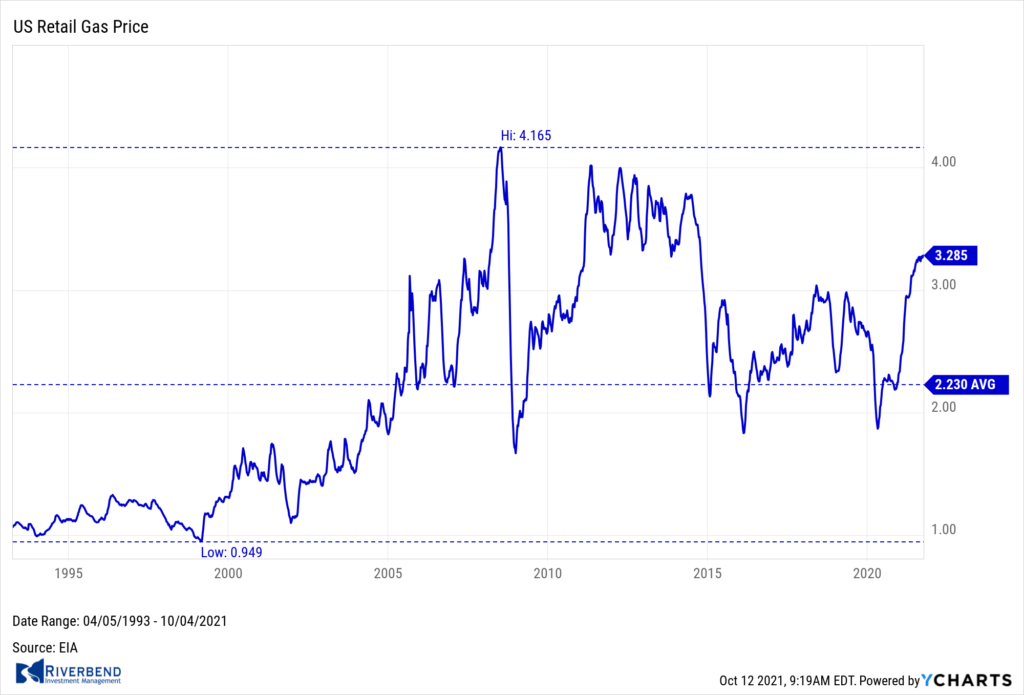
Second, higher energy prices are negative for U.S. consumers and businesses since they boost the cost of products and services directly and indirectly. Gasoline, for instance, has risen from a nationwide average of around $1.75 a gallon to over $3.25 today. However, it’s also the case that energy prices, including gasoline, have been relatively low for much of the past 7 years.
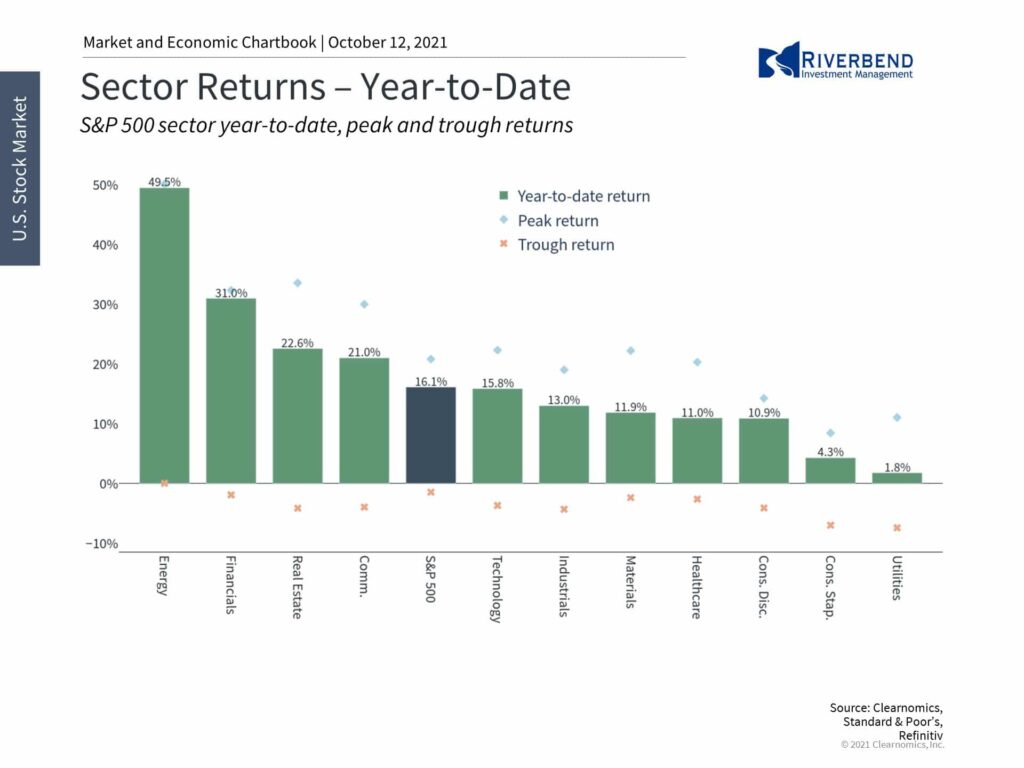
Third, from an investment perspective, the energy sector has been a volatile component of diversified portfolios. The shale revolution which began in the early 2010’s, has faced many ups-and-downs as over-supply became an issue before the pandemic. This led to the underperformance of the sector for years, which most likely caused some investors to avoid energy-related assets.
However, for those who are properly diversified, the energy sector accounts for just under 3% of the S&P 500’s market capitalization. The fact that the sector has gained 50% this year alone, and 81% over the past twelve months, emphasizes the importance of investing within and across markets. It’s difficult to know what may or may not outperform in any given year, especially once a sector falls out of favor, and thus it’s important to be broadly diversified.
Thus, rising oil prices are both a reflection of supply chain problems as well as a factor that will directly impact consumers and businesses. Although oil prices are above $80, there are reasons to believe that the economy can still grow steadily, especially if more supply can come online. Long-term investors ought to stay diversified and focused on the underlying issues rather than the day-to-day movements of energy prices.
Chart of the Week: 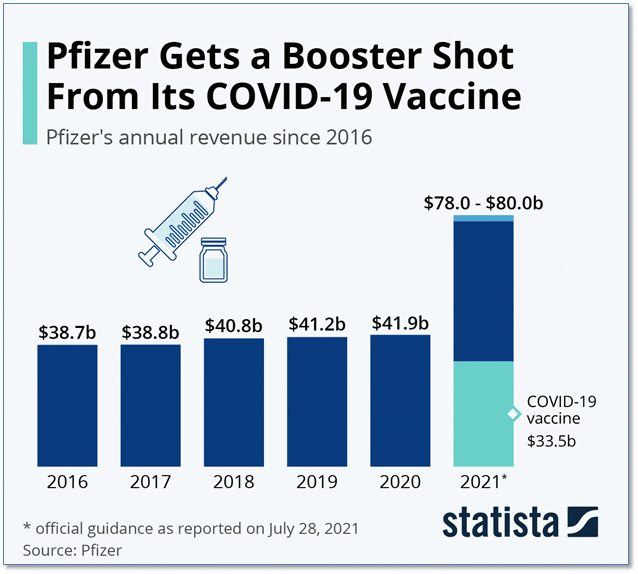
Pfizer, the world’s third-largest pharmaceutical company based on prescription drug sales, is receiving a massive injection of revenue from its COVID-19 vaccine.
Pfizer projects that revenue will almost double in 2021 compared to 2020.
BNT162b2, as Pfizer’s vaccine is officially called, is expected to account for more than 40% of Pfizer’s revenue for the year, dwarfing any other drug in its vast portfolio.
Riverbend Indicators:

Each week we post notable changes to the various market indicators we follow.
- As a reading of our Bull-Bear Indicator for U.S. Equities (comparative measurements over a rolling one-year timeframe), we remain in Cyclical Bull territory.
- Counting up of the number of all our indicators that are ‘Up’ for U.S. Equities, the current tally is that four of four are Positive, representing a multitude of timeframes (two that can be solely days/weeks, or months+ at a time; another, a quarter at a time; and lastly, the {typically} years-long reading, that being the Cyclical Bull or Bear status).
The Week Ahead:
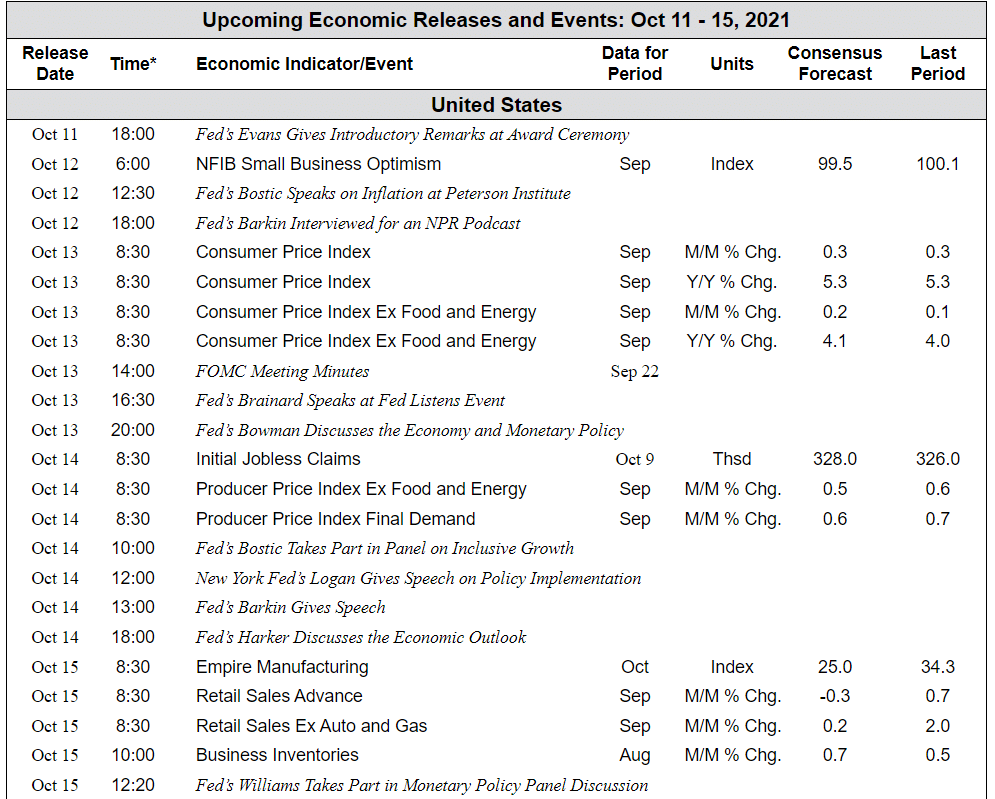
Source: Bloomberg, TD Economics
[/fusion_text][/fusion_builder_column][/fusion_builder_row][/fusion_builder_container]


