[fusion_builder_container hundred_percent=”no” equal_height_columns=”no” menu_anchor=”” hide_on_mobile=”small-visibility,medium-visibility,large-visibility” class=”” id=”” background_color=”” background_image=”” background_position=”center center” background_repeat=”no-repeat” fade=”no” background_parallax=”none” parallax_speed=”0.3″ video_mp4=”” video_webm=”” video_ogv=”” video_url=”” video_aspect_ratio=”16:9″ video_loop=”yes” video_mute=”yes” overlay_color=”” video_preview_image=”” border_size=”” border_color=”” border_style=”solid” padding_top=”” padding_bottom=”” padding_left=”” padding_right=””][fusion_builder_row][fusion_builder_column type=”1_1″ layout=”1_1″ background_position=”left top” background_color=”” border_size=”” border_color=”” border_style=”solid” border_position=”all” spacing=”yes” background_image=”” background_repeat=”no-repeat” padding_top=”” padding_right=”” padding_bottom=”” padding_left=”” margin_top=”0px” margin_bottom=”0px” class=”” id=”” animation_type=”” animation_speed=”0.3″ animation_direction=”left” hide_on_mobile=”small-visibility,medium-visibility,large-visibility” center_content=”no” last=”no” min_height=”” hover_type=”none” link=””][fusion_text]
During the last quarter of 2020 and the first quarter of this year, investors were feeling pretty positive about the future of the market.
The COVID vaccine was starting to be rolled out and people looked forward to returning to normalcy.
Unfortunately, the Delta variant reared its ugly head and put that outlook to an abrupt stop.
The question is, “how has this impacted the market?”
Looking at the S&P 500 index, we might say “not at all”.
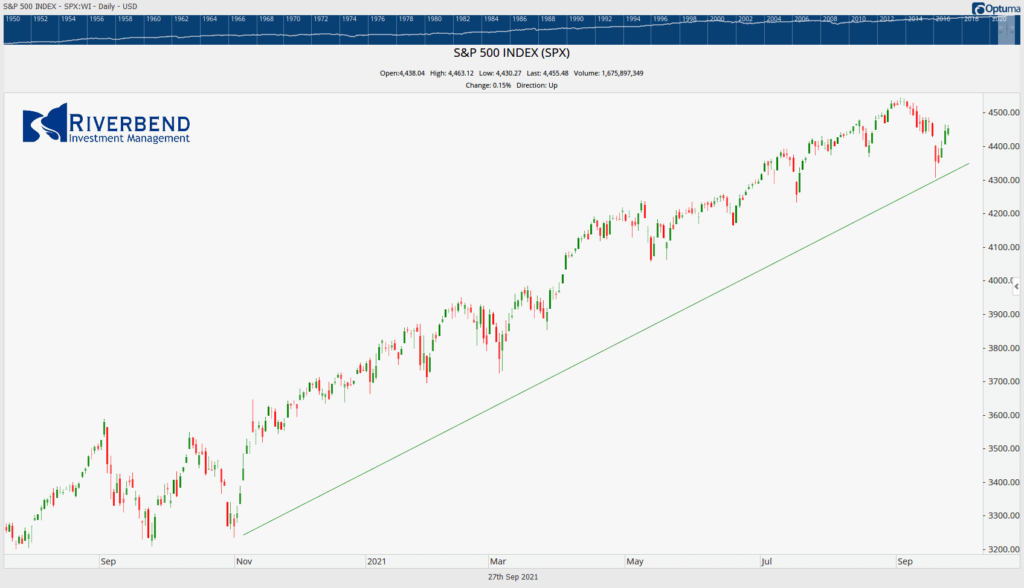
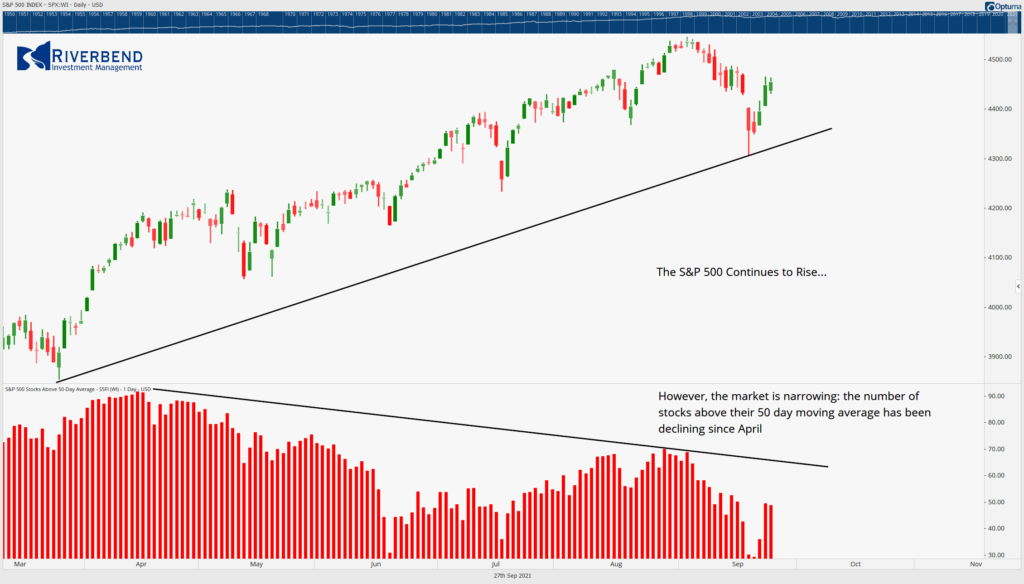
However, if we look under the hood of the market, we can see that the Delta variant has been having a fairly large impact.
Since April, the market has been narrowing – the number of stocks trading above their 50-day moving average has been declining as investors have focused on putting money back into last year’s winners.
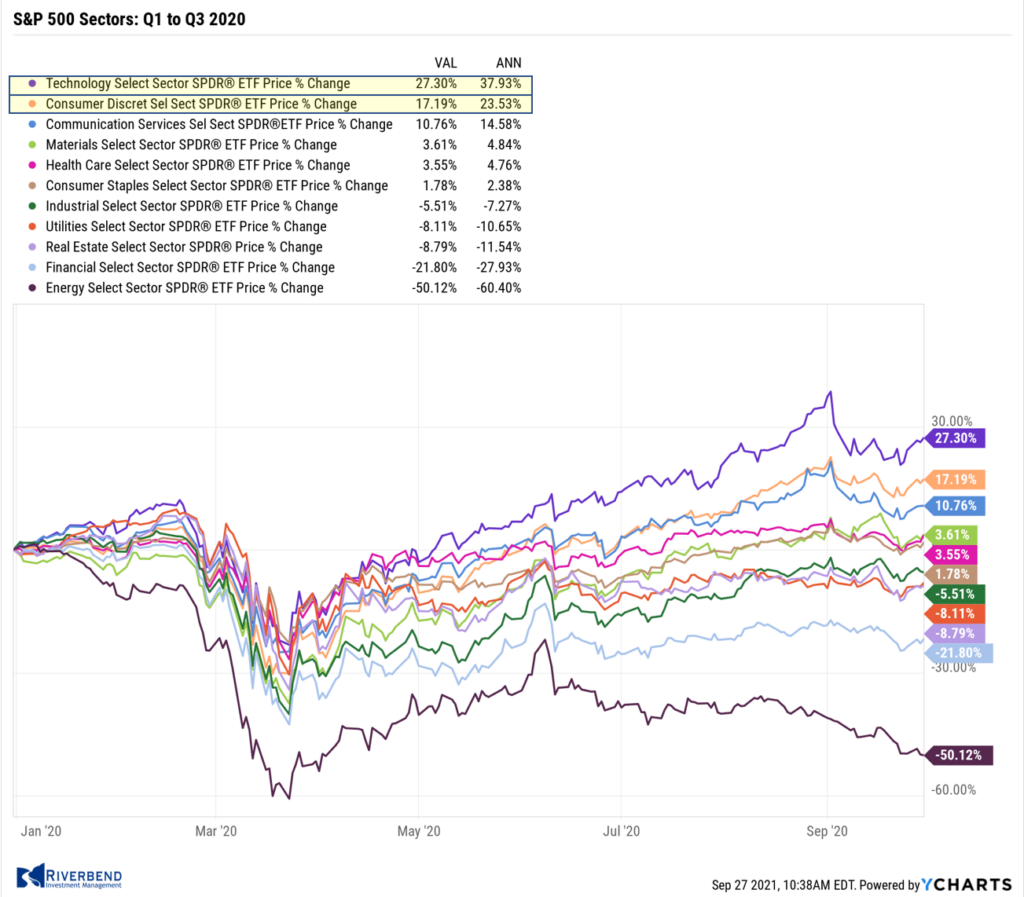
During the height of the COVID lockdown, areas like technology (everyone went remote) and consumer discretionary (everyone had nothing to do, so they shopped online) did very well:
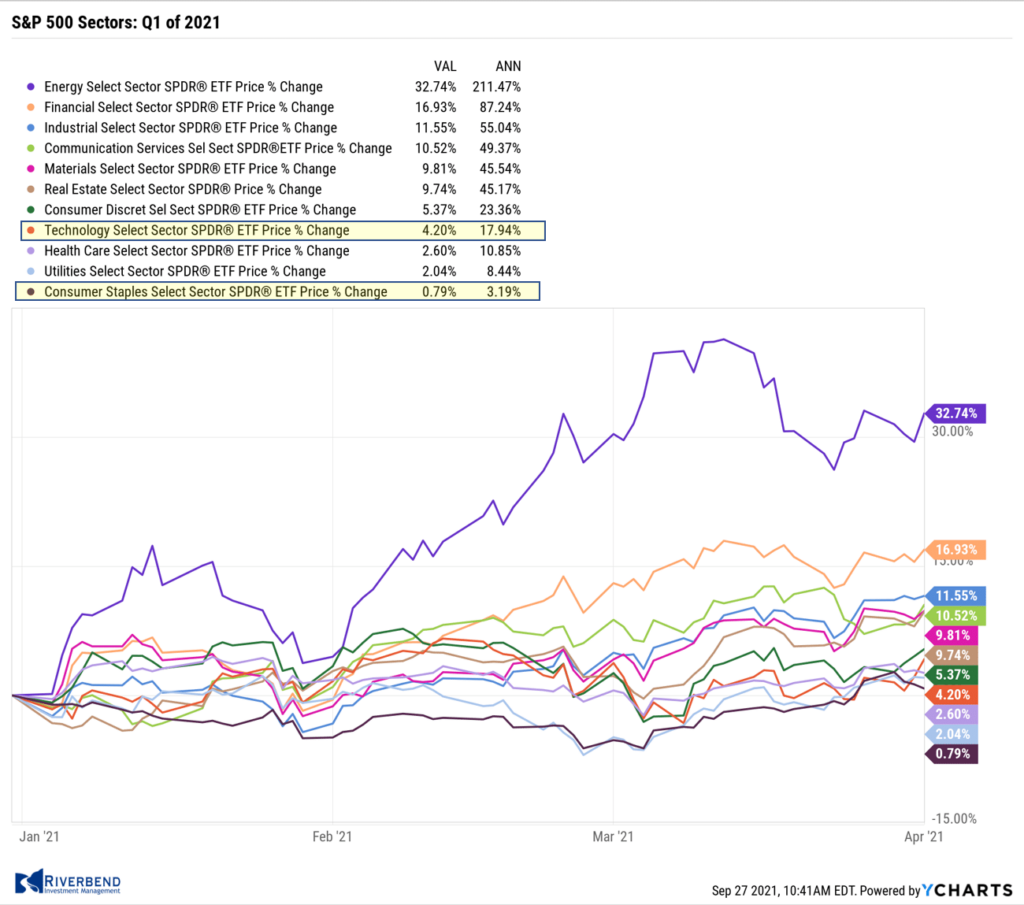
Once investors started to look towards a post COVID world, the market began a rotation in the 4th quarter of 2020. By the first quarter of 2021, we can see how the market shifted its focus towards sectors that will do well in a post COVID world — and started to ignore sectors that did well during the lockdown:
After the first quarter of this year, investors realized that the Delta variant was going to become a problem.
And the market began to rotate again – back into the areas that did well during the lockdown.
The Impact of FAANG(M) Stocks:
The big winners during 2020 were the FAANG(M) stocks: Facebook, Amazon, Apple, Netflix, and Google (nowadays I like to include Microsoft to the list).
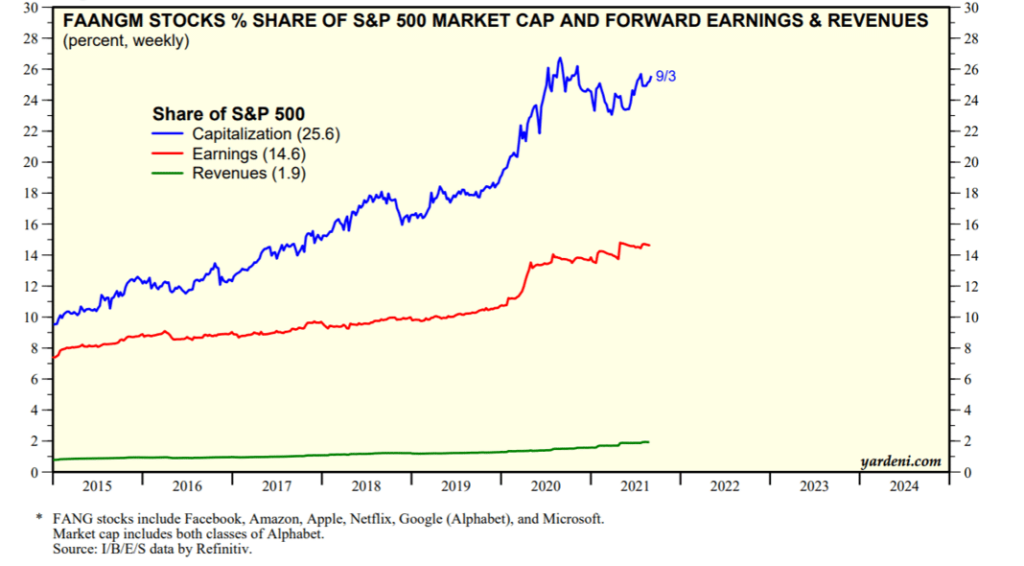
FAANGM names have had a large and growing impact on the S&P 500.
The S&P 500 index is weighted by market capitalization. Simply this means the larger the capitalization the larger the weighting.

Over the last decade, FAANGM stocks have grown to represent over 25% of the weighting of the S&P 500
During Q1 of this year, we saw tech underperform the broad market, but once investors started to focus on the Delta variant, the market shifted back into FAANGM names.
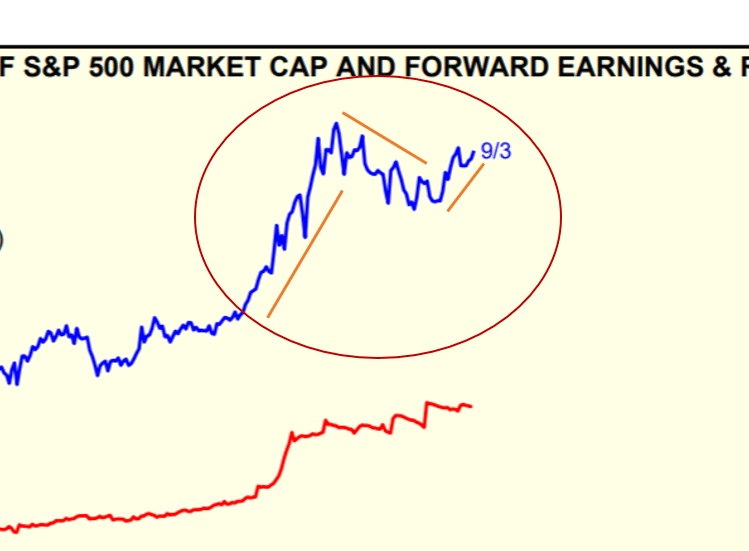
This disproportionate weighting of FAANG names has kept the S&P 500 in a rising trend, while the rest of the market has been ignored.
So what has been happening to the rest of the market during this time?
The Rest of the Market During Delta
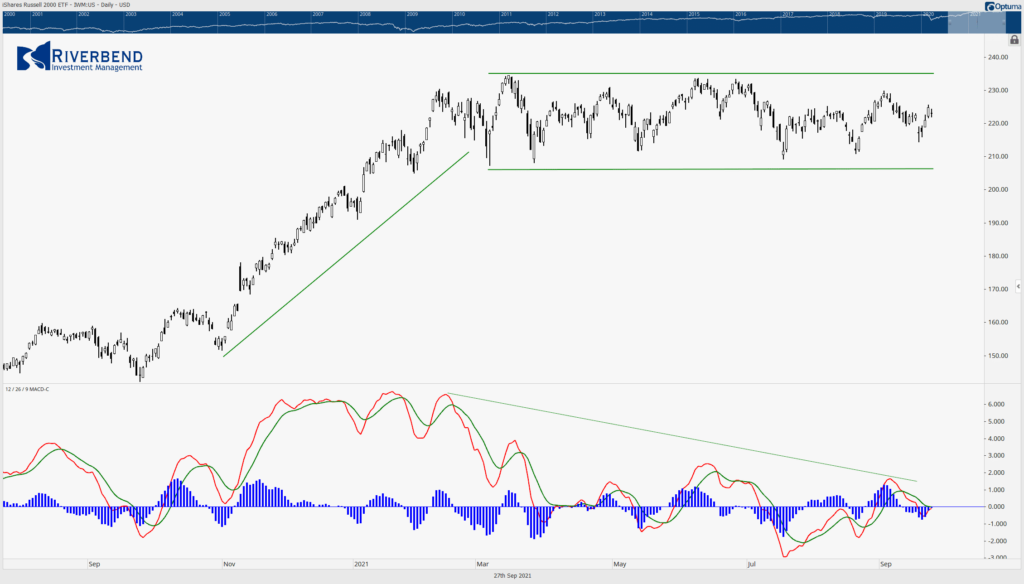
During Q1, we saw small-cap stocks take the lead. Since then, they have been trading sideways:
We can see a similar pattern in many of the major S&P 500’s sectors:
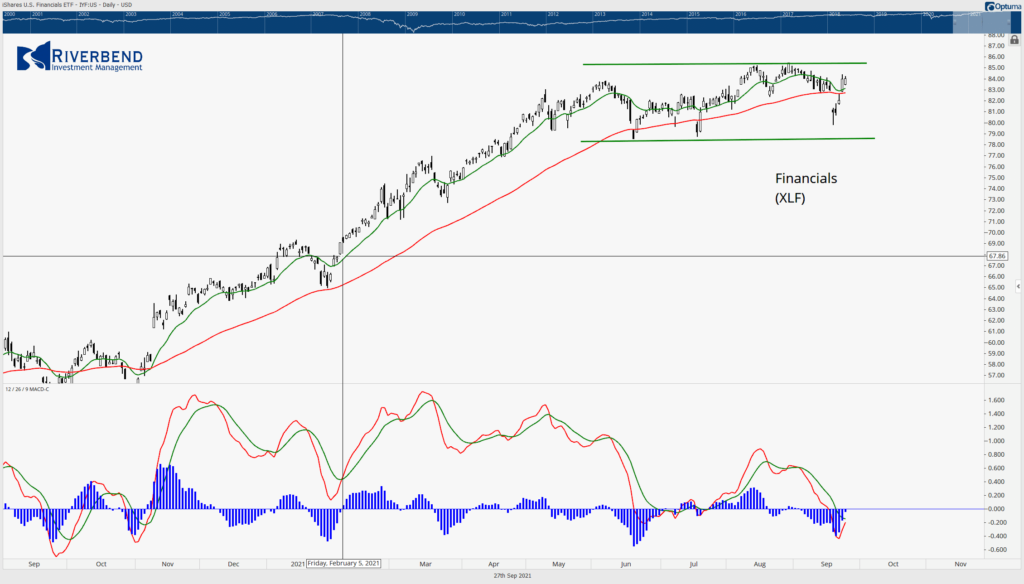
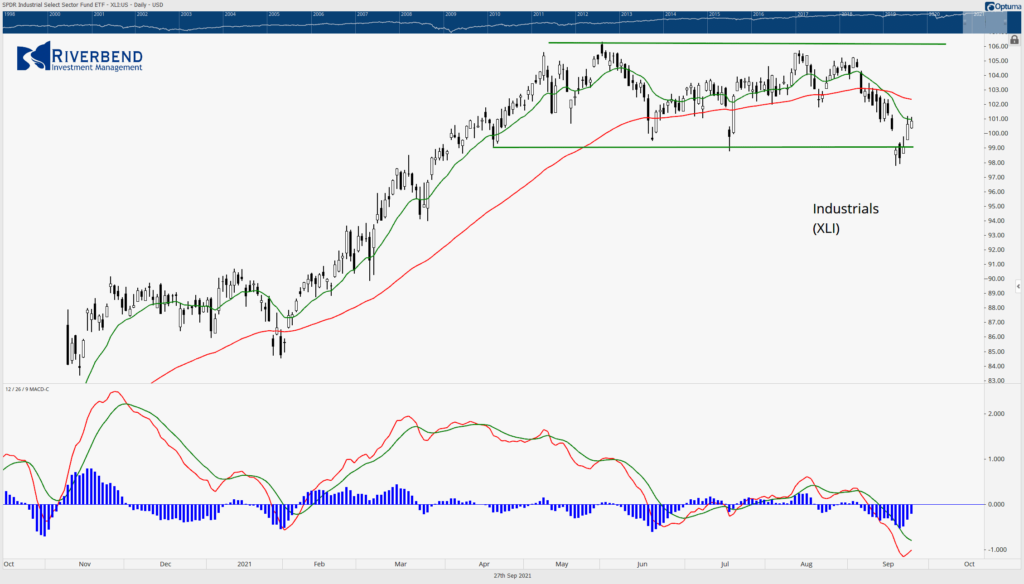
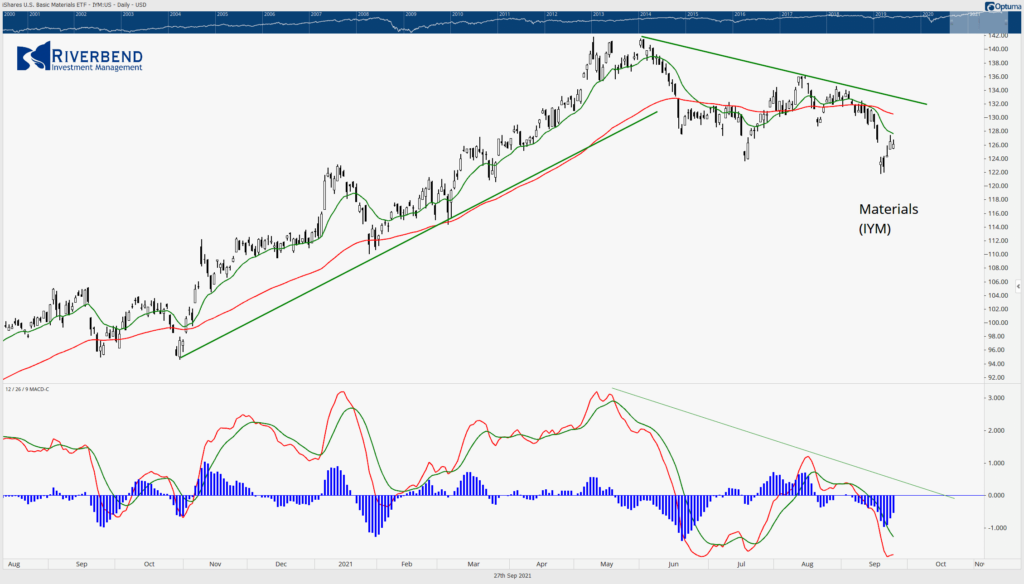
I could post charts like this all day, but I think you get the point – the broad market has been getting weaker due to Delta.
Is the Bond Market Hinting at What’s Next to Come?
During 2020 the market was narrow, so diversified investors didn’t have many places to invest. They had two choices: increase their risk by overweighting COVID winners — or wait it out in the bond market.
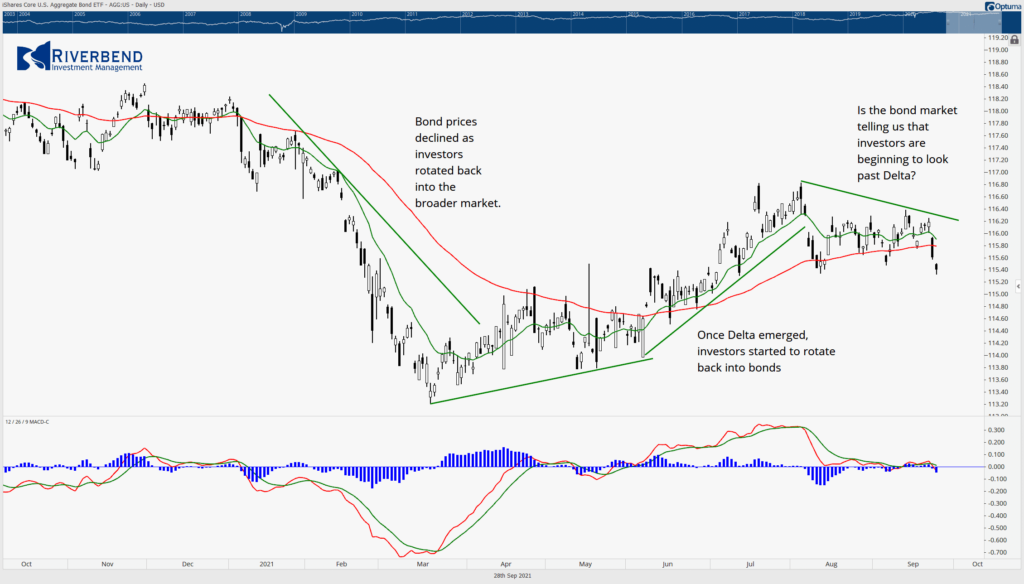
By Q1 of this year, investors were abandoning bonds and putting money to work in the broadening, post-COVID, market.
Once Delta emerged — despite all the news around inflation and the Fed stating that they will raise interest rates at some point — bonds began to rise again as the market narrowed once more.
Fast forward to today, we are starting to see that pattern shift again.
The bond market may be giving us an early signal that traders are starting to look past Delta and may begin to shift into the broader market again.
Will This Come at the Expense of FAANGM Names?
Investors should use caution when chasing tech names, especially FAANGM names.
Any market historian will tell you that markets regress back to their mean over time.
Pre-Covid, the technology sector has risen in an orderly, upward trend since its 2008-2009 low.
Since, COVID, technology stocks have risen dramatically.
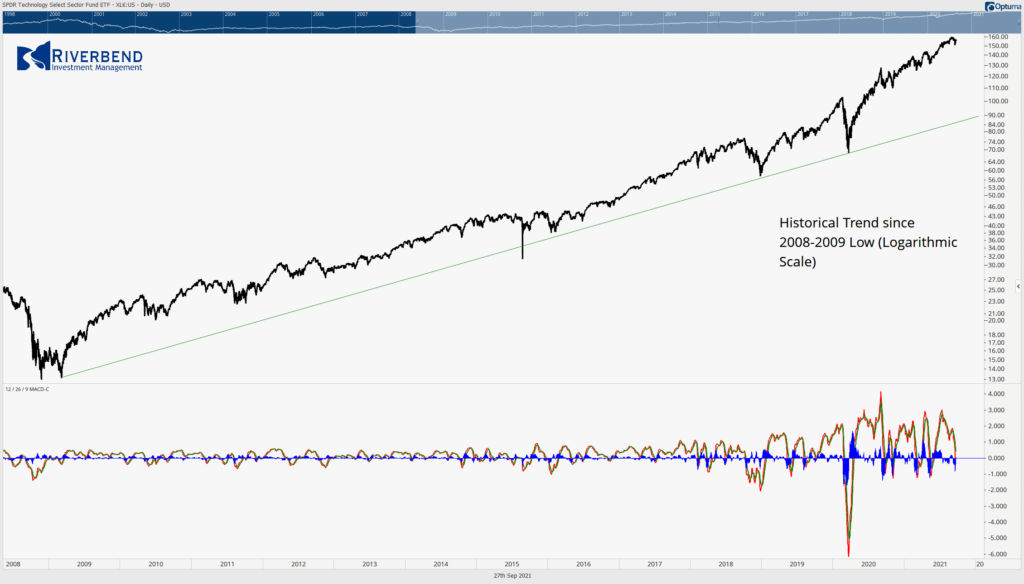
One has to wonder, if and when the sector will regress back to its historical trend…
And what this regression will look like.
It’s doubtful that we will see a sharp downward spike. Instead, we may see something similar to what happened after the 2000-2002 tech collapse.
During that time we saw a decade where the S&P 500 underperformed areas like small and mid-cap stocks. Part of the reason for this underperformance was the large weighting of tech stocks within the S&P 500 index (sound familiar?).
Only time will tell, and as a portfolio manager I let the data drive the portfolio, but we may look back at this time as the start of a decade similar to that of 2000-2010, aka the “Lost Decade”.
Riverbend Indicators:

Each week we post notable changes to the various market indicators we follow.
- As a reading of our Bull-Bear Indicator for U.S. Equities (comparative measurements over a rolling one-year timeframe), we remain in Cyclical Bull territory.
- Counting up of the number of all our indicators that are ‘Up’ for U.S. Equities, the current tally is that three of four are Positive, representing a multitude of timeframes (two that can be solely days/weeks, or months+ at a time; another, a quarter at a time; and lastly, the {typically} years-long reading, that being the Cyclical Bull or Bear status).
Chart of the Week:
Most people haven’t even begun to think about doing their Christmas shopping; after all it isn’t even Halloween. But maybe you should.
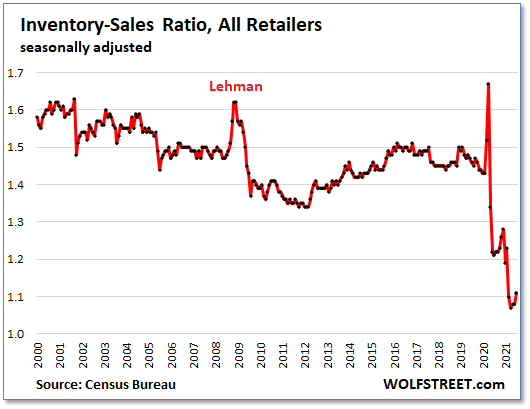
Retailers attempting to stock up for the holiday selling season are facing all kinds of shortages, transportation chaos, and surging prices.
As analysts at WolfStreet.com point out, the inventory-to-sales ratio (inventories divided by sales, a standard metric of supply, which cancels out the impact of inflation) started collapsing last year.
In May, the ratio hit an all-time low in the data going back to 1992, and has only regained a small amount since. Memories of 80’s era fistfights over Cabbage Patch Kids dolls come to mind…
The Week Ahead:
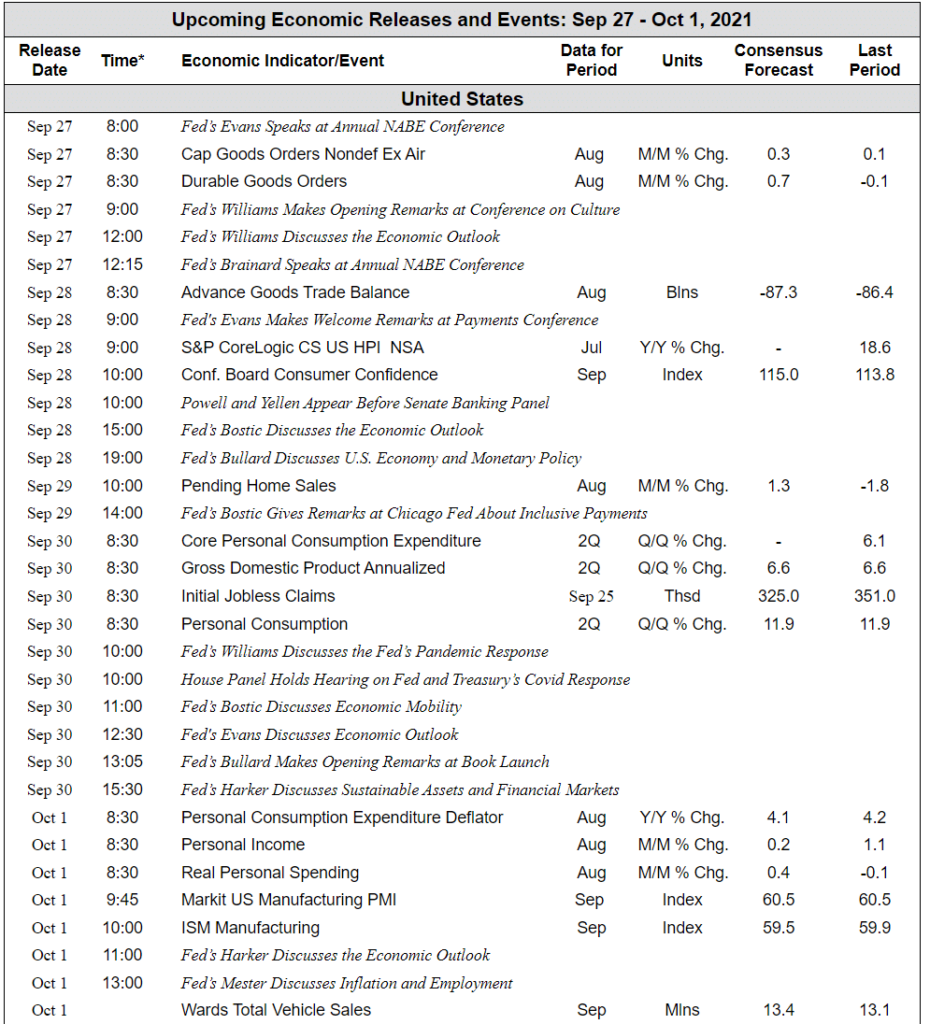
source: Bloomberg, TD Economics
[/fusion_text][/fusion_builder_column][/fusion_builder_row][/fusion_builder_container]


