[fusion_builder_container hundred_percent=”no” equal_height_columns=”no” menu_anchor=”” hide_on_mobile=”small-visibility,medium-visibility,large-visibility” class=”” id=”” background_color=”” background_image=”” background_position=”center center” background_repeat=”no-repeat” fade=”no” background_parallax=”none” parallax_speed=”0.3″ video_mp4=”” video_webm=”” video_ogv=”” video_url=”” video_aspect_ratio=”16:9″ video_loop=”yes” video_mute=”yes” overlay_color=”” video_preview_image=”” border_size=”” border_color=”” border_style=”solid” padding_top=”” padding_bottom=”” padding_left=”” padding_right=””][fusion_builder_row][fusion_builder_column type=”1_1″ layout=”1_1″ background_position=”left top” background_color=”” border_size=”” border_color=”” border_style=”solid” border_position=”all” spacing=”yes” background_image=”” background_repeat=”no-repeat” padding_top=”” padding_right=”” padding_bottom=”” padding_left=”” margin_top=”0px” margin_bottom=”0px” class=”” id=”” animation_type=”” animation_speed=”0.3″ animation_direction=”left” hide_on_mobile=”small-visibility,medium-visibility,large-visibility” center_content=”no” last=”no” min_height=”” hover_type=”none” link=””][fusion_text]
[/fusion_text][fusion_vimeo id=”565748727″ alignment=”center” width=”1000″ height=”” autoplay=”false” api_params=”” hide_on_mobile=”small-visibility,medium-visibility,large-visibility” class=”” css_id=”” /][fusion_text][fusion_text][fusion_text]
U.S. Markets: 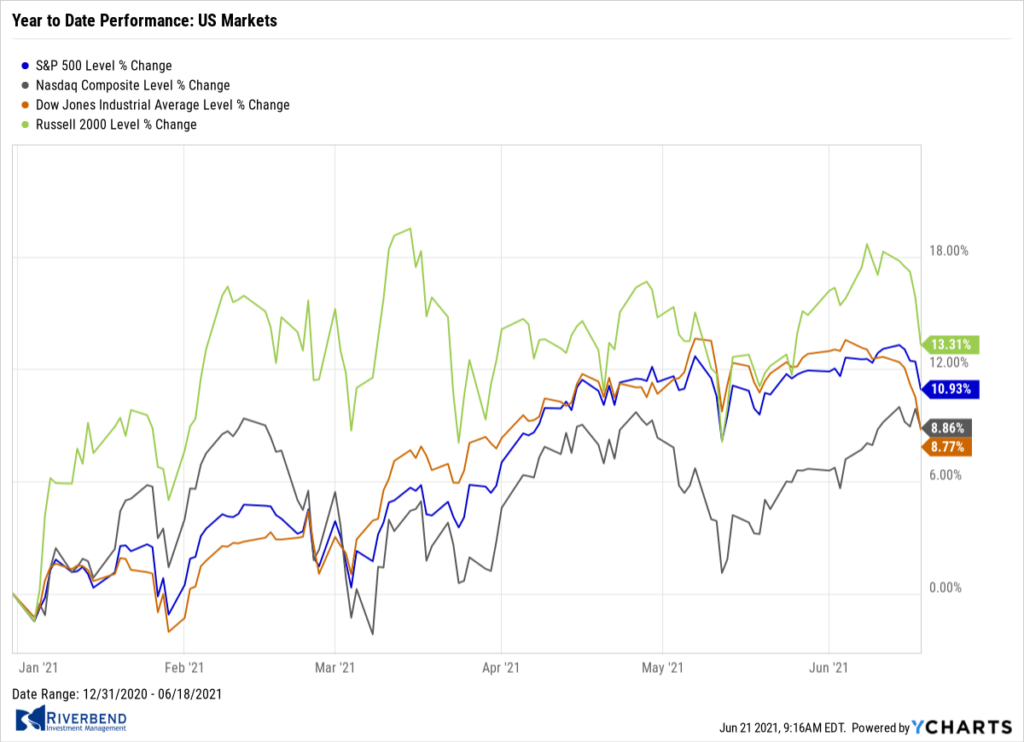
The major U.S. stock benchmarks finished the week by closing solidly lower, with the Dow and S&P 500 posting sharp weekly losses and the NASDAQ erasing its earlier advance for the week.
The Dow Jones Industrial Average declined over 1000 points to 33,290, a decline of -3.5%. The technology-heavy NASDAQ remained resilient with just a -0.3% loss.
By market cap, large caps showed relative strength declining just -1.9%, while the mid cap S&P 400 and small cap Russell 2000 dropped -5.1% and -4.2%, respectively.
International Markets: 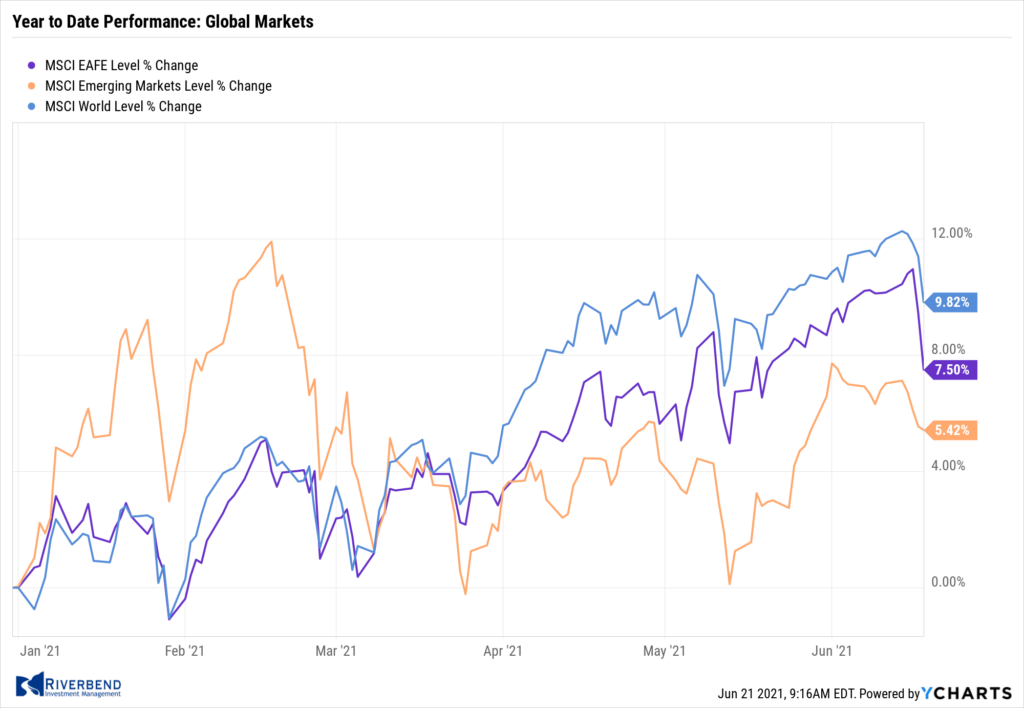
All but one major international market finished the week in the red. Canada’s TSX declined ‑0.7%, while the United Kingdom’s FTSE 100 finished down -1.6%.
On Europe’s mainland, France’s CAC 40 and Germany’s DAX gave up -0.5% and -1.6%, respectively, while in Asia China’s Shanghai Composite declined -1.8%. Japan’s Nikkei bucked the trend and managed a 0.05% rise.
As grouped by Morgan Stanley Capital International, developed markets ended down -3.1%, while emerging markets declined -1.9%.
Commodities: 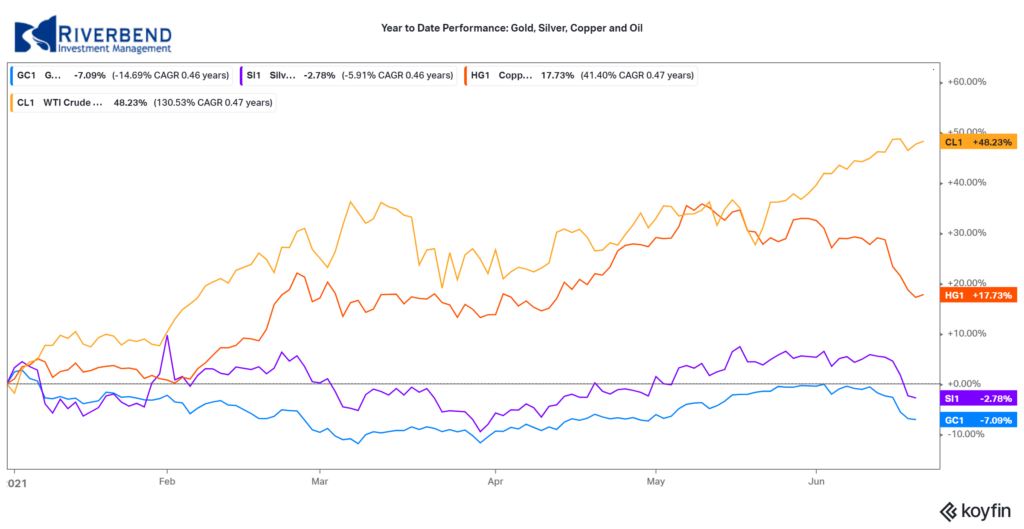
Precious metals ended down for the week, with Gold retreating -5.9% to $1769 an ounce, and Silver giving up -7.7% to $25.97.
Energy managed to finish the week with a modest gain. West Texas Intermediate crude oil rose 0.5% to $71.29 per barrel.
The industrial metal copper, viewed by some analysts as a barometer of global economic health due to its wide variety of uses, plunged -8.4%.
U.S. Economic News: 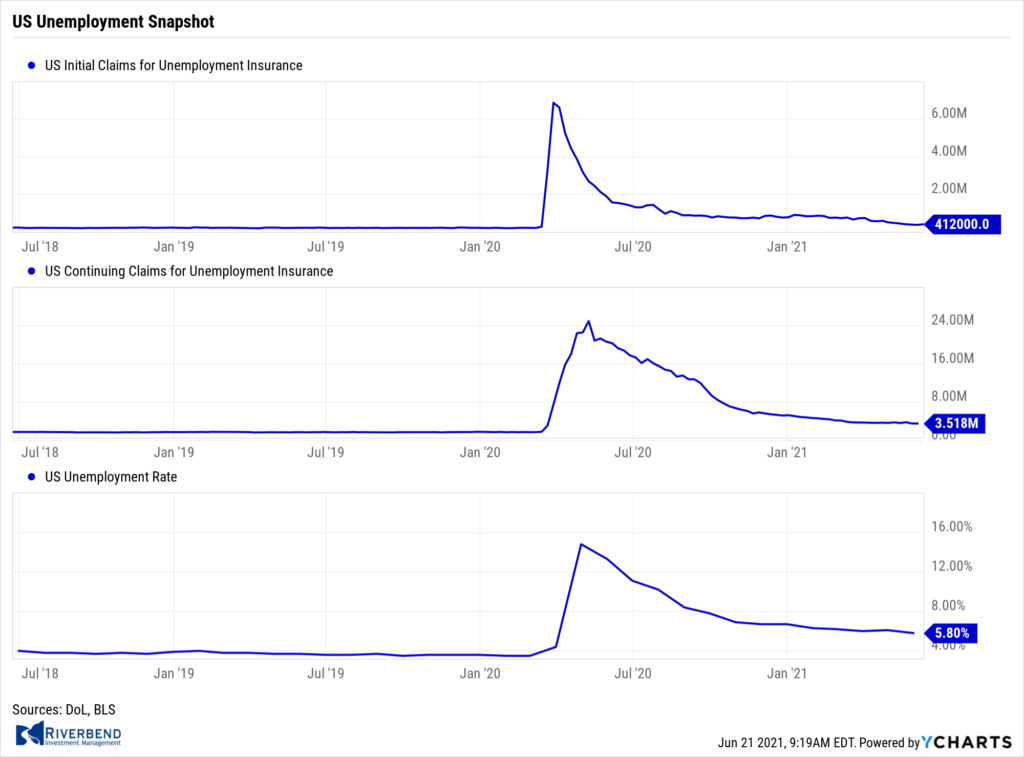
The number of Americans filing first-time unemployment benefits unexpectedly rose last week to its highest level in a month. The Labor Department reported initial jobless claims rose by 37,000 to 412,000 in the week ended June 12. Economists had forecast claims would continue to fall to 365,000. Meanwhile, the number of people already collecting benefits rose by just 1,000 to 3.52 million—remaining near its lowest level since the onset of the pandemic last year. Jobless claims filings have been trending lower since February as the economy has been recovering from the pandemic. Ian Shepherdson, chief economist at Pantheon Macroeconomics stated claims could fall to the 250,000 level by the end of summer.
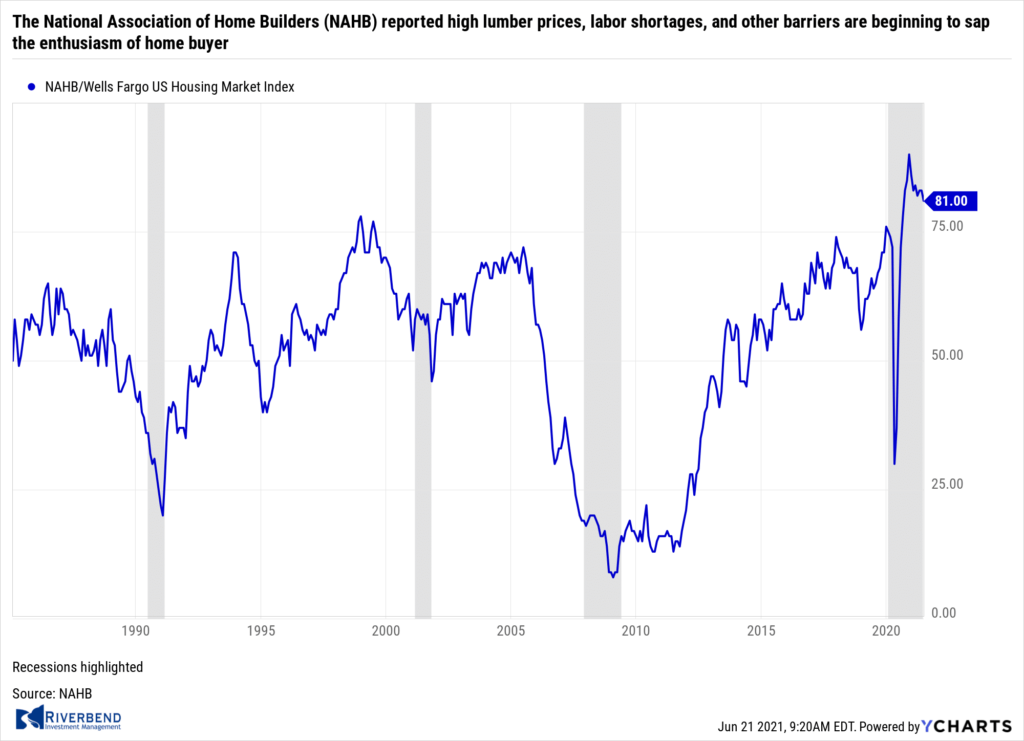 The National Association of Home Builders (NAHB) reported high lumber prices, labor shortages, and other barriers are beginning to sap the enthusiasm of home buyers. A survey of builders shows they are still very confident their business will improve, but they are not quite as optimistic as they were at the end of last year. The NAHB monthly confidence index slipped to 81 in June from 83 in May–its lowest level in nine months. Confidence took a huge hit during the early stages of the pandemic as sales briefly nosedived. Yet record low mortgage rates and the end of the nationwide lockdown led to an explosion in demand among home buyers. Despite the recent fall in the price of lumber, prices remain much higher than they were a year ago. NAHB Chairman Chuck Fowke stated in its release, “These higher costs have moved some new homes beyond the budget of prospective buyers, which has slowed the strong pace of home building.”
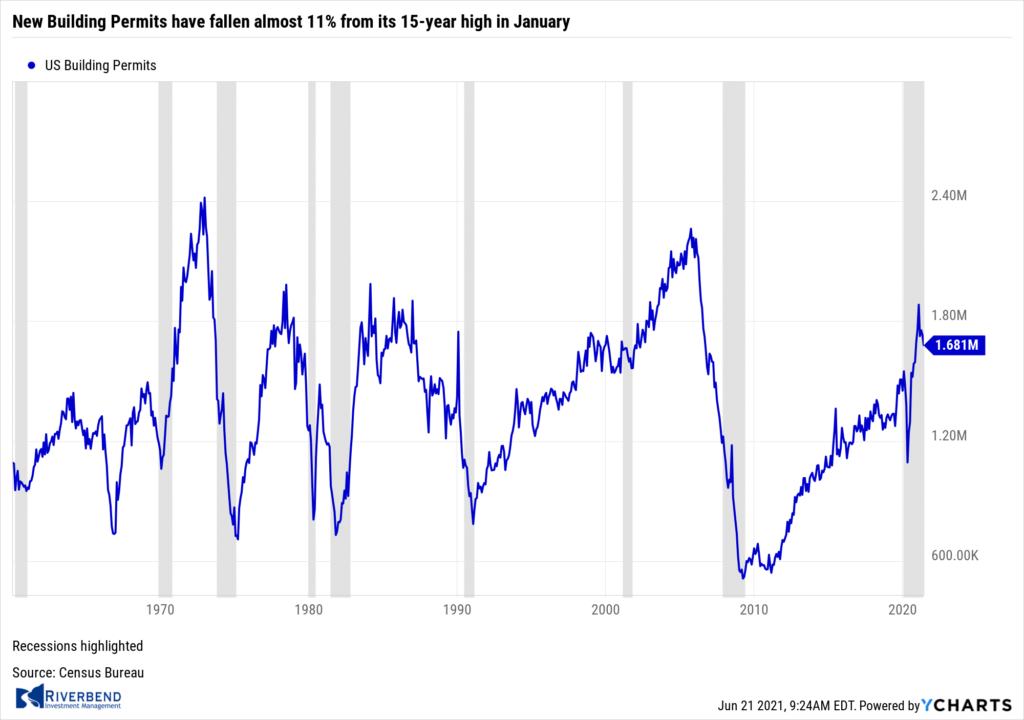 The Census Bureau reported new construction of single-family houses increased a solid 4.2% in May to a 1.1 million annualized rate, but an indicator of future building activity–permits for future home construction–declined again. Permits have fallen almost 11% from its 15-year high in January. Construction increased sharply in the Midwest and grew more slowly in the South and West. Only the Northeast saw a decline. Home building is much higher in all four regions compared to one year ago, but construction is likely to take place at a more subdued pace until all the bottlenecks ease. “The issue in the housing market, as with much of the broader economy, isn’t the demand side of the market,” said chief economist Richard Moody of Regions Financial. “Rather, it is the ability of producers, in this case home builders, to meet that demand. That is an issue for which there is no quick fix.”
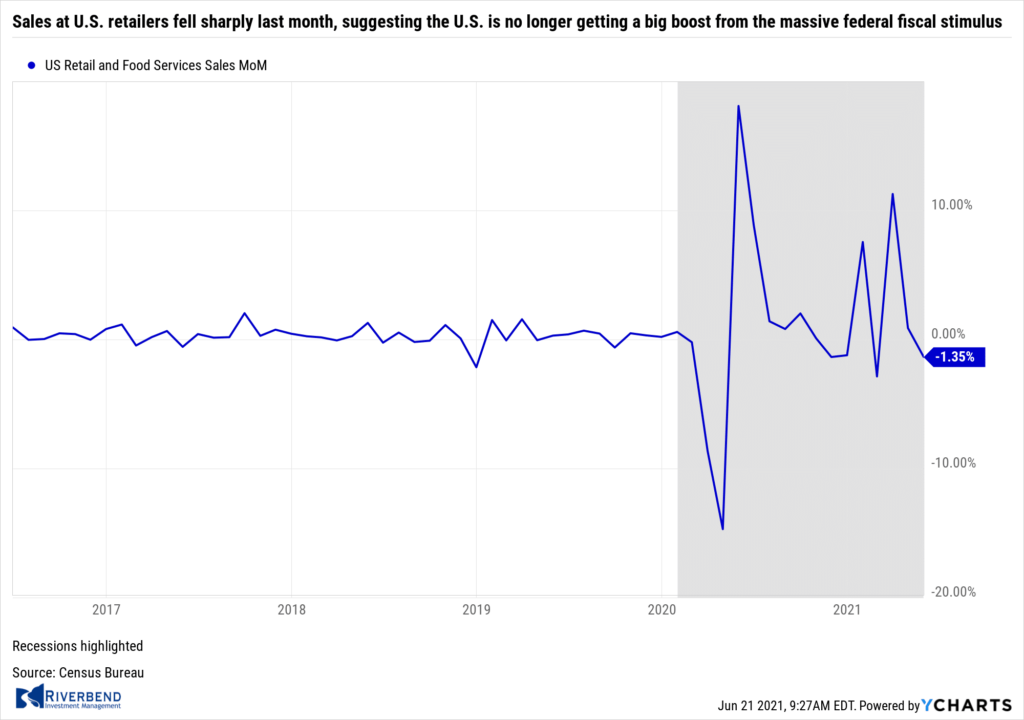 Sales at U.S. retailers fell sharply last month, suggesting the U.S. is no longer getting a big boost from the massive federal fiscal stimulus. The Census Department reported sales at U.S. retailers sank 1.3% in May. Economists had only expected a decline of 0.7%. Sales were held down by fewer purchases of new cars and trucks. Automakers have been unable to keep up with demand as a major global shortage of computer chips has restricted production. If autos are excluded, retail sales fell a smaller 0.7% in May. Still, sales were up 18% compared to the same time last year. Analysts remained optimistic following the release. Economist Katherine Judge of CIBC World Markets stated, “Don’t read too much into the larger than expected drop in U.S. retail sales in May, as it comes on the heels of an upward revision to April and a dramatic fiscal stimulus-fueled spike in March.”
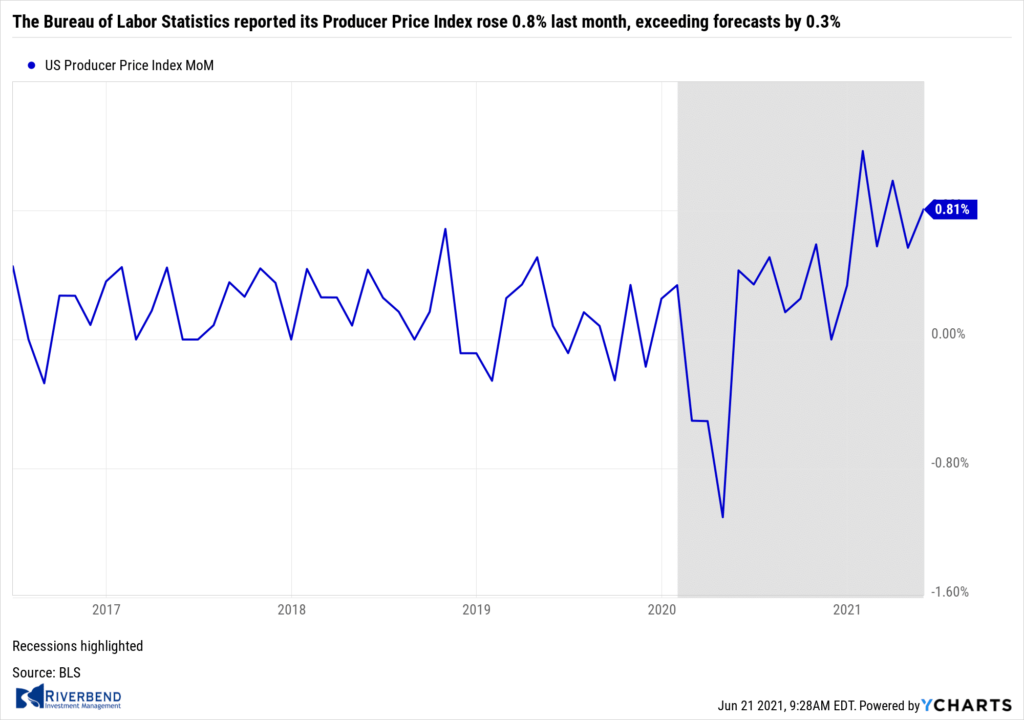 Prices at the wholesale level jumped again in May for the fifth consecutive time—a sign that inflationary pressures tied to the reopening of the U.S. economy and federal stimulus are likely to persist through the summer. The Bureau of Labor Statistics reported its Producer Price Index rose 0.8% last month, exceeding forecasts by 0.3%. Meanwhile, the rate of wholesale inflation over the past 12 months escalated to 6.6% from 6.2% the prior month. That’s the highest level since the index was reformulated in 2009. About 60% of the increase in wholesale inflation last month reflected the higher cost of goods: new autos, gasoline, metals, farm seeds and other agricultural products. Stripping out food, energy, and trade margins, the core rate of wholesale inflation rose 0.7% in May. The annual increase in the core rate over the past 12 months moved up to 5.3%–its largest gain since the government first began reporting it in 2014. Ian Shepherdon of Pantheon Macroeconomics wrote, “No end is in sight to the reopening surge in prices.”
The cost of imported goods climbed again in May and contributed to the biggest flareup in U.S. inflation in more than a decade–a flareup the Federal Reserve insists is “transitory”. The import price index advanced 1.1% in last month, the government reported. Economists had forecast 0.7% increase. Import prices have climbed 11.3% over the past 12 months to mark the fastest pace since 2011. The cost of foreign oil, cars and trucks, consumer goods and industrial supplies all rose in May. Excluding fuel, import prices moved up 0.9%.
The Federal Reserve, acknowledging that inflation may continue to increase, said it might hike interest rates earlier than it had previously expected. In its latest statement, the Fed is now anticipating two rate hikes in 2023.
The Federal Reserve, acknowledging that inflation may continue to increase, said it might hike interest rates earlier than it had previously expected. In its latest statement, the Fed is now anticipating two rate hikes in 2023. The Fed repeated its belief that inflation would be “transitory”, but Federal Reserve Chairman Jerome Powell stressed that he and his colleagues were in agreement that inflation could rise faster and last longer than expected. The Fed forecast that inflation would move up to 3% annual rate this year but would then drop sharply in 2022. In an outcome that was more hawkish than expected, the Fed’s dot plot chart showed 11 of 18 officials expect at least two rate hikes in 2023. In March, only seven expected even one hike. Furthermore, Powell announced the Fed held its first discussion about slowing down its bond purchases. The Fed has said it wanted to see “substantial further progress” before slowing down their bond purchases–the first step of pulling back all their support for the economy.
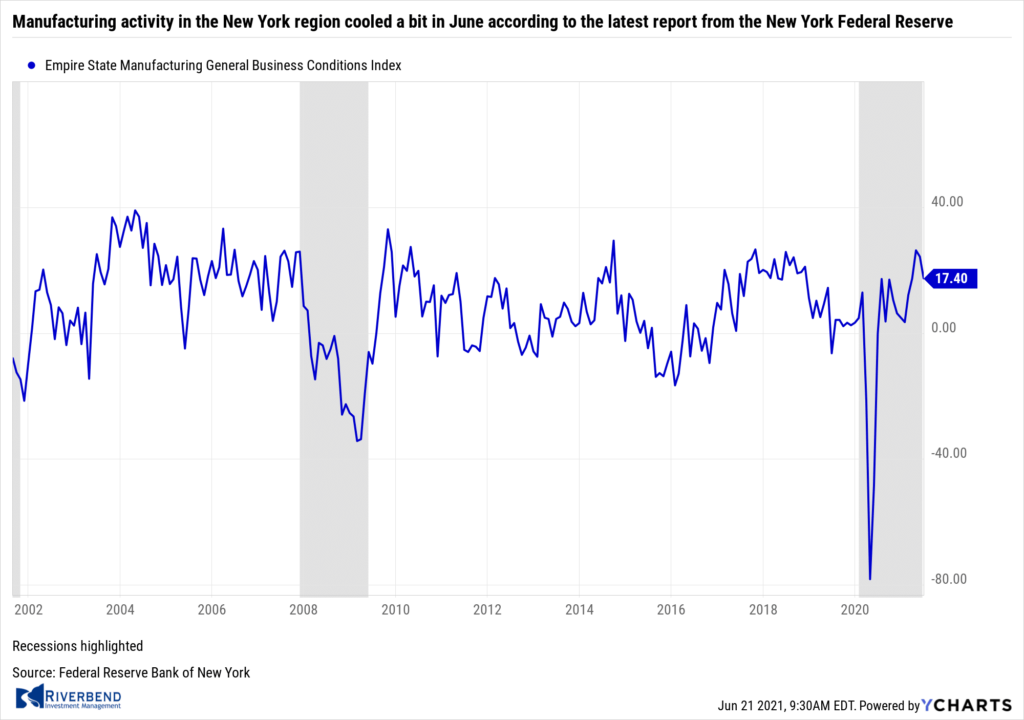 Manufacturing activity in the New York region cooled a bit in June according to the latest report from the New York Federal Reserve. The NY Fed’s Empire State Manufacturing Index slipped 6.9 points to 17.4 in June, pulling back from two consecutive strong readings. Economists had expected a reading of 22.3. The subcomponents were also weaker in June. The new-orders index fell 12.6 points to 16.3 in June, while shipments fell 15.5 points to 14.2. Unfilled orders dropped 13.5 points to 7.9. Inventories fell 9.7 points to -2.6. The Empire State index is watched by analysts as an early hint of national trends.
Chart of the Week: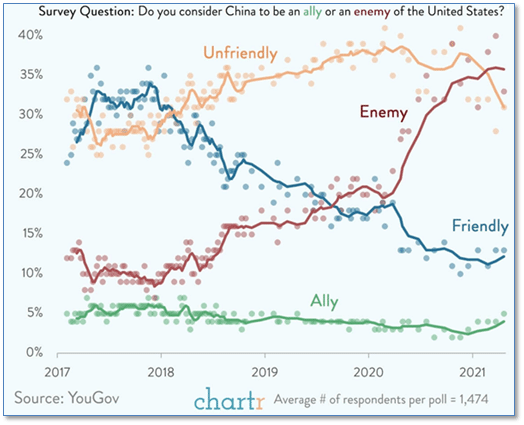
During the recent London G7 meetings, the United States’ top diplomat, Secretary of State Antony Blinken, rejected questions claiming the U.S. is entering a “cold war” with China.
The questions are not out of line with public opinion, however, as revealed in a recent poll.
Global public opinion and data company YouGov showed that in 2017 just 10% of respondents polled identified China as an “Enemy” of the U.S. Today, that number is closer to 35%, and is the most-selected choice, followed by “Unfriendly”. (Chart from chartr.co)
Riverbend Indicators:

Each week we post notable changes to the various market indicators we follow.
- As a reading of our Bull-Bear Indicator for U.S. Equities (comparative measurements over a rolling one-year timeframe), we remain in Cyclical Bull territory.
- Counting-up of the number of all our indicators that are ‘Up’ for U.S. Equities, the current tally is that four of four are Positive, representing a multitude of timeframes (two that can be solely days/weeks, or months+ at a time; another, a quarter at a time; and lastly, the {typically} years-long reading, that being the Cyclical Bull or Bear status).
The Week Ahead: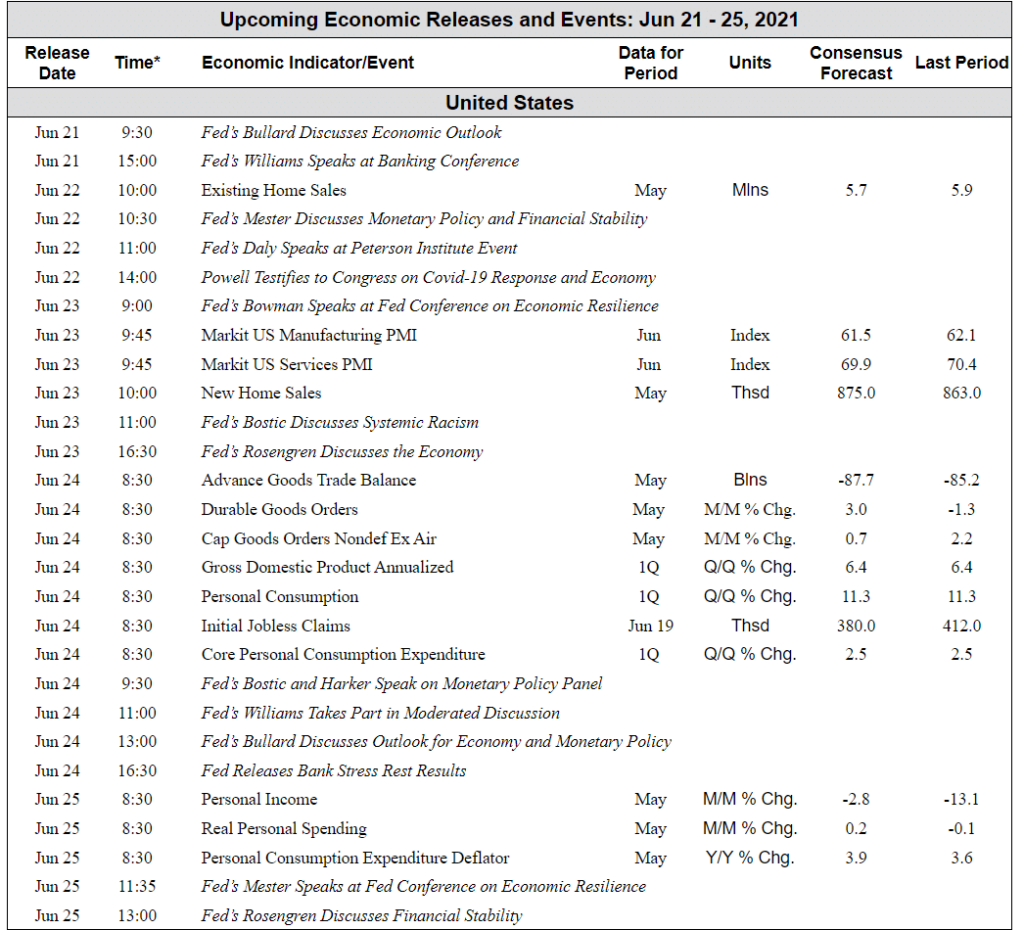
Source: Bloomberg, TD Economics
(Sources: All index- and returns-data from Yahoo Finance; news from Reuters, Barron’s, Wall St. Journal, Bloomberg.com, ft.com, guggenheimpartners.com, zerohedge.com, ritholtz.com, markit.com, financialpost.com, Eurostat, Statistics Canada, Yahoo! Finance, stocksandnews.com, marketwatch.com, wantchinatimes.com, BBC, 361capital.com, pensionpartners.com, cnbc.com, FactSet.)
[/fusion_text][/fusion_builder_column][/fusion_builder_row][/fusion_builder_container]


