[fusion_builder_container hundred_percent=”no” equal_height_columns=”no” menu_anchor=”” hide_on_mobile=”small-visibility,medium-visibility,large-visibility” class=”” id=”” background_color=”” background_image=”” background_position=”center center” background_repeat=”no-repeat” fade=”no” background_parallax=”none” parallax_speed=”0.3″ video_mp4=”” video_webm=”” video_ogv=”” video_url=”” video_aspect_ratio=”16:9″ video_loop=”yes” video_mute=”yes” overlay_color=”” video_preview_image=”” border_size=”” border_color=”” border_style=”solid” padding_top=”” padding_bottom=”” padding_left=”” padding_right=””][fusion_builder_row][fusion_builder_column type=”1_6″ layout=”1_6″ spacing=”” center_content=”no” link=”” target=”_self” min_height=”” hide_on_mobile=”small-visibility,medium-visibility,large-visibility” class=”” id=”” hover_type=”none” border_size=”0″ border_color=”” border_style=”solid” border_position=”all” box_shadow=”no” box_shadow_blur=”0″ box_shadow_spread=”0″ box_shadow_color=”” box_shadow_style=”” background_type=”single” gradient_start_position=”0″ gradient_end_position=”100″ gradient_type=”linear” radial_direction=”center” linear_angle=”180″ background_color=”” background_image=”” background_image_id=”” background_position=”left top” background_repeat=”no-repeat” background_blend_mode=”none” animation_type=”” animation_direction=”left” animation_speed=”0.3″ animation_offset=”” filter_type=”regular” filter_hue=”0″ filter_saturation=”100″ filter_brightness=”100″ filter_contrast=”100″ filter_invert=”0″ filter_sepia=”0″ filter_opacity=”100″ filter_blur=”0″ filter_hue_hover=”0″ filter_saturation_hover=”100″ filter_brightness_hover=”100″ filter_contrast_hover=”100″ filter_invert_hover=”0″ filter_sepia_hover=”0″ filter_opacity_hover=”100″ filter_blur_hover=”0″ last=”no”][/fusion_builder_column][fusion_builder_column type=”2_3″ layout=”1_1″ background_position=”left top” background_color=”” border_size=”” border_color=”” border_style=”solid” border_position=”all” spacing=”yes” background_image=”” background_repeat=”no-repeat” padding_top=”” padding_right=”” padding_bottom=”” padding_left=”” margin_top=”0px” margin_bottom=”0px” class=”” id=”” animation_type=”” animation_speed=”0.3″ animation_direction=”left” hide_on_mobile=”small-visibility,medium-visibility,large-visibility” center_content=”no” last=”no” min_height=”” hover_type=”none” link=””][fusion_text]
[/fusion_text][fusion_vimeo id=”538806741″ alignment=”center” width=”1000″ height=”” autoplay=”false” api_params=”” hide_on_mobile=”small-visibility,medium-visibility,large-visibility” class=”” css_id=”” /][fusion_text]
U.S. Markets: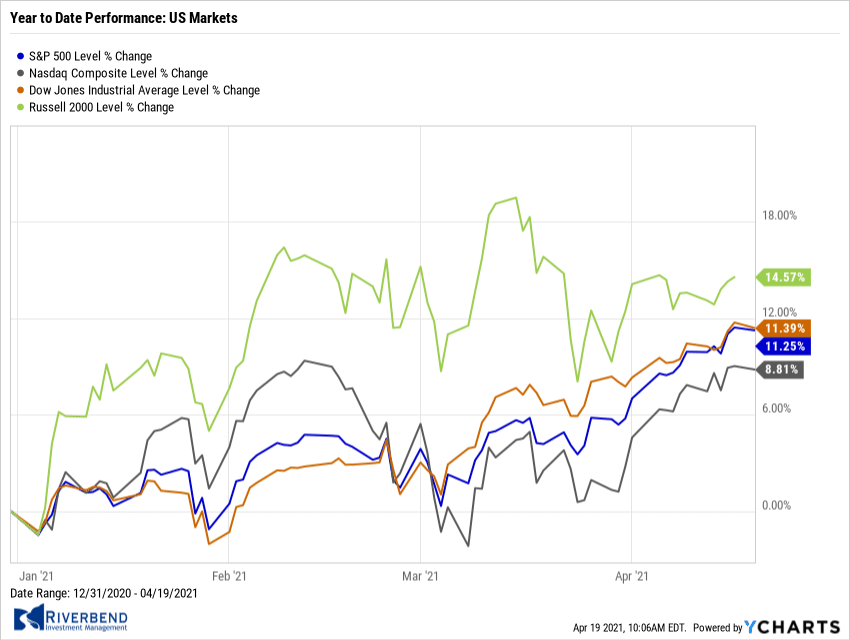
Most of the major U.S. benchmarks recorded their fourth consecutive week of gains and some moved to new record highs. The Dow Jones Industrial Average added 400 points and finished the week at 34,200, a gain of 1.2%.
The technology-heavy NASDAQ Composite gained 1.1%.
By market cap, the large-cap S&P 500 rose 1.4%, while the mid-cap S&P 400 and small-cap Russell 2000 gained 1.9% and 0.9%, respectively.
International Markets:
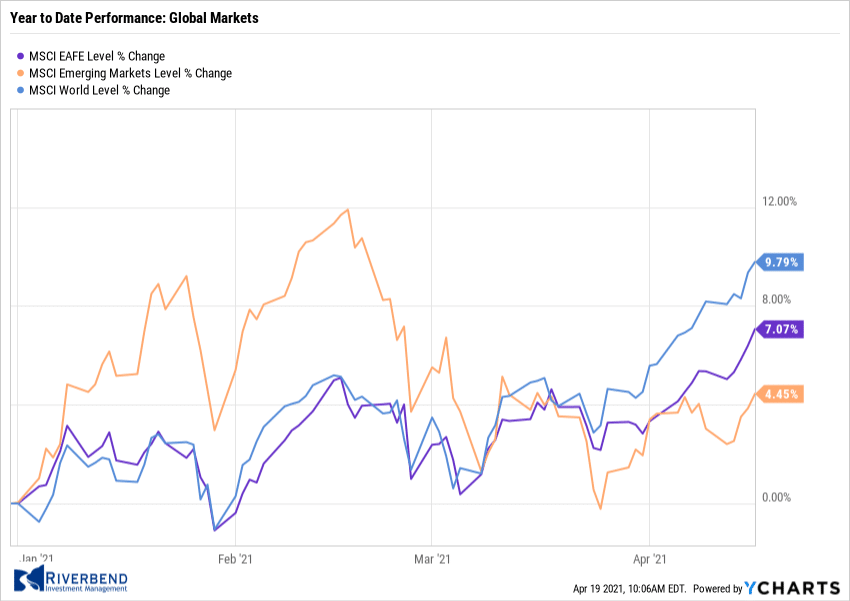
European markets were mostly up while major Asian markets declined. Canada’s TSX rose 0.6%, while the United Kingdom’s FTSE 100 added 1.5%. France’s CAC 40 and Germany’s DAX gained 1.9% and 1.5%, respectively.
In Asia, Japan’s Nikkei gave up -0.3%, while China’s Shanghai Composite declined -0.7%.
As grouped by Morgan Stanley Capital International, emerging markets finished the week up 1.5%, while developed markets gained 1.7%.
Commodities: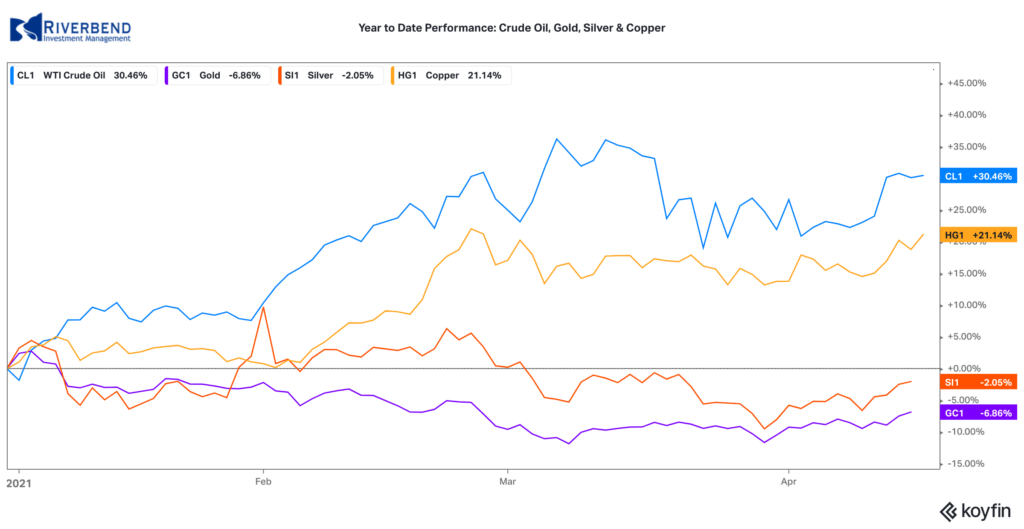
Precious metals had a second week of gains. Gold rose 2% to finish the week at $1780.20 per ounce, while Silver rose 3.1% to $26.10 an ounce.
Energy reversed last week’s entire decline and then some. West Texas Intermediate crude oil rose 6.5% to $63.19 per barrel.
The industrial metal copper, viewed by some analysts as a barometer of world economic health due to its wide variety of uses, finished up for a second week rising 3.2%.
U.S. Economic News: 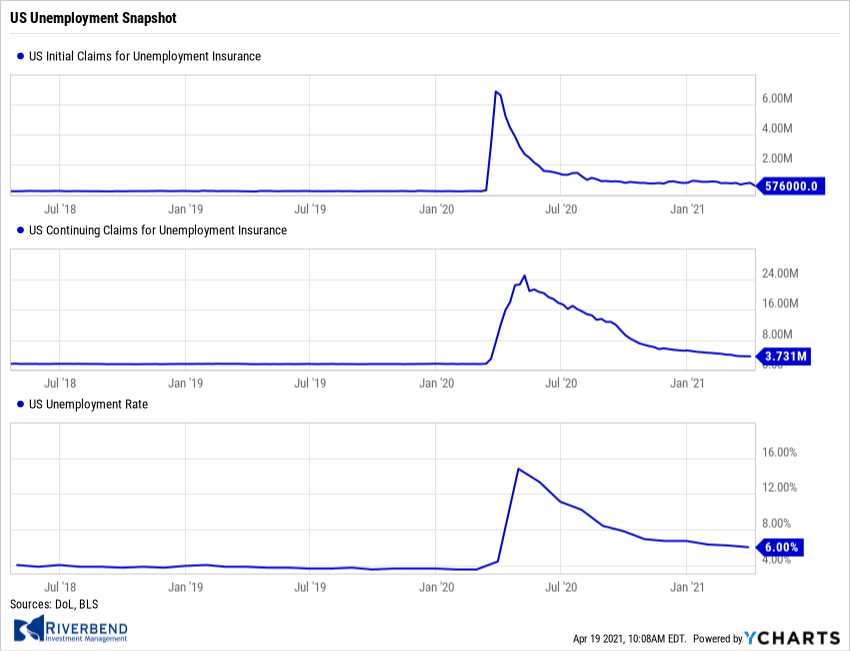
The number of Americans filing first-time unemployment benefits fell by 193,000 to a pandemic low of 576,000 last week—its largest decline since August. Economists had forecast new claims would total 710,000. However, the number of layoffs still has a lot further to decline to return to pre-crisis levels.
New claims had been running in the low 200,000s before the pandemic. Continuing claims, which count the number of Americans already receiving benefits, fell by 87,991 to 3.94 million. That number is also a pandemic low.
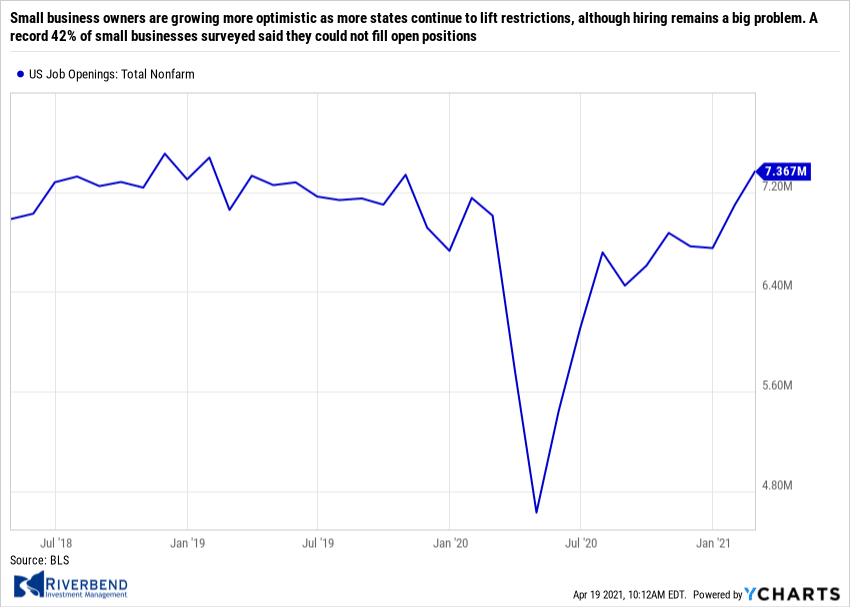
Small business owners are growing more optimistic as more states continue to lift restrictions, although hiring remains a big problem. The National Federation of Independent Businesses (NFIB) reported its sentiment survey for March climbed 2.4 points to 98.2 – a pandemic high – but owners remain cautious about the future. The index remains well below its pre-pandemic levels.
The NFIB index had hit an all-time high of 104.5 in February 2020, just a month before the pandemic took hold. The biggest reported problem is finding suitable workers. A record 42% of small businesses surveyed said they could not fill open positions. More than a quarter of companies said they increased pay to lure workers–the highest number in the past year.
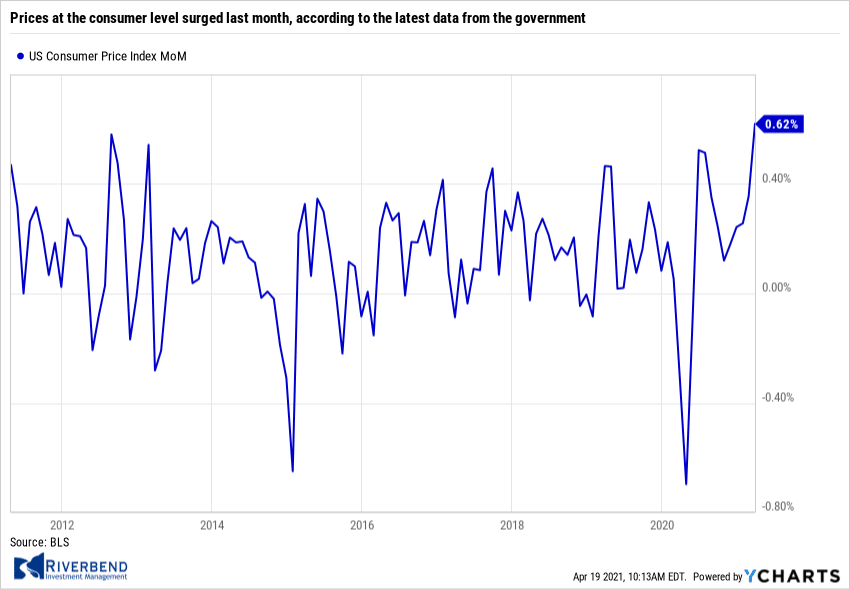 Prices at the consumer level surged last month, according to the latest data from the government. The Bureau of Labor Statistics reported the ‘consumer price index’ (CPI) jumped 0.6% last month, spearheaded by the rising cost of oil. Economists had forecast a 0.5% increase. The rate of inflation over the trailing year shot up to 2.6% from 1.7% in the prior month, marking the highest level since the fall of 2018. Prices increased for the fourth month in a row.
A sharp drop in coronavirus cases coupled with an economic recovery fueled by massive fiscal stimulus boosted demand for a wide variety of goods and services. Meanwhile, many key materials remain in short supply. This squeezes supply and demand from both sides. Federal Reserve policymakers insist any increase in inflation is likely to be mild and temporary.
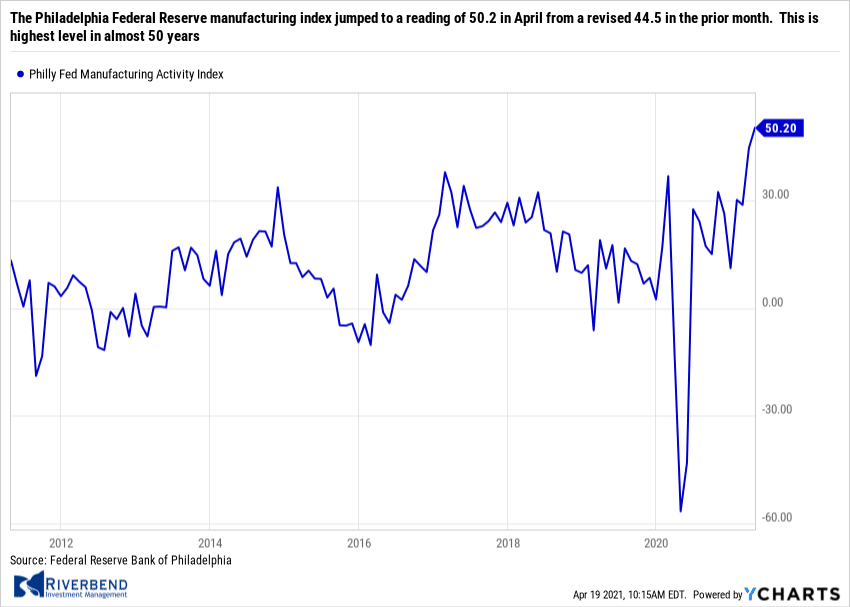 Two regional gauges of manufacturing sentiment showed strength in April, according to data released this week. The Philadelphia Federal Reserve manufacturing index jumped to a reading of 50.2 in April from a revised 44.5 in the prior month. This is highest level in almost 50 years. Economists had expected a reading of 42 after the initial reading for March of 51.8, according to a survey of economists.
Meanwhile, the New York Federal Reserve’s Empire State Index rose to a reading of 26.3 in April from 17.4 in March. That’s the highest reading since October 2017. Economists had expected a reading of 20. Manufacturing remains a bright spot in the pandemic. The two regional Fed surveys are used by economists to gauge the strength of the upcoming national ISM factory index, which will be released in early May. Last month, the ISM index jumped to 64.7%–its highest level since December 1983.
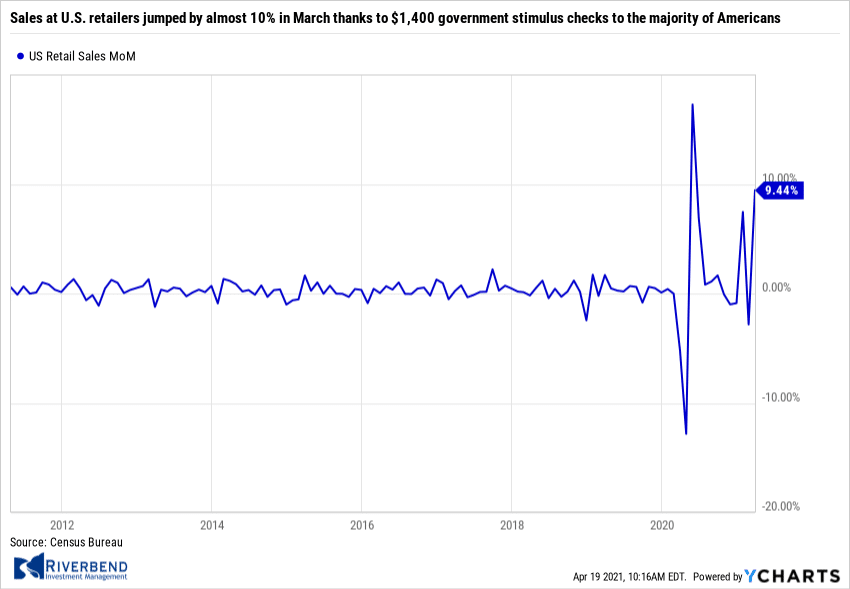 Sales at U.S. retailers jumped by almost 10% in March thanks to $1,400 government stimulus checks to the majority of Americans. The Census Bureau reported sales climbed by 9.8% last month, easily beating the consensus forecast of a 6.1% increase. The sales gain was the second largest on record, exceeded only by an 18% spike last May when a U.S. lockdown was lifted. The snapback in sales was widely expected after Washington approved a massive $1.9 trillion stimulus in early March.
Sales revved up 15% at car dealers even as automakers struggled to procure enough computer chips to maintain production (auto sales account for about 20% of all retail sales). Sales at gas stations also surged nearly 11%, reflecting rising oil prices and more Americans taking to the road as government coronavirus restrictions are lifted. “All in all, a very strong first half of the year for growth looks to be in the bag,” said chief economist Joshua Shapiro of MFR Inc. following the release.
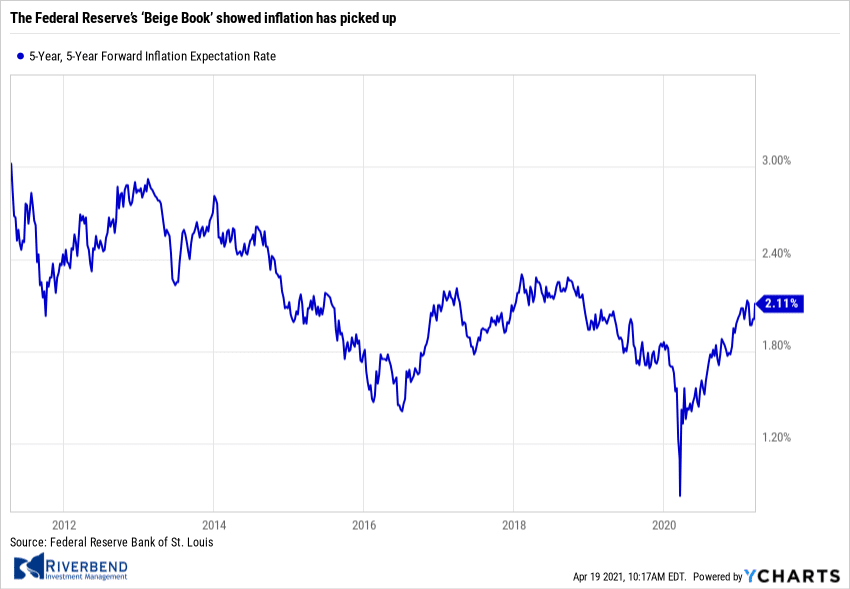 The Federal Reserve’s ‘Beige Book’, a collection of anecdotal reports from each of the Fed’s regional member banks, reported the U.S. economy grew faster in the early spring and more companies sought to hire new workers. However, the report also showed inflation has picked up. Companies paid more for lots of key supplies such as metals, fuel, food and lumber.
In some cases, supply shortages were also holding back production. “Businesses also expressed concern about rising inflation over the rest of the year,” the Boston Fed said. Senior economist Sal Guatieri of BMO Capital Markets stated, “The U.S. economy is accelerating, but also starting to fan prices.”
Chart of the Week:
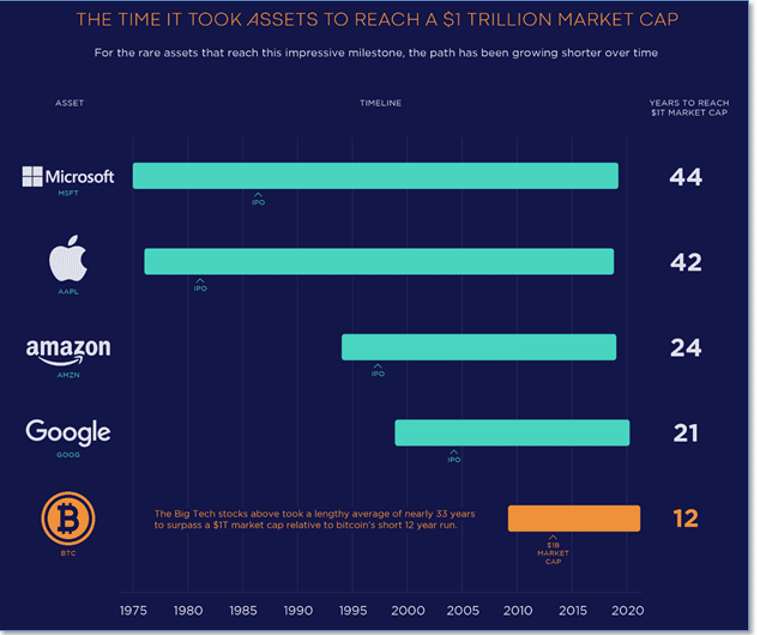
What took Microsoft 44 years, Apple 42 years, Amazon 24 years, and Google 21?
The answer: achieving a trillion-dollar market capitalization.
However, it took the Bitcoin cryptocurrency just 12 – the fastest ever.
At the beginning of 2021, Bitcoin had a market capitalization of $500 billion, but in just four months it has gained another $500 billion as tech CEO’s like Elon Musk and Jack Dorsey have made sizable investments, multiple exchange-traded funds are preparing to launch, the CoinBase cryptocurrency exchange has gone public, and many legacy financial institutions like PayPal, MasterCard, Visa, JP Morgan and the Bank of New York Mellon have come on board.
The only question now seems to be, “How long till the next trillion?” (Chart from visualcapitalist.com)
The Week Ahead
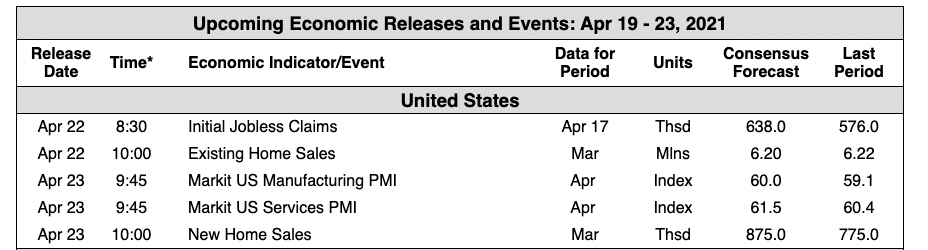
via Bloomberg, TD Economics
(Sources: All index- and returns-data from Yahoo Finance; news from Reuters, Barron’s, Wall St. Journal, Bloomberg.com, ft.com, guggenheimpartners.com, zerohedge.com, ritholtz.com, markit.com, financialpost.com, Eurostat, Statistics Canada, Yahoo! Finance, stocksandnews.com, marketwatch.com, wantchinatimes.com, BBC, 361capital.com, pensionpartners.com, cnbc.com, FactSet.)
[/fusion_text][/fusion_builder_column][fusion_builder_column type=”1_6″ layout=”1_6″ spacing=”” center_content=”no” link=”” target=”_self” min_height=”” hide_on_mobile=”small-visibility,medium-visibility,large-visibility” class=”” id=”” hover_type=”none” border_size=”0″ border_color=”” border_style=”solid” border_position=”all” border_radius=”” box_shadow=”no” dimension_box_shadow=”” box_shadow_blur=”0″ box_shadow_spread=”0″ box_shadow_color=”” box_shadow_style=”” padding_top=”” padding_right=”” padding_bottom=”” padding_left=”” margin_top=”” margin_bottom=”” background_type=”single” gradient_start_color=”” gradient_end_color=”” gradient_start_position=”0″ gradient_end_position=”100″ gradient_type=”linear” radial_direction=”center” linear_angle=”180″ background_color=”” background_image=”” background_image_id=”” background_position=”left top” background_repeat=”no-repeat” background_blend_mode=”none” animation_type=”” animation_direction=”left” animation_speed=”0.3″ animation_offset=”” filter_type=”regular” filter_hue=”0″ filter_saturation=”100″ filter_brightness=”100″ filter_contrast=”100″ filter_invert=”0″ filter_sepia=”0″ filter_opacity=”100″ filter_blur=”0″ filter_hue_hover=”0″ filter_saturation_hover=”100″ filter_brightness_hover=”100″ filter_contrast_hover=”100″ filter_invert_hover=”0″ filter_sepia_hover=”0″ filter_opacity_hover=”100″ filter_blur_hover=”0″ last=”no”][/fusion_builder_column][/fusion_builder_row][/fusion_builder_container]


