[fusion_builder_container hundred_percent=”no” equal_height_columns=”no” menu_anchor=”” hide_on_mobile=”small-visibility,medium-visibility,large-visibility” class=”” id=”” background_color=”” background_image=”” background_position=”center center” background_repeat=”no-repeat” fade=”no” background_parallax=”none” parallax_speed=”0.3″ video_mp4=”” video_webm=”” video_ogv=”” video_url=”” video_aspect_ratio=”16:9″ video_loop=”yes” video_mute=”yes” overlay_color=”” video_preview_image=”” border_size=”” border_color=”” border_style=”solid” padding_top=”” padding_bottom=”” padding_left=”” padding_right=””][fusion_builder_row][fusion_builder_column type=”1_1″ layout=”1_1″ background_position=”left top” background_color=”” border_size=”” border_color=”” border_style=”solid” border_position=”all” spacing=”yes” background_image=”” background_repeat=”no-repeat” padding_top=”” padding_right=”” padding_bottom=”” padding_left=”” margin_top=”0px” margin_bottom=”0px” class=”” id=”” animation_type=”” animation_speed=”0.3″ animation_direction=”left” hide_on_mobile=”small-visibility,medium-visibility,large-visibility” center_content=”no” last=”no” min_height=”” hover_type=”none” link=””][fusion_text]
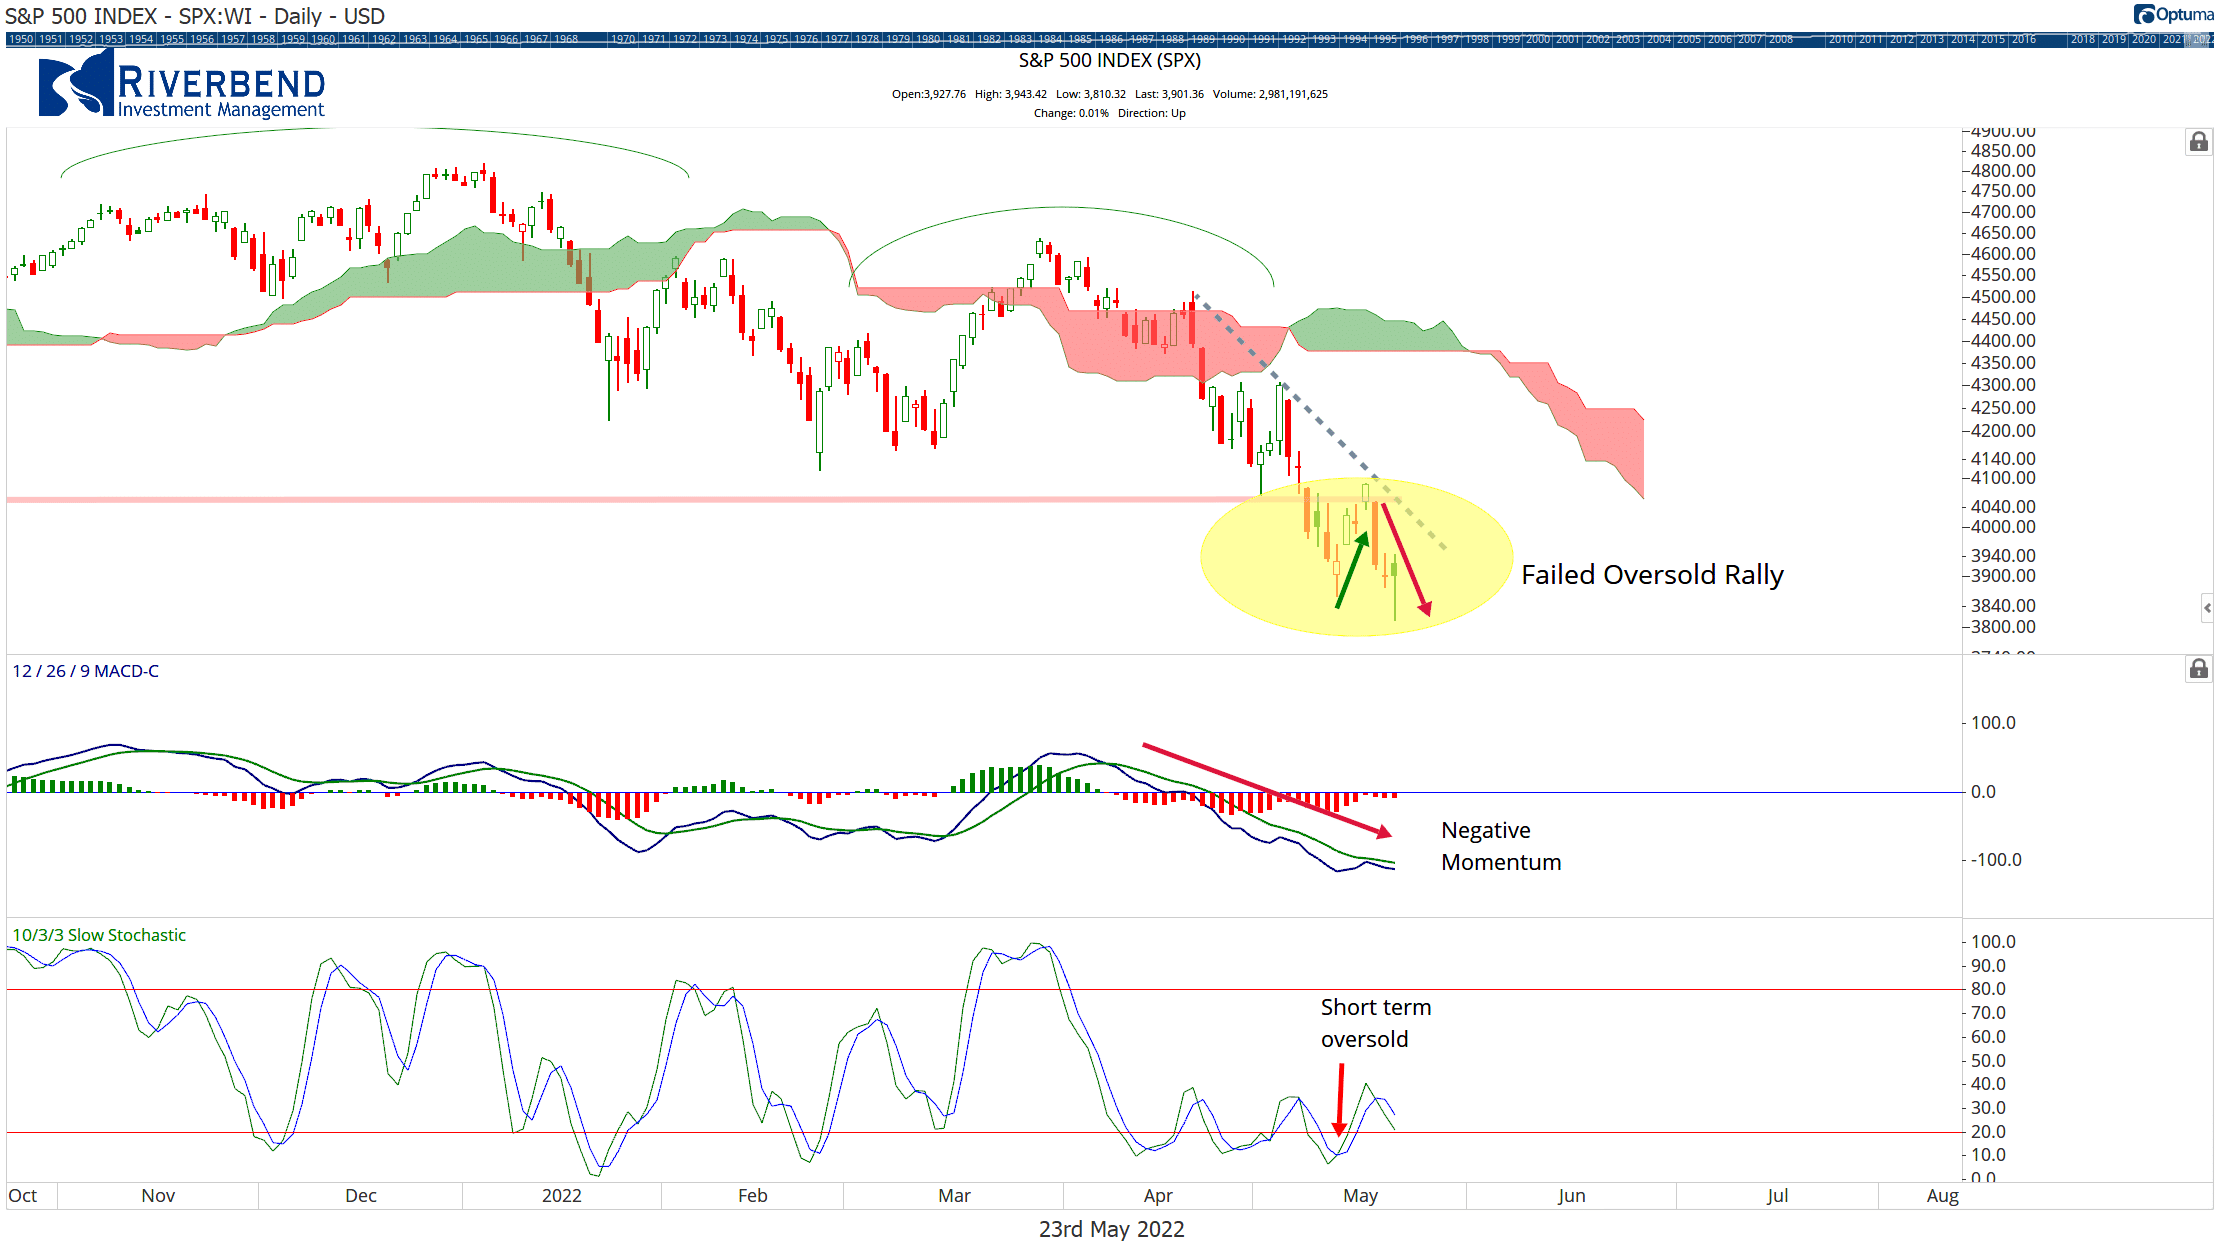
Last week we saw some extra volatility in the market as short-term traders tried to take advantage of the oversold conditions of the US stock market.
The S&P 500 gained 4% during a three-day mini-rally, only to give back the entire gain mid-week.
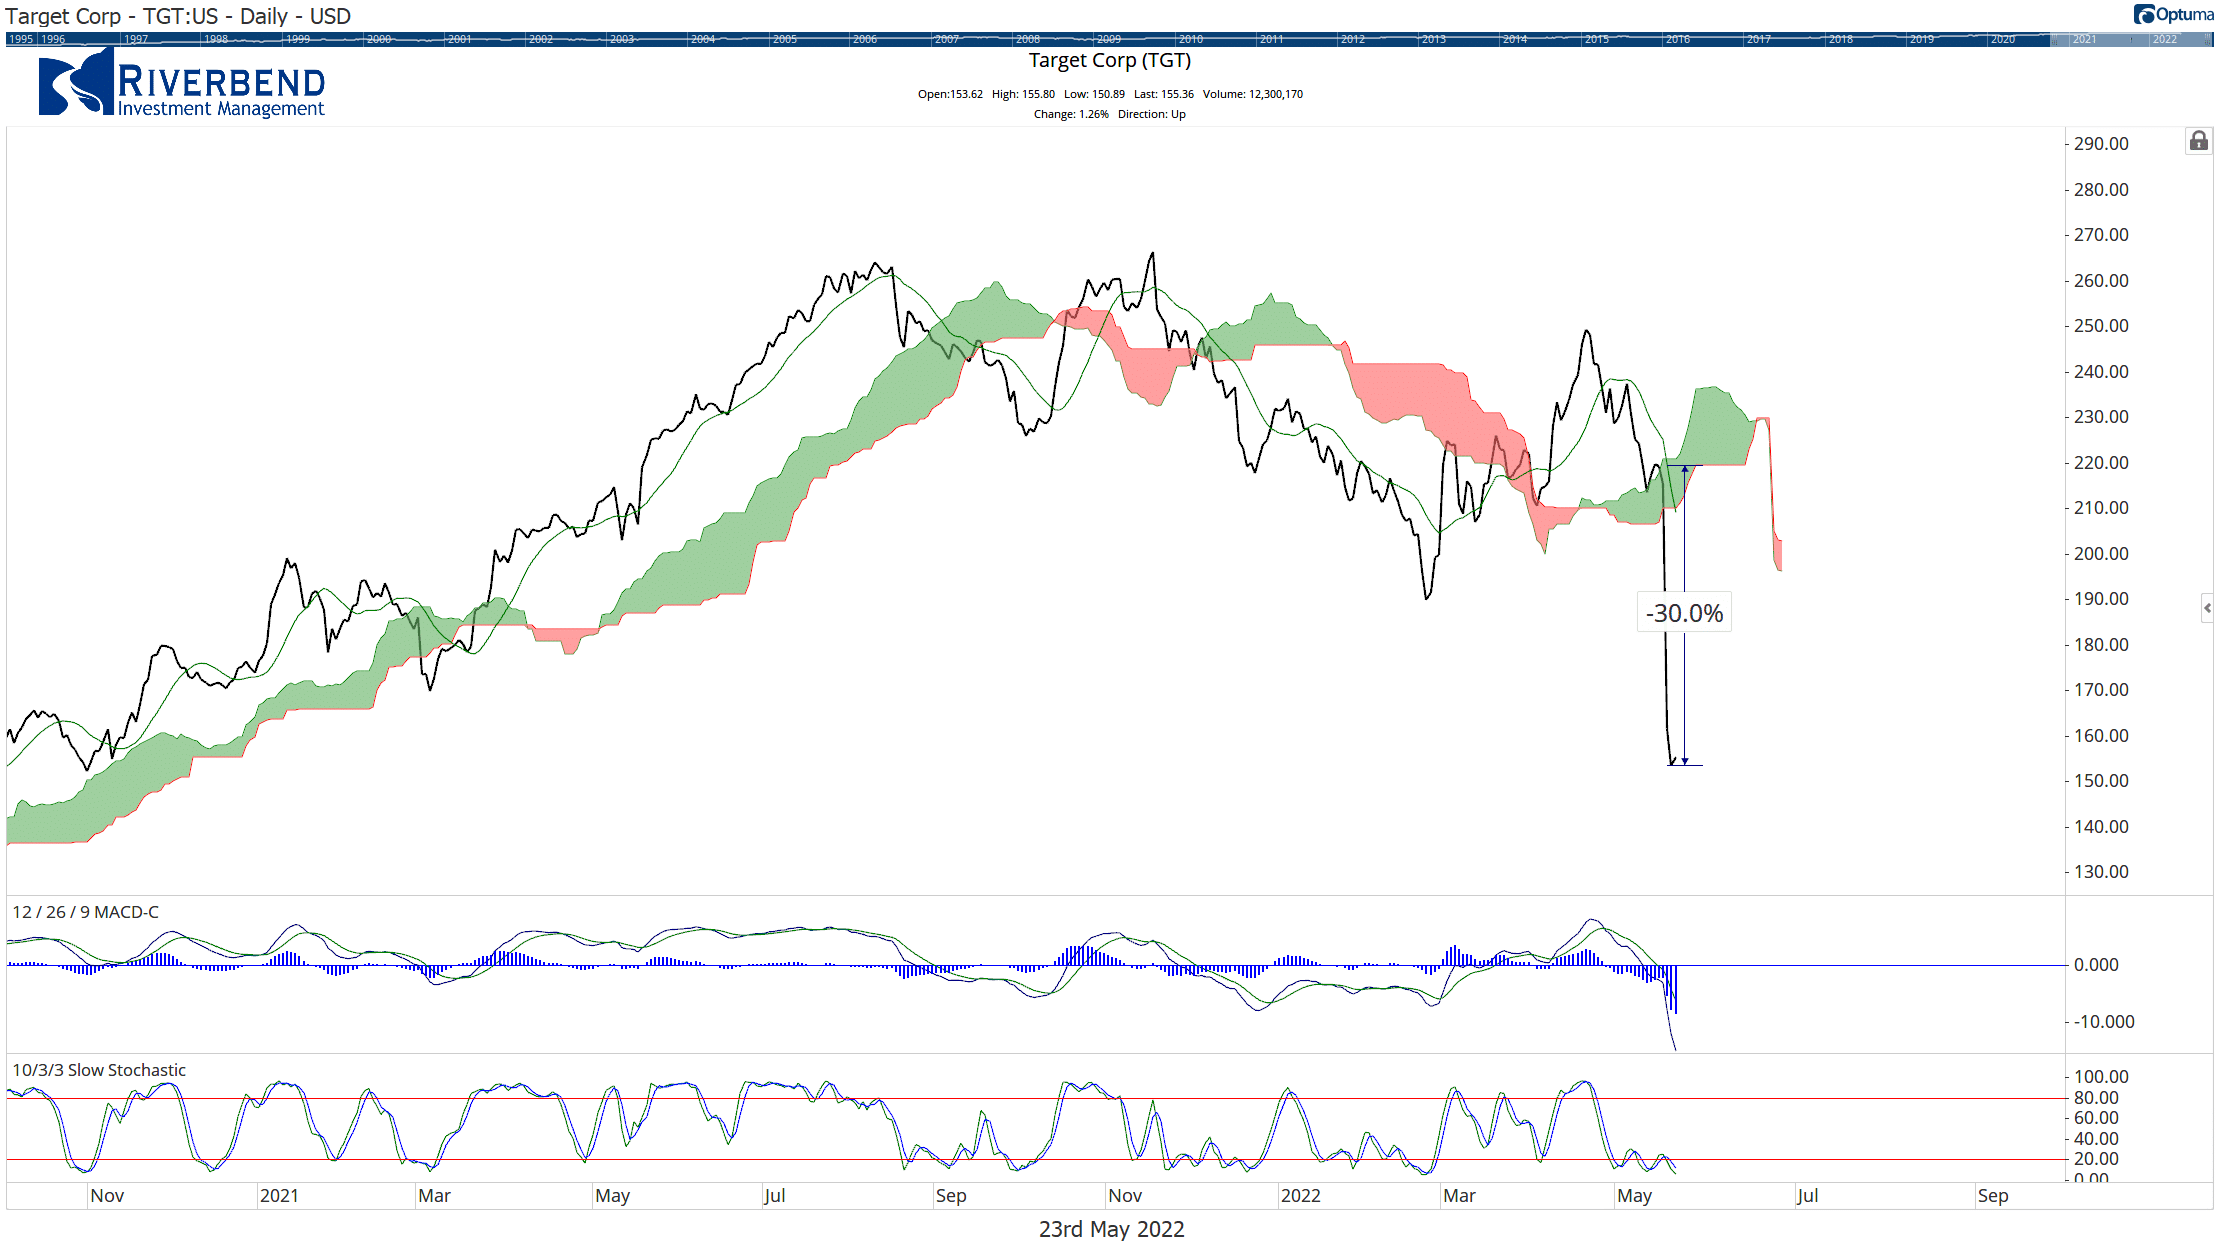
Investors also got a first-hand look at the impact high fuel costs are having on retailers.
Last week, Target reported that its transportation costs exceeded $1 billion.
Additionally, Target CEO Brian Cornell said inflation is starting to have an increasing impact on earnings and that “overall costs have been rising much faster than retail prices.”
As a result, Target’s stock price dropped more than 30% last week.
Looking forward, investors are awaiting the Federal Reserve’s next meeting on June 14-15th.
The market is expecting another .50% rate hike. However, investors will be more interested in what the Fed’s forecast is for the second half of 2022.
Until then, I expect we will see additional volatility around inflation data points as short-term traders try to guess what the Fed will say next.
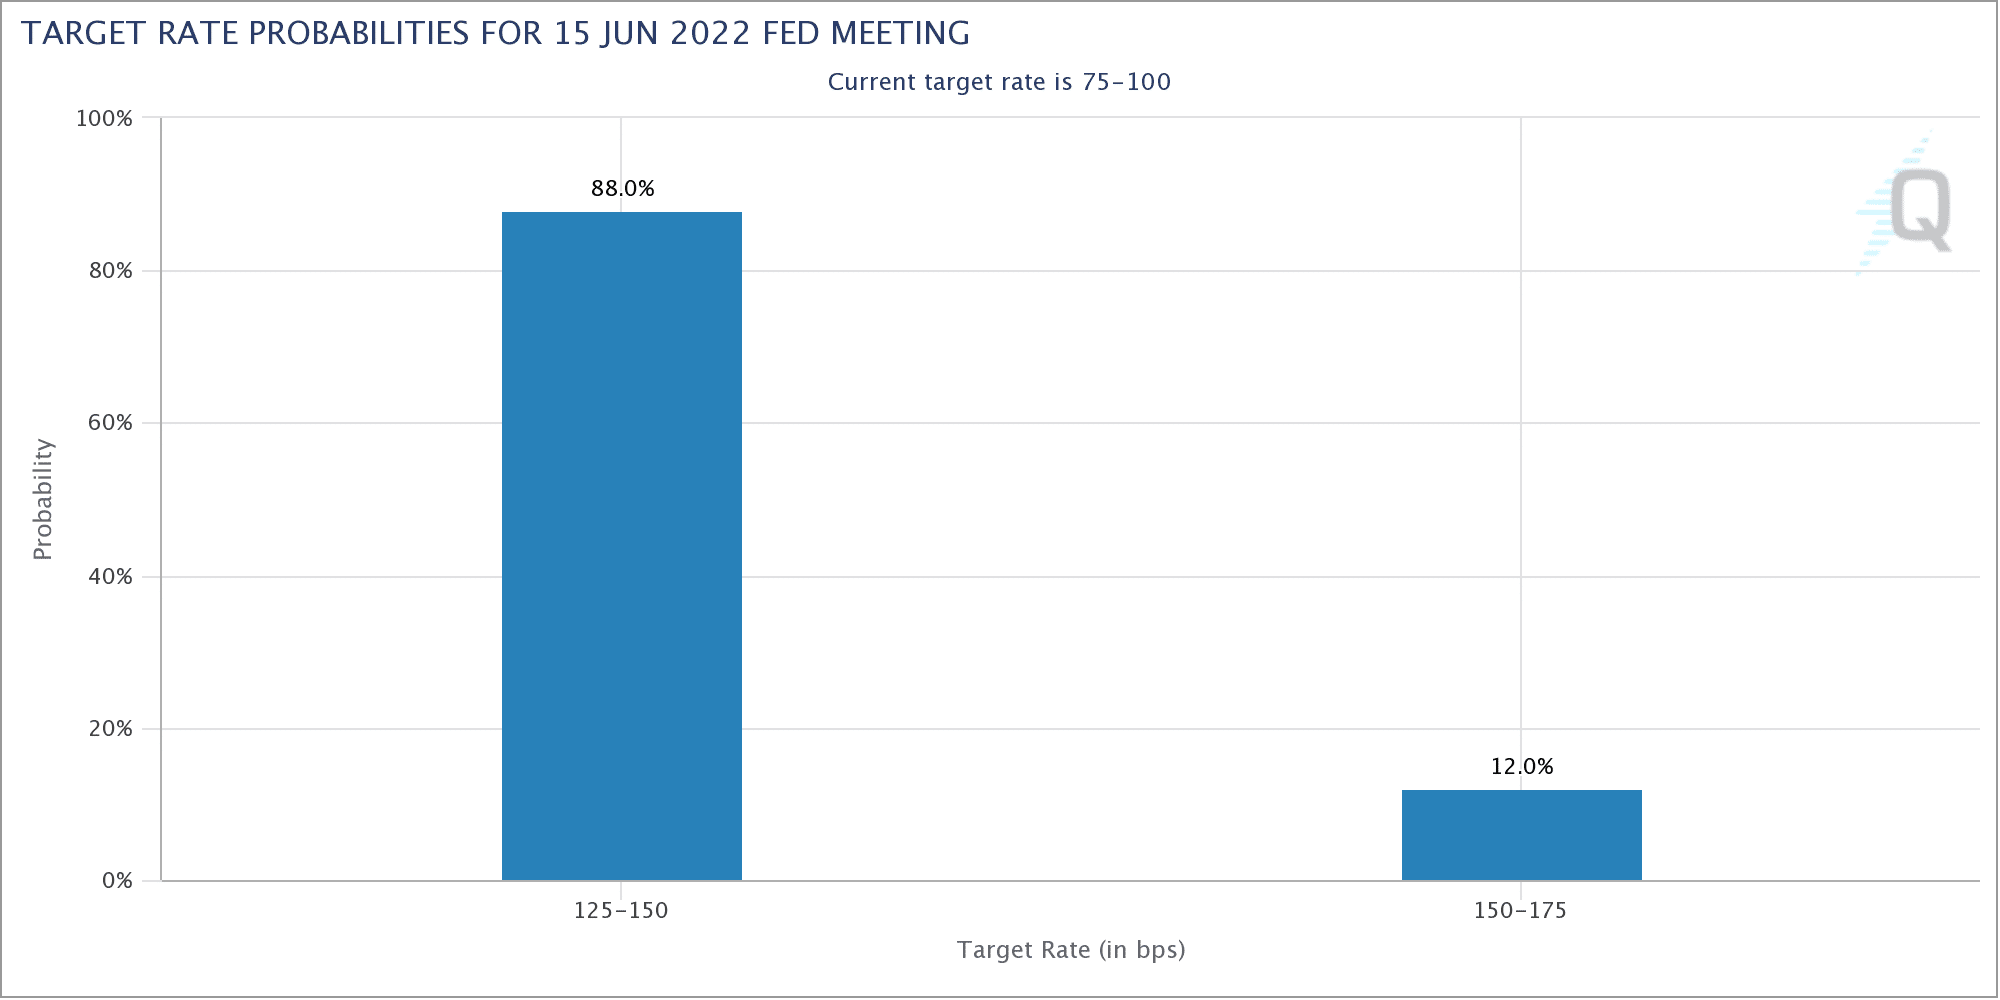
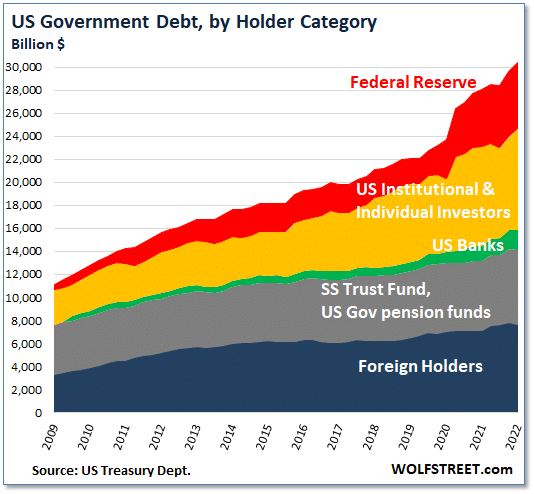
Chart of the Week:
The U.S. gross national debt has now reached $30.4 trillion, following a massive $7.0 trillion spike since the coronavirus pandemic took hold in March 2020.
Every one of these debt securities had to be purchased and held by an entity such as a bank, a pension fund, a foreign government, or even an individual investor.
So, who exactly is holding $30.4 trillion of Treasury securities? Wolf Richter at Wolfstreet.com parsed the data and created a below graph to explain.
In short, while foreign holdings of U.S. Treasuries have declined from 34% in 2016 to just 25% now, both the Federal Reserve and U.S. institutional and individual investors have picked up the slack and expanded their buying. The Federal Reserve now holds 19% of all government debt.
Riverbend Indicators:
- As a reading of our Bull-Bear Indicator for U.S. Equities (comparative measurements over a rolling one-year timeframe), we remain in Cyclical Bull territory.
- Counting up the number of all our indicators that are ‘Up’ for U.S. Equities, the current tally is that one of four is Positive (suggesting a short term bounce), representing a multitude of timeframes (two that can be solely days/weeks, or months+ at a time; another, a quarter at a time; and lastly, the {typically} years-long reading, that being the Cyclical Bull or Bear status).
The Week Ahead:
[/fusion_text][/fusion_builder_column][/fusion_builder_row][/fusion_builder_container]


