[fusion_builder_container hundred_percent=”no” equal_height_columns=”no” menu_anchor=”” hide_on_mobile=”small-visibility,medium-visibility,large-visibility” class=”” id=”” background_color=”” background_image=”” background_position=”center center” background_repeat=”no-repeat” fade=”no” background_parallax=”none” parallax_speed=”0.3″ video_mp4=”” video_webm=”” video_ogv=”” video_url=”” video_aspect_ratio=”16:9″ video_loop=”yes” video_mute=”yes” overlay_color=”” video_preview_image=”” border_size=”” border_color=”” border_style=”solid” padding_top=”” padding_bottom=”” padding_left=”” padding_right=””][fusion_builder_row][fusion_builder_column type=”1_1″ layout=”1_1″ background_position=”left top” background_color=”” border_size=”” border_color=”” border_style=”solid” border_position=”all” spacing=”yes” background_image=”” background_repeat=”no-repeat” padding_top=”” padding_right=”” padding_bottom=”” padding_left=”” margin_top=”0px” margin_bottom=”0px” class=”” id=”” animation_type=”” animation_speed=”0.3″ animation_direction=”left” hide_on_mobile=”small-visibility,medium-visibility,large-visibility” center_content=”no” last=”no” min_height=”” hover_type=”none” link=””][fusion_text]
Last week, we saw continued volatility and declines within the US stock market. At one point, NASDAQ was down 5% for just the week, before recovering a bit on positive earnings from Apple.
The big question is what’s next?
This decline (so far) seems to be more about deleveraging vs outright panic.
With years of extremely low interest rates, portfolio borrowing has skyrocketed to incredible levels – even higher than the peak of the 2000 and 2007 stock market cycle:
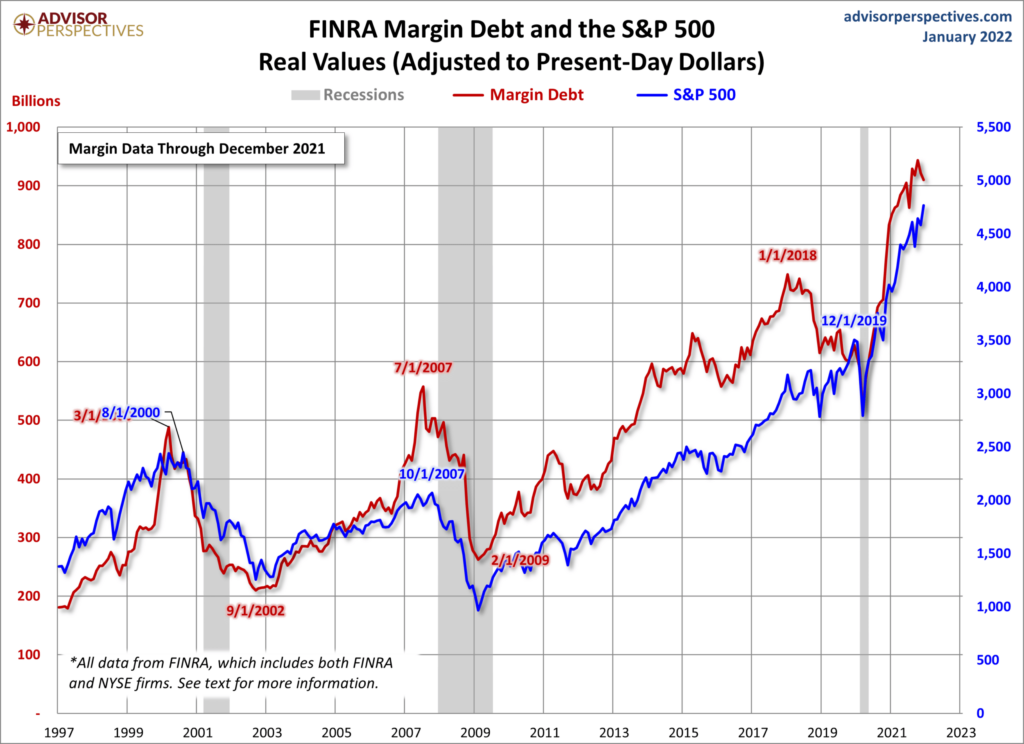
As the Fed has indicated they will begin to raise interest rates shortly, leveraged investors will begin to see their borrowing costs rise.
Additionally, many of these leveraged portfolios are heavily invested in technology stocks. Typically, as interest rates rise, the future valuations of these companies are reduced by Wall Street research firms.
In other words, tech stocks tend to not do well in a rising rate environment.
The current decline within equities, in my opinion, is more about the reduction of this margin debt due to rising borrowing costs and a shift away from growth stocks.
I am not seeing a panic-like rush into safe-haven asset classes…yet.
If investors become spooked by the added volatility from this deleveraging event, we may see a very quick, and potentially significant drop, in the stock market.
However, I don’t think we are at a panic stage yet. Typically, longer duration bonds do well when US equity investors are panicked.
For example, during the COVID caused decline of 2020, long-duration bonds were a safe haven for investors:
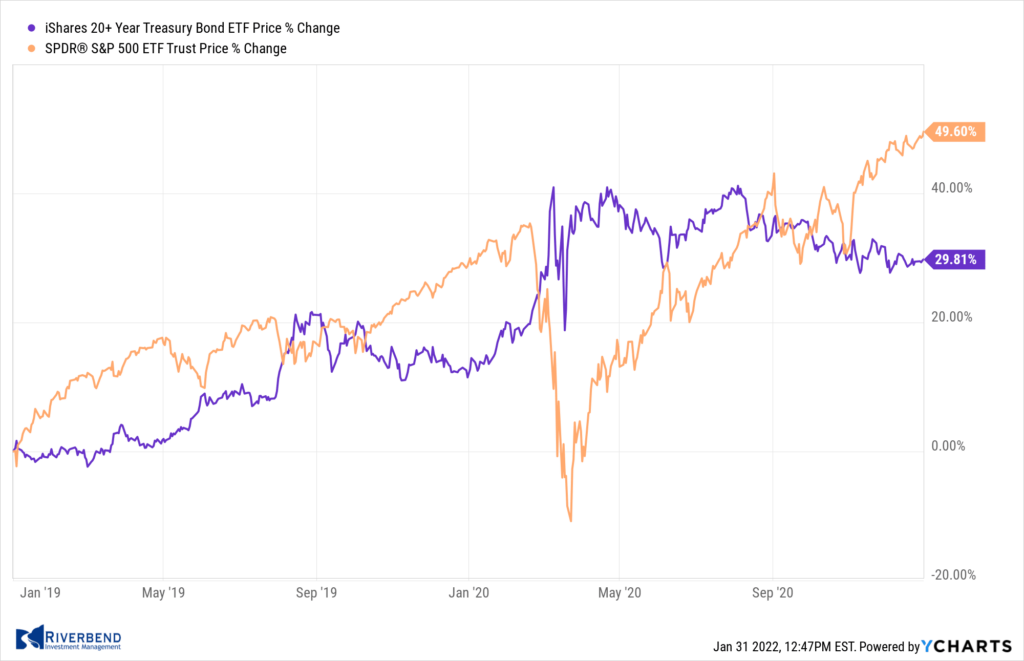
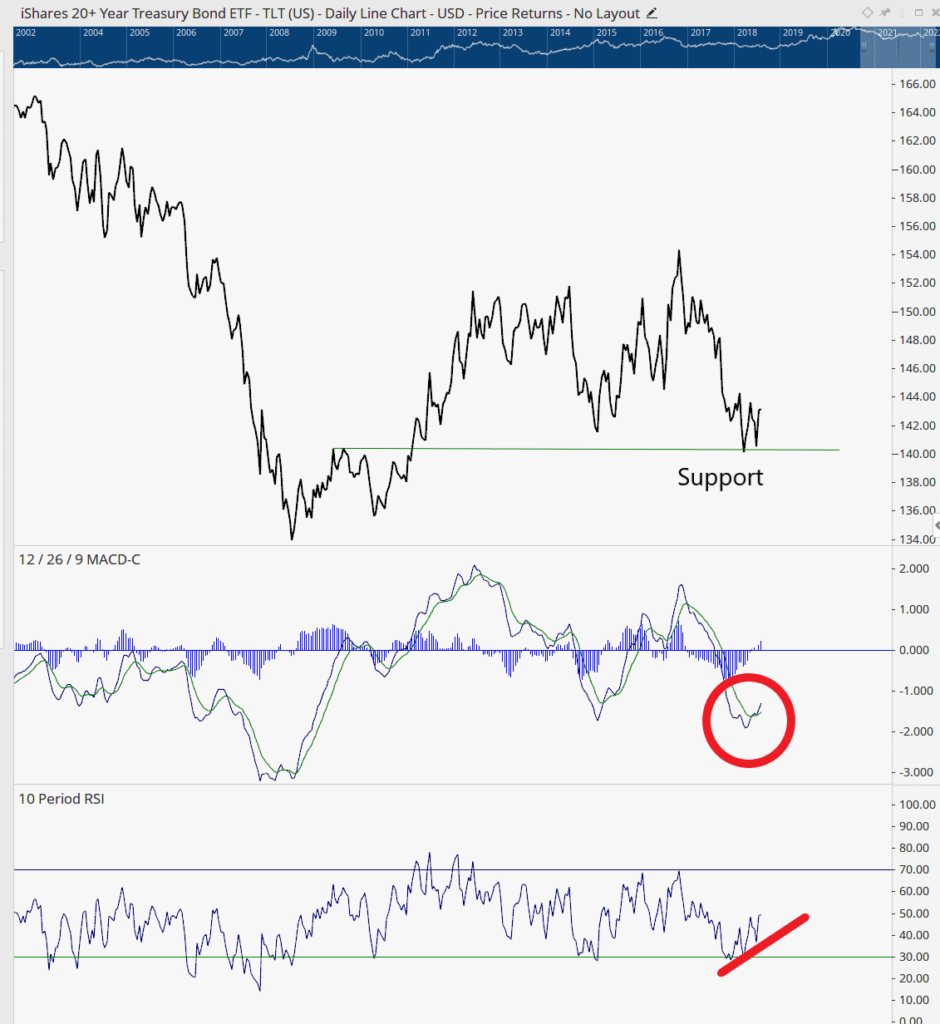
So far, we are not seeing the typical flight to safety. Long-duration bonds are currently sitting at their support level with not much activity.
Of note – this is a favorable risk-reward trade. If investors start to flee the market, long-duration investment vehicles, like the TLT ETF, may begin to rise: (Disclosure: I and/or my clients are long TLT).
I expect we will see a trading bounce in the market, as the major indices are oversold. But for the market to regain the confidence of investors we really need to see the S&P 500 trade above its 50 and 200 day moving averages.
For now, I am carefully watching individual sectors to see if this short-term bounce has the potential to become the start of a recovery within equities.
Chart of the Week:
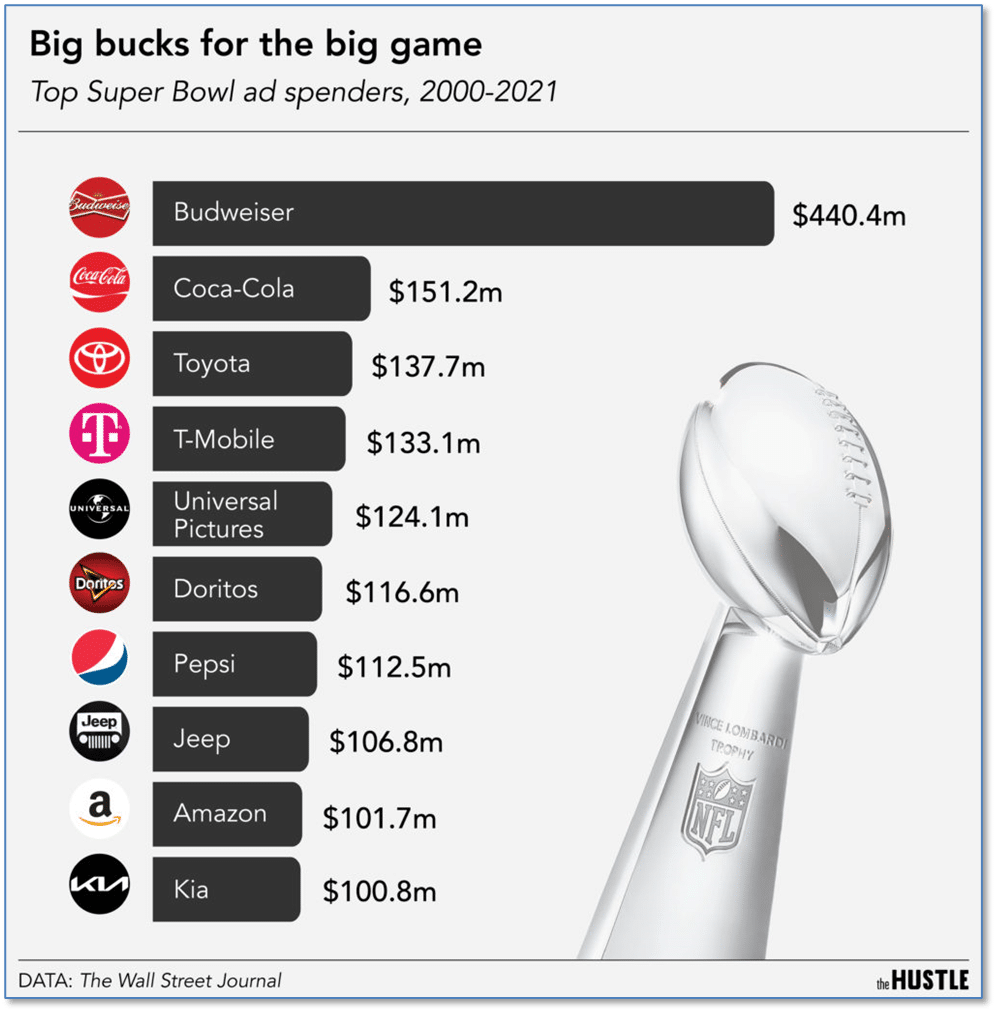
Super Bowl 56 will kick off on February 13th at SoFi Stadium in Los Angeles, California. And while it’s safe to say the majority of viewers will be football fans, there are also a significant number that tune in just for the commercials.
This year, the average price for a 30-second Super Bowl ad slot is up over 18% to $6.5 million!
Most veteran viewers would guess that Budweiser is a top advertiser, and perhaps that Coca-Cola was up there, too.
But many of the other top-10 advertisers over the last 20 years would be a surprise. Doritos, anyone?
Riverbend Indicators:

- As a reading of our Bull-Bear Indicator for U.S. Equities (comparative measurements over a rolling one-year timeframe), we remain in Cyclical Bull territory.
- Counting up of the number of all our indicators that are ‘Up’ for U.S. Equities, the current tally is that two of four are Positive, representing a multitude of timeframes (two that can be solely days/weeks, or months+ at a time; another, a quarter at a time; and lastly, the {typically} years-long reading, that being the Cyclical Bull or Bear status).
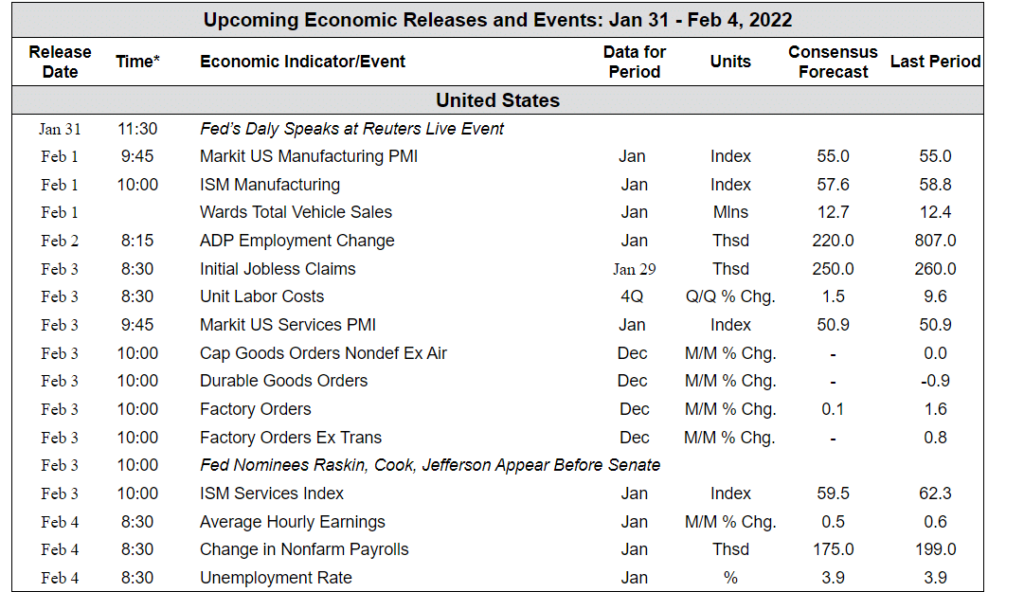
The Week Ahead:
[/fusion_text][/fusion_builder_column][/fusion_builder_row][/fusion_builder_container]


