[fusion_builder_container hundred_percent=”no” equal_height_columns=”no” menu_anchor=”” hide_on_mobile=”small-visibility,medium-visibility,large-visibility” class=”” id=”” background_color=”” background_image=”” background_position=”center center” background_repeat=”no-repeat” fade=”no” background_parallax=”none” parallax_speed=”0.3″ video_mp4=”” video_webm=”” video_ogv=”” video_url=”” video_aspect_ratio=”16:9″ video_loop=”yes” video_mute=”yes” overlay_color=”” video_preview_image=”” border_size=”” border_color=”” border_style=”solid” padding_top=”” padding_bottom=”” padding_left=”” padding_right=””][fusion_builder_row][fusion_builder_column type=”1_6″ layout=”1_6″ spacing=”” center_content=”no” link=”” target=”_self” min_height=”” hide_on_mobile=”small-visibility,medium-visibility,large-visibility” class=”” id=”” hover_type=”none” border_size=”0″ border_color=”” border_style=”solid” border_position=”all” border_radius=”” box_shadow=”no” dimension_box_shadow=”” box_shadow_blur=”0″ box_shadow_spread=”0″ box_shadow_color=”” box_shadow_style=”” padding_top=”” padding_right=”” padding_bottom=”” padding_left=”” margin_top=”” margin_bottom=”” background_type=”single” gradient_start_color=”” gradient_end_color=”” gradient_start_position=”0″ gradient_end_position=”100″ gradient_type=”linear” radial_direction=”center” linear_angle=”180″ background_color=”” background_image=”” background_image_id=”” background_position=”left top” background_repeat=”no-repeat” background_blend_mode=”none” animation_type=”” animation_direction=”left” animation_speed=”0.3″ animation_offset=”” filter_type=”regular” filter_hue=”0″ filter_saturation=”100″ filter_brightness=”100″ filter_contrast=”100″ filter_invert=”0″ filter_sepia=”0″ filter_opacity=”100″ filter_blur=”0″ filter_hue_hover=”0″ filter_saturation_hover=”100″ filter_brightness_hover=”100″ filter_contrast_hover=”100″ filter_invert_hover=”0″ filter_sepia_hover=”0″ filter_opacity_hover=”100″ filter_blur_hover=”0″ last=”no”][/fusion_builder_column][fusion_builder_column type=”2_3″ layout=”1_1″ background_position=”left top” background_color=”” border_size=”” border_color=”” border_style=”solid” border_position=”all” spacing=”yes” background_image=”” background_repeat=”no-repeat” padding_top=”” padding_right=”” padding_bottom=”” padding_left=”” margin_top=”0px” margin_bottom=”0px” class=”” id=”” animation_type=”” animation_speed=”0.3″ animation_direction=”left” hide_on_mobile=”small-visibility,medium-visibility,large-visibility” center_content=”no” last=”no” min_height=”” hover_type=”none” link=””][fusion_text]
[/fusion_text][fusion_vimeo id=”547571357″ alignment=”center” width=”1000″ height=”” autoplay=”false” api_params=”” hide_on_mobile=”small-visibility,medium-visibility,large-visibility” class=”” css_id=”” /][fusion_text]
U.S. Markets: 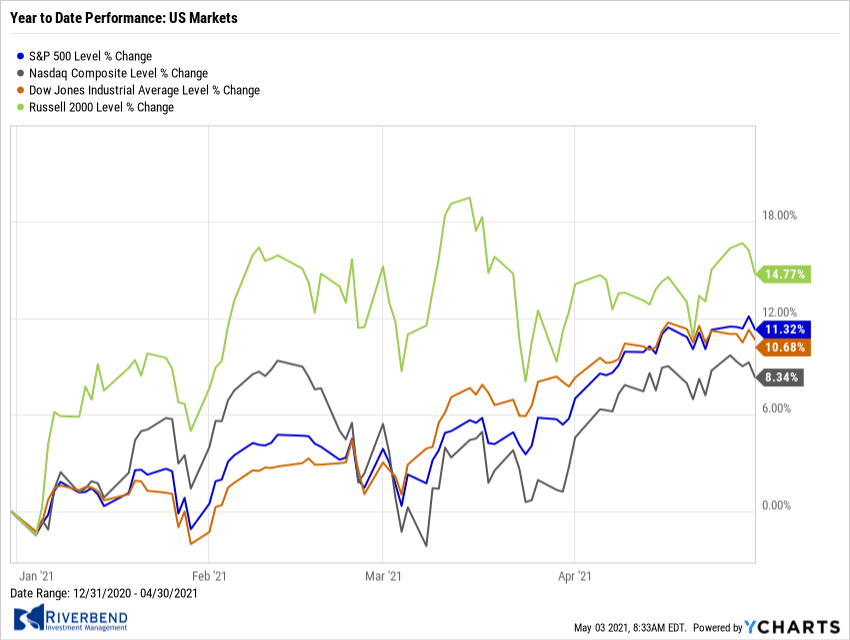
The major U.S. indexes finished the week mixed as a rally on Friday erased most losses from earlier in the week.
The narrowly-focused Dow Jones Industrial Average fared the best, while the technology-heavy NASDAQ Composite index recorded its worst weekly loss in two months.
The Dow Jones Industrial Average rallied over 900 points finishing the week at 34,778, a gain of 2.7%. The Nasdaq Composite finished the week down -1.5%.
By market cap, the large cap S&P 500 rose 1.2%, while the mid cap S&P 400 gained 1.7%. The small cap Russell 2000 added just 0.2%.
International Markets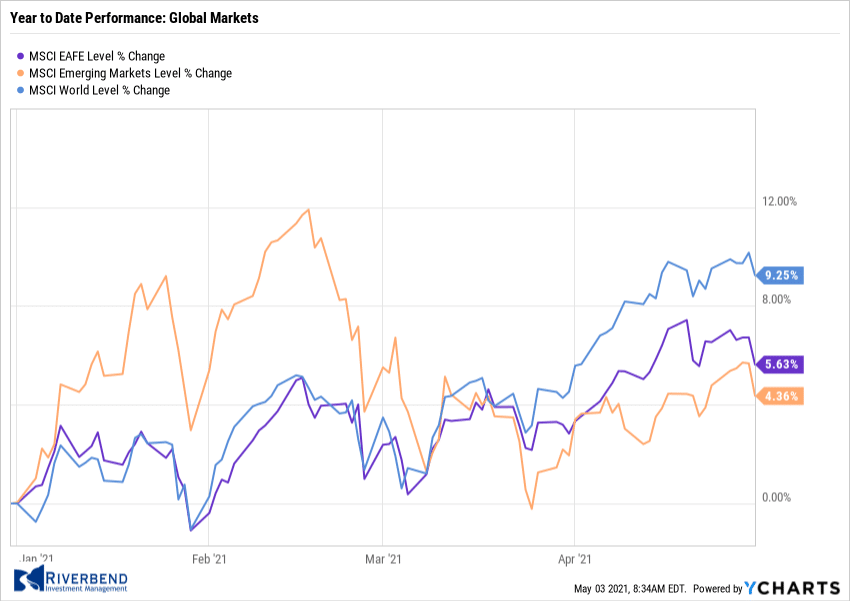
The majority of major international markets finished the week to the upside.
Canada’s TSX rose 1.9%, while the United Kingdom’s FTSE 100 rallied 2.3%. France’s CAC 40 and Germany’s DAX added 1.9% and 1.7%, respectively.
In Asia, China’s Shanghai Composite shed -0.8%, while Japan’s Nikkei gained 1.9%.
As grouped by Morgan Stanley Capital International, developed markets surged 2.9% and emerging markets finished the week up 1.3%.
Commodities: 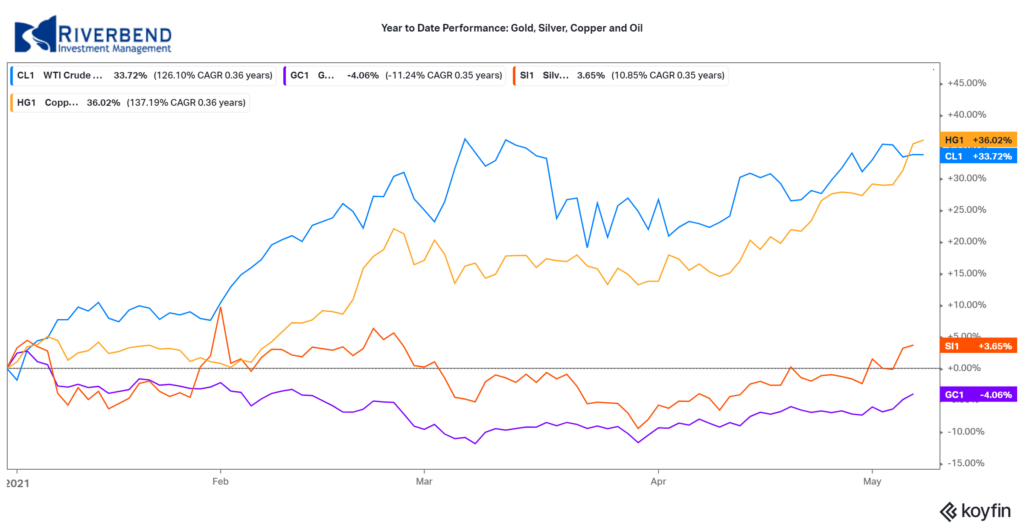
Commodities finished the week solidly to the upside as concerns over price inflation continued to grow.
Precious metals finished the week in the green with Gold rising 3.6% to $1831.30 per ounce, while Silver rose 6.2% to $27.48.
Energy was also bid higher. West Texas Intermediate crude finished the week up 2.1% to $64.90 per barrel.
Viewed by some analysts as a barometer of world economic growth (or inflation), due to its wide variety of industrial uses, the industrial metal copper ended the week up 6.3%.
U.S. Economic News: 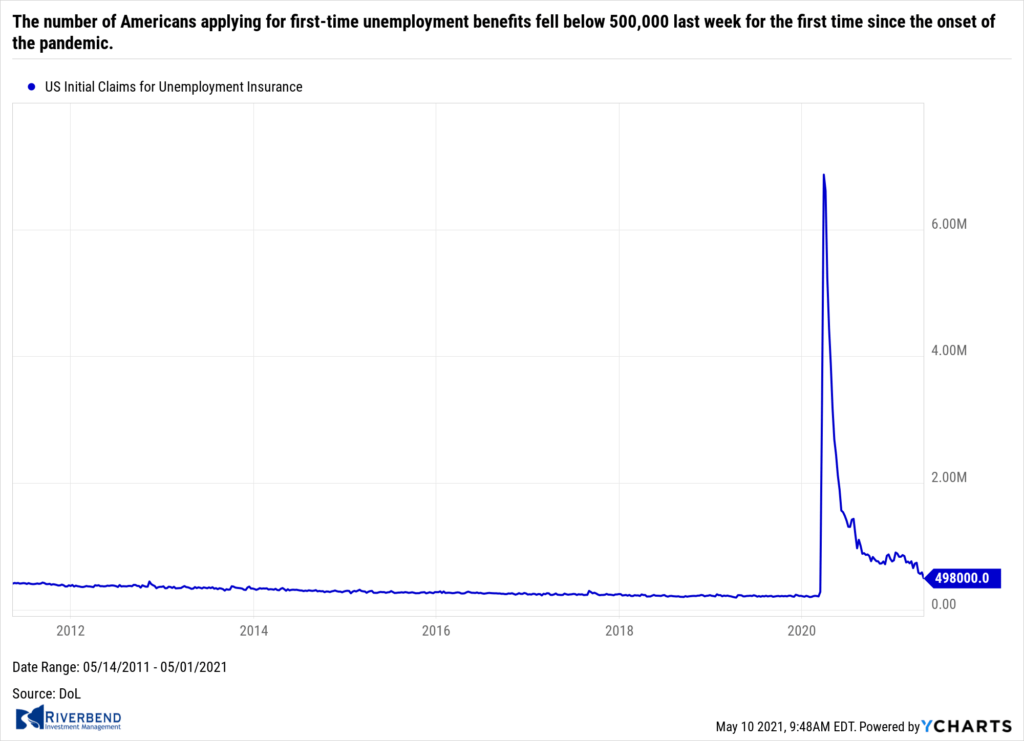
The number of Americans applying for first-time unemployment benefits fell below 500,000 last week for the first time since the onset of the pandemic. Initial jobless claims in the states sank 98,000 to 498,000 in the seven days ended May 1, the government said. It was the fourth consecutive weekly decline. Economists had expected claims to total 527,000. New applications for jobless benefits fell the most in Virginia, New York, Florida, California and Oklahoma. Kentucky was the only one to post a sizable increase.
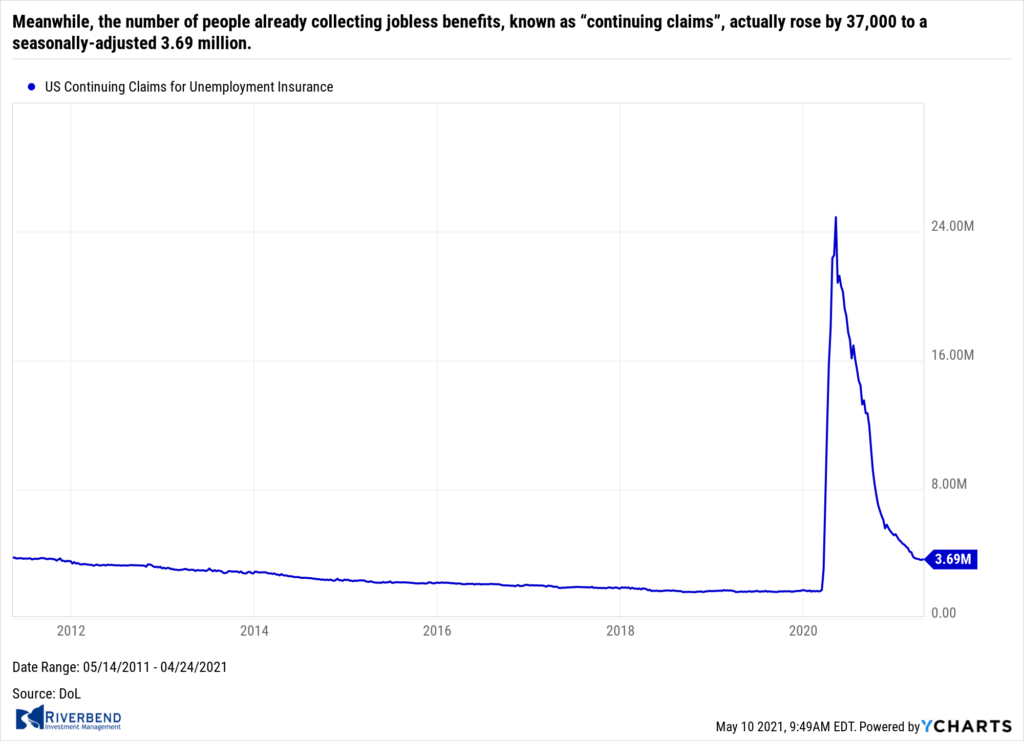
Meanwhile, the number of people already collecting jobless benefits, known as “continuing claims”, actually rose by 37,000 to a seasonally-adjusted 3.69 million. The increase is expected to unwind next week based on current trends. Chief economist Stephen Stanley of Amherst Pierpont Securities wrote in a note, “Jobless claims are still very high, but they are finally beginning to drop to more normal levels.”
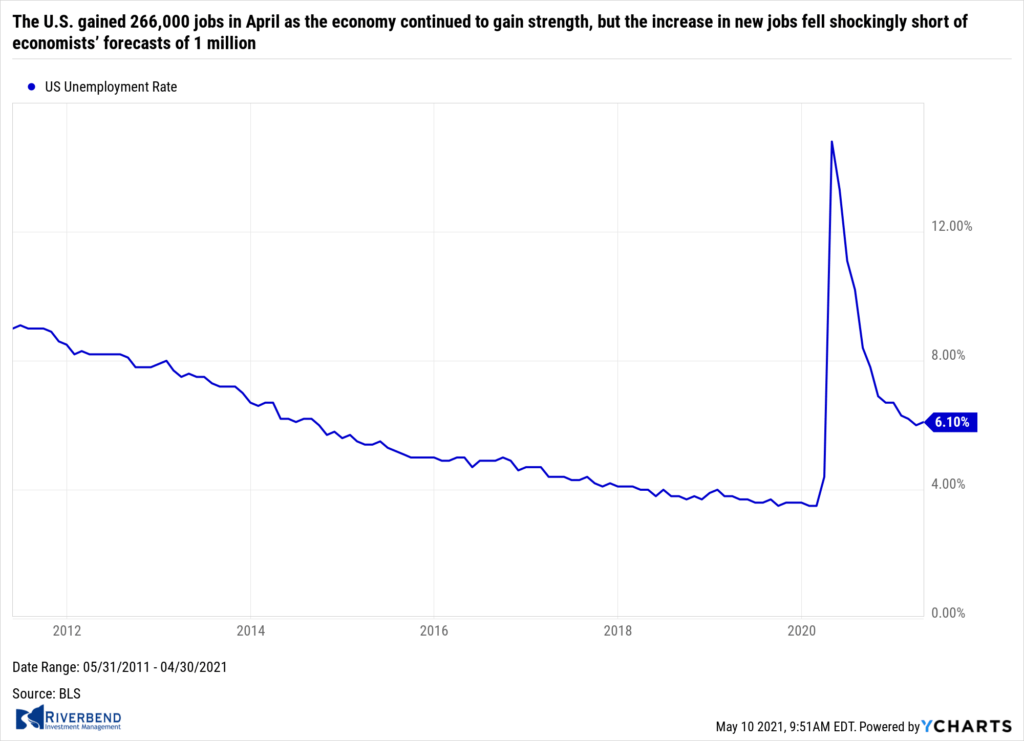
The U.S. gained 266,000 jobs in April as the economy continued to gain strength, but the increase in new jobs fell shockingly short of economists’ forecasts. Economists had expected a reading of 1 million new jobs. Senior chief economist Gus Faucher of PNC Financial Services stated, “The April jobs report was a huge disappointment.” Concurrently, the official unemployment rate ticked up to 6.1%, the U.S. Labor Department reported. The increase in the unemployment rate stemmed from more people entering the workforce in search of jobs—overall a good sign for the economy.
The small increase in new jobs flies in the face of mounting evidence that companies are eager to hire more workers in response to soaring demand for goods and services – but workers are declining to accept the jobs. In the report, so-called leisure and hospitality businesses — hotels, restaurants, theaters, amusement parks — added the most new jobs in April. They hired 331,000 people. Yet even as customers return and sales surge, businesses say it’s harder to find employees. They complain that generous emergency unemployment benefits have dissuaded many workers from accepting jobs. Extra benefits don’t expire until September.
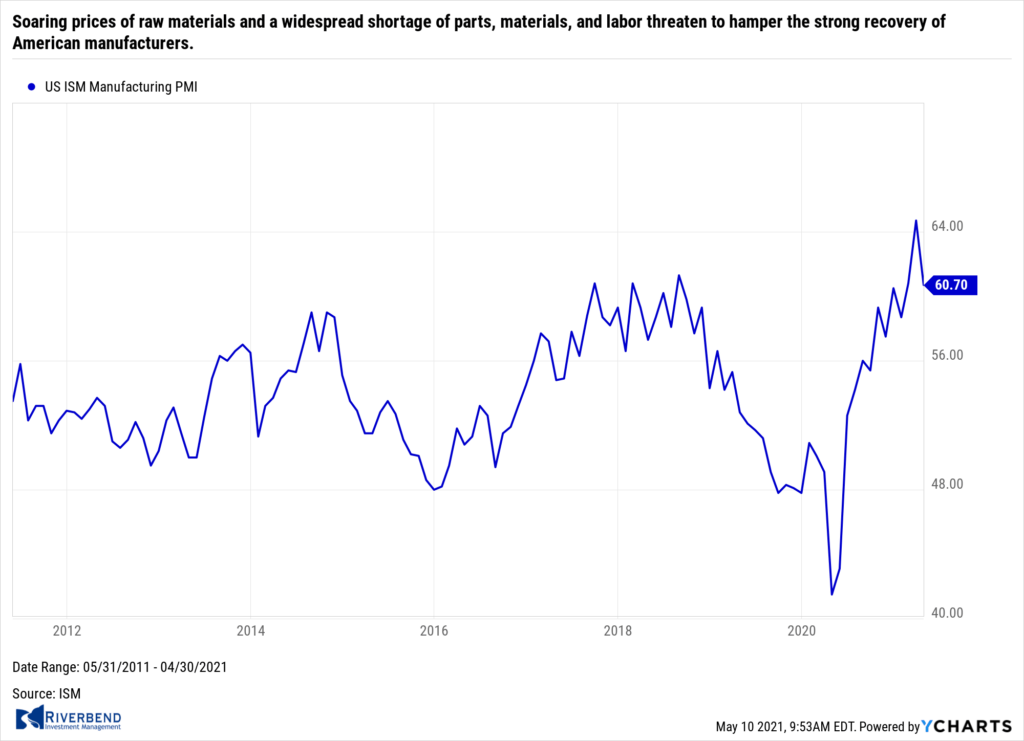
Soaring prices of raw materials and a widespread shortage of parts, materials, and labor threaten to hamper the strong recovery of American manufacturers. The Institute for Supply Management (ISM) reported its manufacturing index fell 4 points to 60.7 in April—down from a 38-year high the prior month. The reading fell far short of analysts’ expectations of an uptick to 65. In the report, top manufacturing executives say they are struggling to overcome key shortages that are causing the prices of most goods to rise—in some cases sharply.
A senior executive of a manufacturer of fabricated metal products stated, “Steel prices are crazy high. The normal checks on the domestic steel mills are not functioning — imported steel is distorted by the Section 232 tariffs.” In addition, a senior executive at a maker of rubber products stated, “In 35 years of purchasing, I’ve never seen everything like these extended lead times and rising prices — from colors, film, corrugate to resins, they’re all up.” All 18 major industries tracked by the survey reported they are growing — the first time that’s happened since 2014.
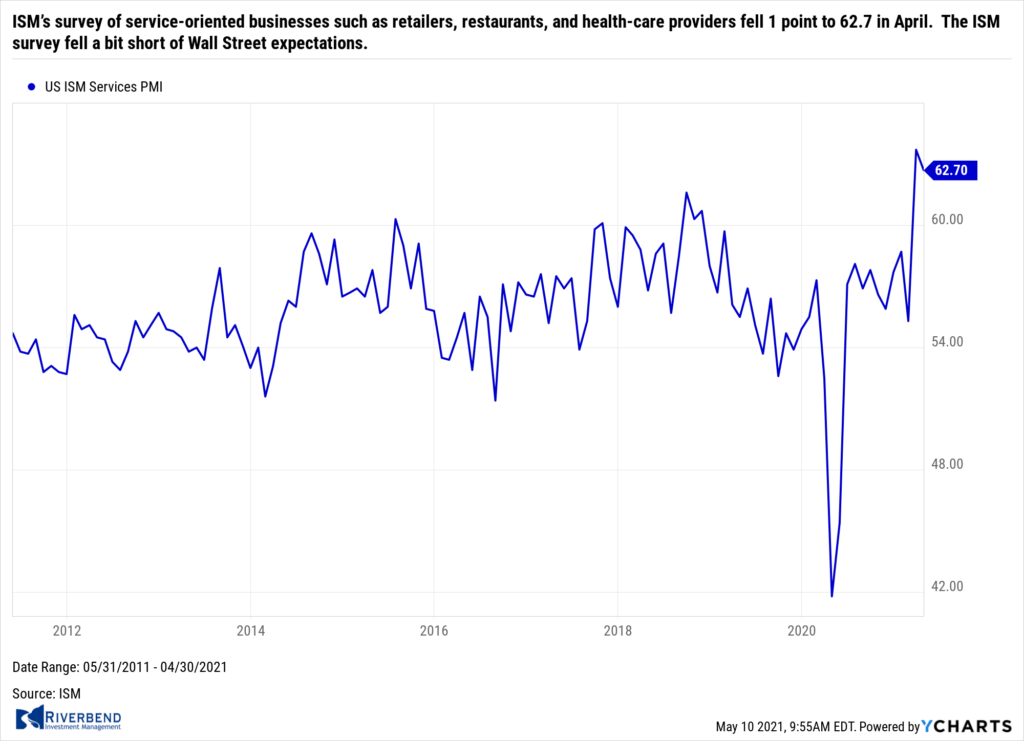
In the vastly larger services side of the U.S. economy, the ISM reported rapid growth as states lifted business restrictions, companies hired more workers, and consumers spent their stimulus checks. ISM’s survey of service-oriented businesses such as retailers, restaurants, and health-care providers fell 1 point to 62.7 in April. The ISM survey fell a bit short of Wall Street expectations. Economists had expected the index to edge up to 64.1.
Still, April’s reading was the second highest since the ISM survey began in 1997. Analysts generally consider any reading above 60 a sign of broad business strength. Anthony Nieves, chairman of the survey wrote, “There was slowing growth in the services sector in April. However, the rate of expansion is still strong. Respondents’ comments indicate that pent-up demand is continuing.”
Federal Reserve Chairman Jerome Powell gave a speech this week noting that “those least able to bear the burden” of the pandemic were the hardest hit. Powell said 20% of adults without college degrees suffered layoffs last year, versus 12% for college-educated workers. Furthermore, more than 20% of Black and Hispanic “prime age” adults were laid off compared to 14% of similar white workers over the same period.
On the big economic picture, the Fed chairman did not say much, but he sounded a bit more optimistic about the outlook than at his regular press conference last week. “We are not out of the woods yet, but I am glad to say that we are now making real progress,” Powell said.
Chart of the Week: 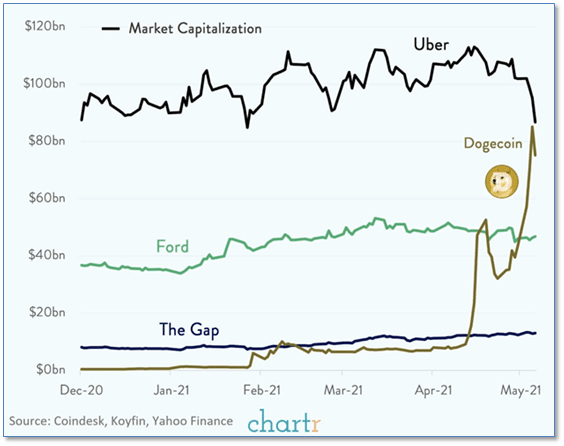
The cryptocurrency ‘Dogecoin’ (which started out as a joke by IBM software engineer Billy Markus and Adobe software engineer Jackson Palmer) has passed a market cap of over $75 billion—more valuable than the iconic Ford Motor Company. (By the way, Jackson Palmer says the correct pronunciation is “dohj coin”).
After this weekend’s appearance on Saturday Night Live by populist Dogecoin promoter and Tesla CEO Elon Musk (during which he joked Dogecoin was a “hustle”), Dogecoin fell from a pre-SNL high of 72c to as low as 43c but had rebounded to 57c as of mid-Sunday evening.
Whatever its merits or demerits, Dogecoin is certainly the most valuable joke in the known universe!
Riverbend Indicators:

Each week we post notable changes to the various market indicators we follow.
- As a reading of our Bull-Bear Indicator for U.S. Equities (comparative measurements over a rolling one-year timeframe), we remain in Cyclical Bull territory.
- Counting-up of the number of all our indicators that are ‘Up’ for U.S. Equities, the current tally is that four of four are Positive, representing a multitude of timeframes (two that can be solely days/weeks, or months+ at a time; another, a quarter at a time; and lastly, the {typically} years-long reading, that being the Cyclical Bull or Bear status).
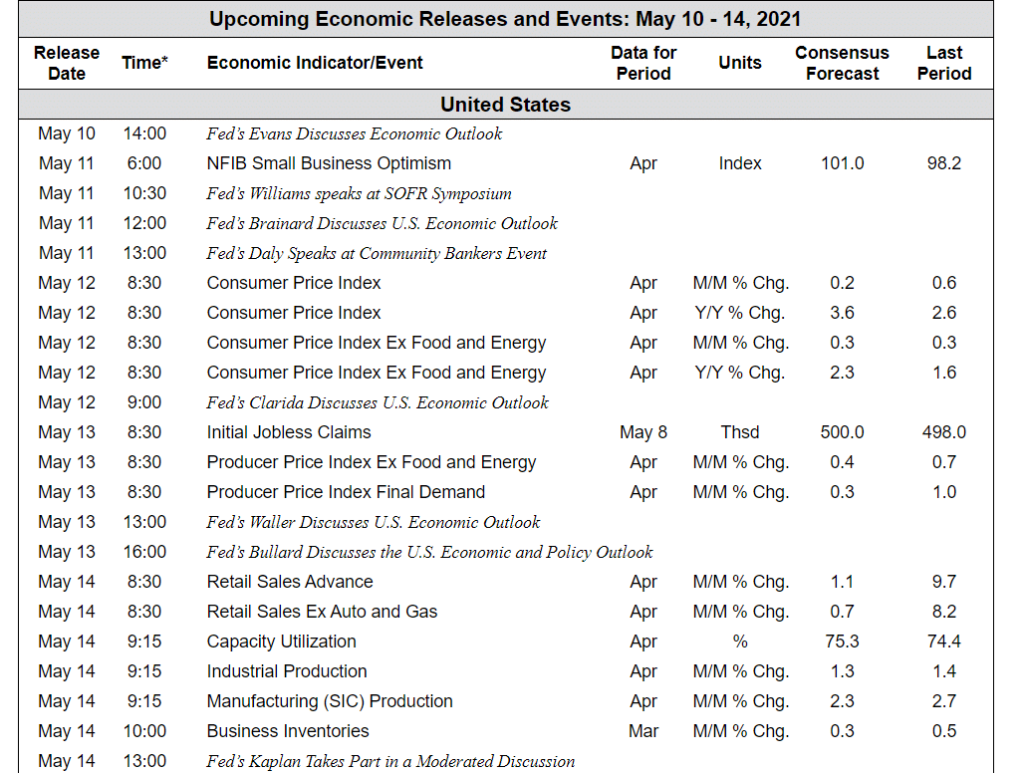
The Week Ahead:
Source: Bloomberg, TD Economics
(Sources: All index- and returns-data from Yahoo Finance; news from Reuters, Barron’s, Wall St. Journal, Bloomberg.com, ft.com, guggenheimpartners.com, zerohedge.com, ritholtz.com, markit.com, financialpost.com, Eurostat, Statistics Canada, Yahoo! Finance, stocksandnews.com, marketwatch.com, wantchinatimes.com, BBC, 361capital.com, pensionpartners.com, cnbc.com, FactSet.)
[/fusion_text][/fusion_builder_column][fusion_builder_column type=”1_6″ layout=”1_6″ spacing=”” center_content=”no” link=”” target=”_self” min_height=”” hide_on_mobile=”small-visibility,medium-visibility,large-visibility” class=”” id=”” hover_type=”none” border_size=”0″ border_color=”” border_style=”solid” border_position=”all” box_shadow=”no” box_shadow_blur=”0″ box_shadow_spread=”0″ box_shadow_color=”” box_shadow_style=”” background_type=”single” gradient_start_position=”0″ gradient_end_position=”100″ gradient_type=”linear” radial_direction=”center” linear_angle=”180″ background_color=”” background_image=”” background_image_id=”” background_position=”left top” background_repeat=”no-repeat” background_blend_mode=”none” animation_type=”” animation_direction=”left” animation_speed=”0.3″ animation_offset=”” filter_type=”regular” filter_hue=”0″ filter_saturation=”100″ filter_brightness=”100″ filter_contrast=”100″ filter_invert=”0″ filter_sepia=”0″ filter_opacity=”100″ filter_blur=”0″ filter_hue_hover=”0″ filter_saturation_hover=”100″ filter_brightness_hover=”100″ filter_contrast_hover=”100″ filter_invert_hover=”0″ filter_sepia_hover=”0″ filter_opacity_hover=”100″ filter_blur_hover=”0″ last=”no”][/fusion_builder_column][/fusion_builder_row][/fusion_builder_container]


