Last week, the markets attempted to rebound from very, but short-term, oversold conditions.
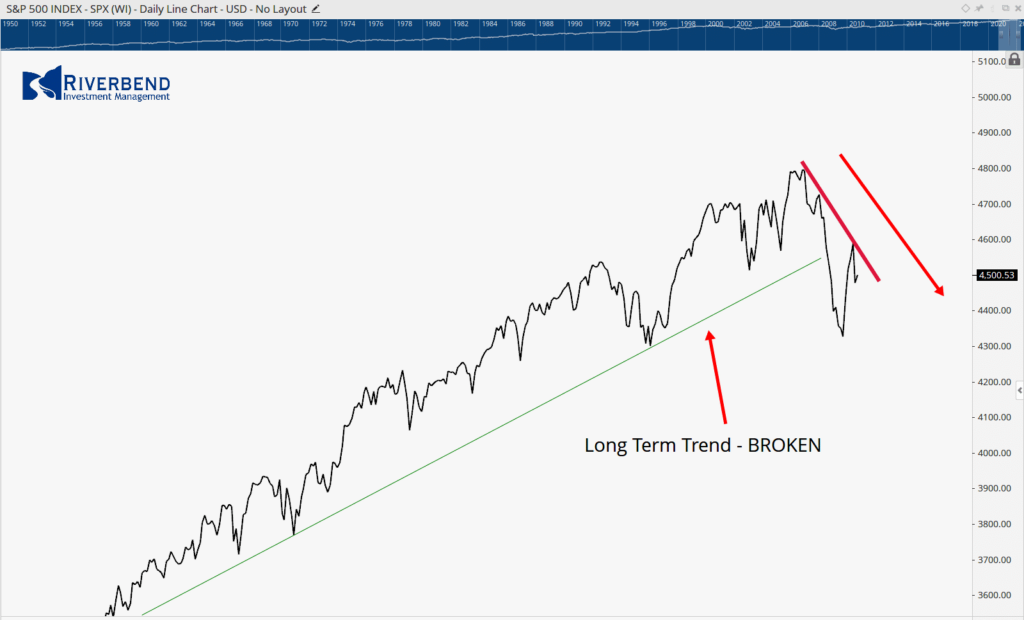
Despite a strong week from stocks, the market is still in a downtrend.
Last week’s rally, brought the S&P 500 index up to resistance levels — and then immediately reversed back down. Not a positive sign for the stock market.
(In our client portfolios, we are now 100% cash or hedged to market neutral)
On Friday, the jobs report data was significantly higher than what Wall Street analysts were forecasting.
Normally, this would be a good sign for the economy. However, since the economy is facing rising inflation, this is actually bad news for investors.
Up until the jobs report, the narrative was about the risk of stagflation – inflation without growth. Investors had been worried that the Fed would act too aggressively and stall the economy.
This narrative was giving support to bond prices as investors believed the Fed wouldn’t be able to raise rates as aggressively as the Fed was forecasting.
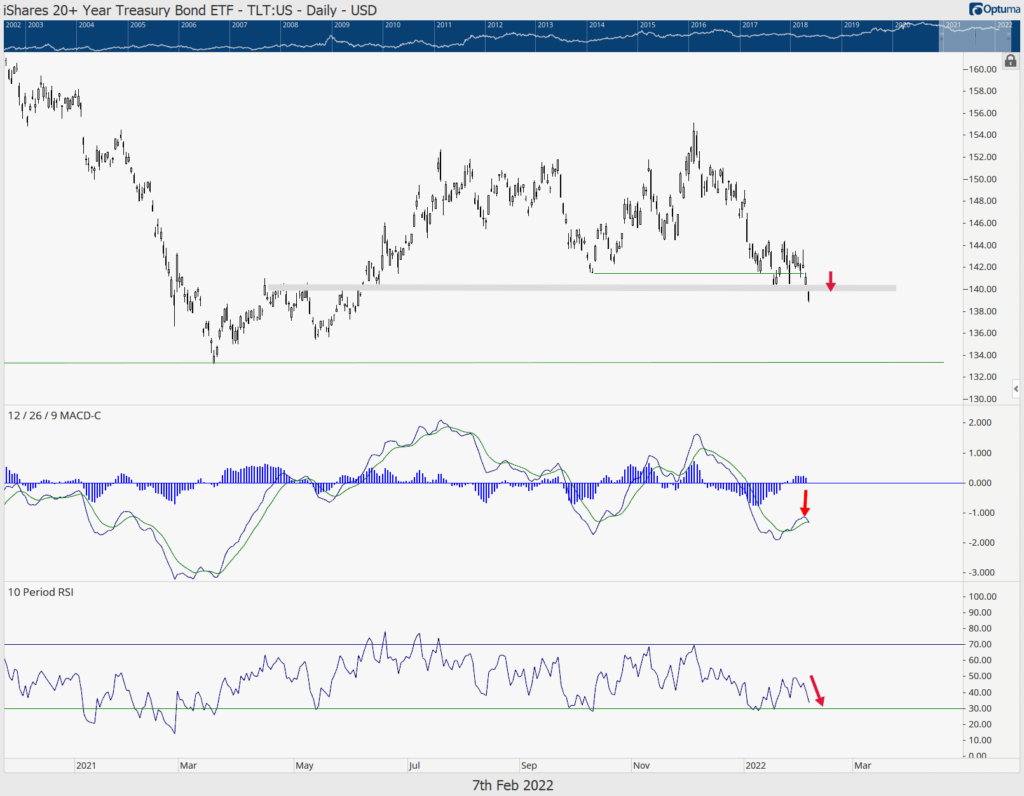
With Friday’s strong job report, the Fed may now need to act sooner and more aggressively than previously thought.
This caused bond yields to break out and rise higher, causing bond ETFs and mutual funds to drop below some important resistance levels:
As interest rates rise, growth stocks tend to do poorly, especially technology stocks.
The S&P 500 is a market capitalization-weighted index, which is calculated by taking a stock’s price and multiplying by its outstanding shares. This gives an unequal weighting and causes the largest companies to have a disproportional impact on the index itself.
Currently, technology stocks have the largest weighting in the S&P 500. The largest negative impact on the S&P 500 will therefore come from declining technology stocks.
As investors start to see declines within the S&P 500 index accelerate, the possibility of the decline spreading to other sectors increases. (Note how little of an impact the rise in energy prices is having on the S&P 500 index.)
Right now, cash is king.
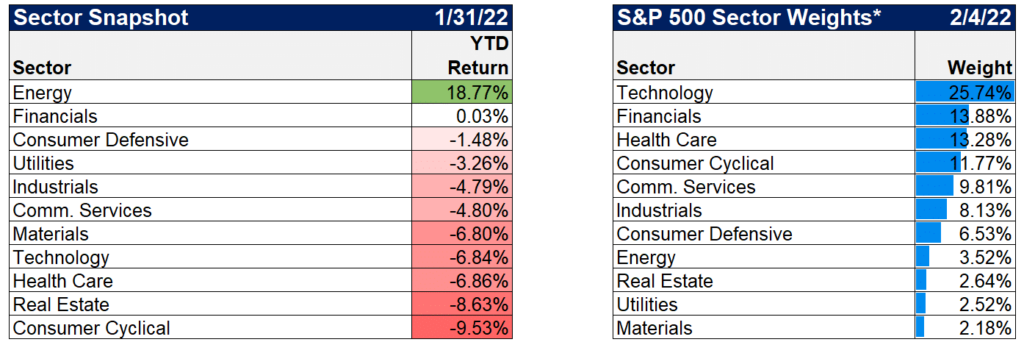
Chart of the Week:
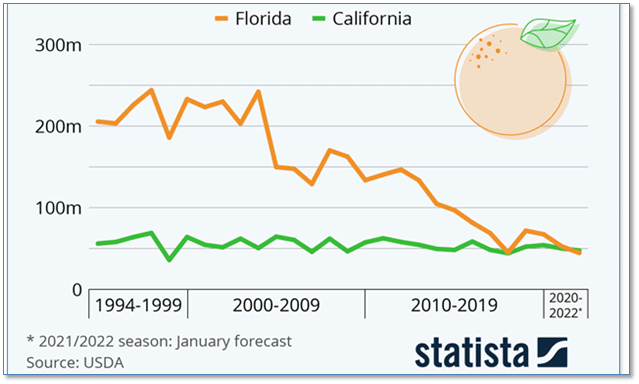
Along with gasoline and rent we get to add orange juice to the ever-expanding list of prices expected to skyrocket throughout the year.
The January forecast for the U.S. citrus harvest is looking especially bleak for Florida orange growers. For the 2021/2022 season, the “Sunshine state” is expected to harvest 45 million 90 pound boxes in the state.
If true, California’s crop (expected to be 47 million boxes) would exceed Florida’s for the first time ever. One of the results of the meager harvest would likely be rising orange juice prices.
Analysts attribute the lower production to a worsening outbreak of citrus greening bacteria transmitted by a bug called the Asian citrus psyllid.
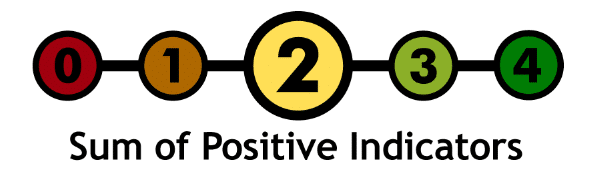
Riverbend Indicators:
- As a reading of our Bull-Bear Indicator for U.S. Equities (comparative measurements over a rolling one-year timeframe), we remain in Cyclical Bull territory.
- Counting up of the number of all our indicators that are ‘Up’ for U.S. Equities, the current tally is that two of four are Positive, representing a multitude of timeframes (two that can be solely days/weeks, or months+ at a time; another, a quarter at a time; and lastly, the {typically} years-long reading, that being the Cyclical Bull or Bear status).
The Week Ahead:
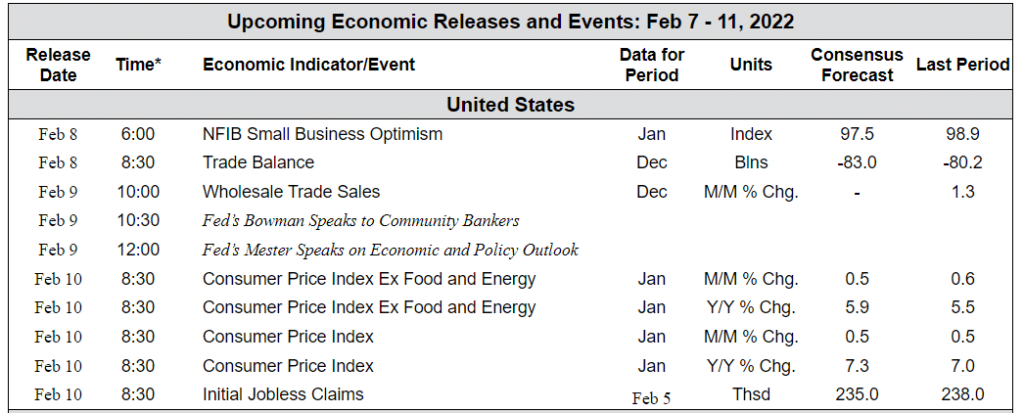
Source: Bloomberg, TD Economics


