[fusion_builder_container hundred_percent=”no” equal_height_columns=”no” menu_anchor=”” hide_on_mobile=”small-visibility,medium-visibility,large-visibility” class=”” id=”” background_color=”” background_image=”” background_position=”center center” background_repeat=”no-repeat” fade=”no” background_parallax=”none” parallax_speed=”0.3″ video_mp4=”” video_webm=”” video_ogv=”” video_url=”” video_aspect_ratio=”16:9″ video_loop=”yes” video_mute=”yes” overlay_color=”” video_preview_image=”” border_size=”” border_color=”” border_style=”solid” padding_top=”” padding_bottom=”” padding_left=”” padding_right=””][fusion_builder_row][fusion_builder_column type=”1_1″ layout=”1_1″ background_position=”left top” background_color=”” border_size=”” border_color=”” border_style=”solid” border_position=”all” spacing=”yes” background_image=”” background_repeat=”no-repeat” padding_top=”” padding_right=”” padding_bottom=”” padding_left=”” margin_top=”0px” margin_bottom=”0px” class=”” id=”” animation_type=”” animation_speed=”0.3″ animation_direction=”left” hide_on_mobile=”small-visibility,medium-visibility,large-visibility” center_content=”no” last=”no” min_height=”” hover_type=”none” link=””][fusion_text]
Stocks ended the week lower as worries grew about the impact of the coronavirus outbreak on the global economy. The S&P 500 index and the technology-heavy NASDAQ Composite reached record highs this week before falling back, but it was the smaller-cap benchmarks that held up best this week.
The Dow Jones Industrial Average gave up 405 points to finish the week at 28,992, a decline of -1.4%. The Nasdaq Composite retreated -1.6%, while the S&P 500 finished down -1.3%. The small-cap Russell 2000 and mid-cap S&P 400 indexes retreated -0.5% and -0.6%, respectively.
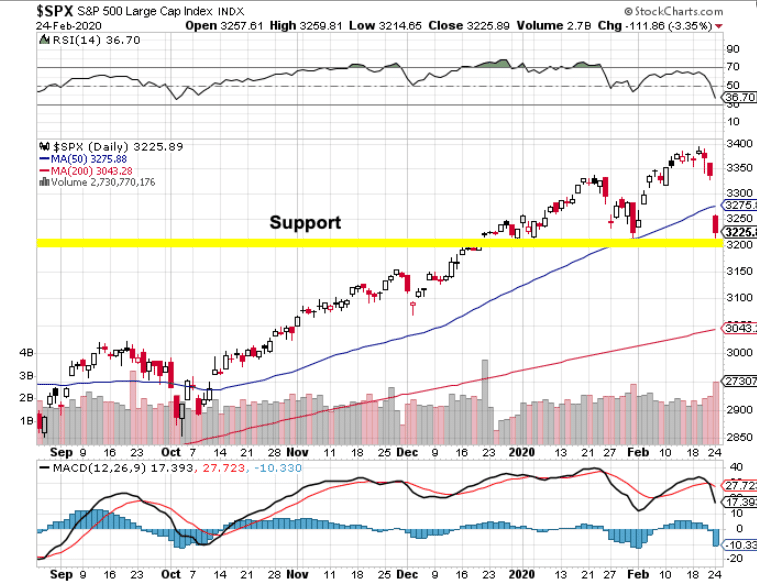
Monday’s decline brought the S&P 500 Index down to a key support level.
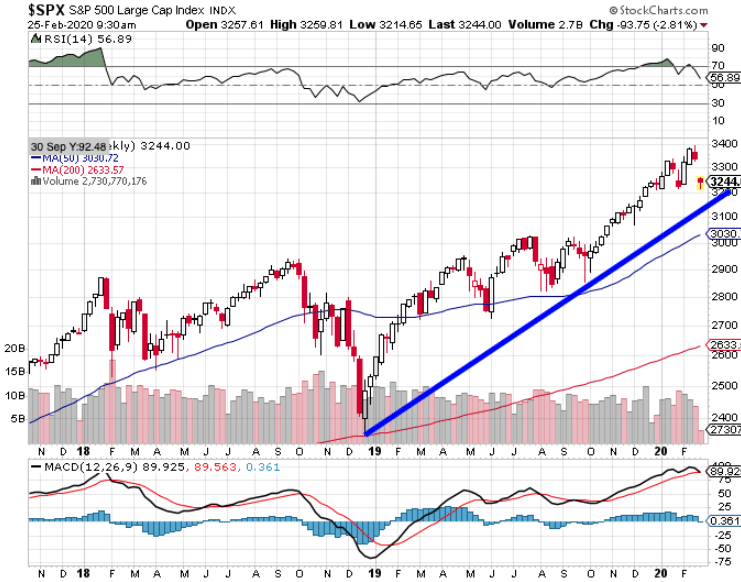
The weekly S&P 500 Index upward trend is still intact.
International Markets: The vast majority of international markets finished the week down as well. Canada’s TSX and the United Kingdom’s FTSE each closed down less than -0.1%, while on Europe’s mainland France’s CAC 40 fell -0.7%, Germany’s DAX retreated -1.2%, and Italy’s Milan FTSE lost -0.4%.
In Asia, China’s Shanghai Composite surged 4.2% in a partial rebound from earlier losses, while Japan’s Nikkei declined -1.3%. As grouped by Morgan Stanley Capital International, developed markets gave up -1.4%, while emerging markets ended down -2.1%.
Commodities: Precious metals surged higher this week. Gold rose for a second consecutive week, rising $62.40 to $1648.80 an ounce, a gain of 3.9%. Silver rose 4.5% to $18.53 per ounce. Oil finished the week up as well, closing at $53.38 per barrel of West Texas Intermediate crude, a gain of 2.6%.
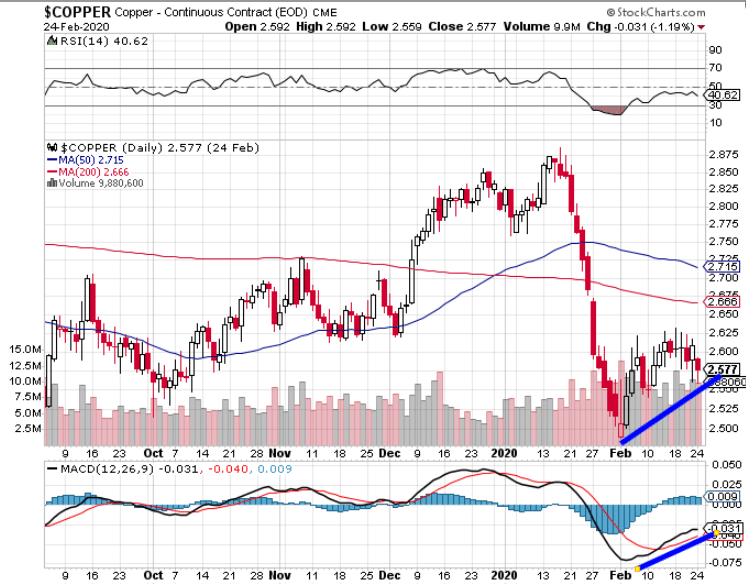
Is the price of copper reflecting an equity market overreaction to the Coronavirus again?
The industrial metal copper, seen by some analysts as a barometer of global economic health due to its wide variety of uses, rose a third consecutive week, up 0.3%. The rise in copper is a bit of a conundrum, as most fear worsening global economic health which would ordinarily pressure copper lower.
Chart of the Week
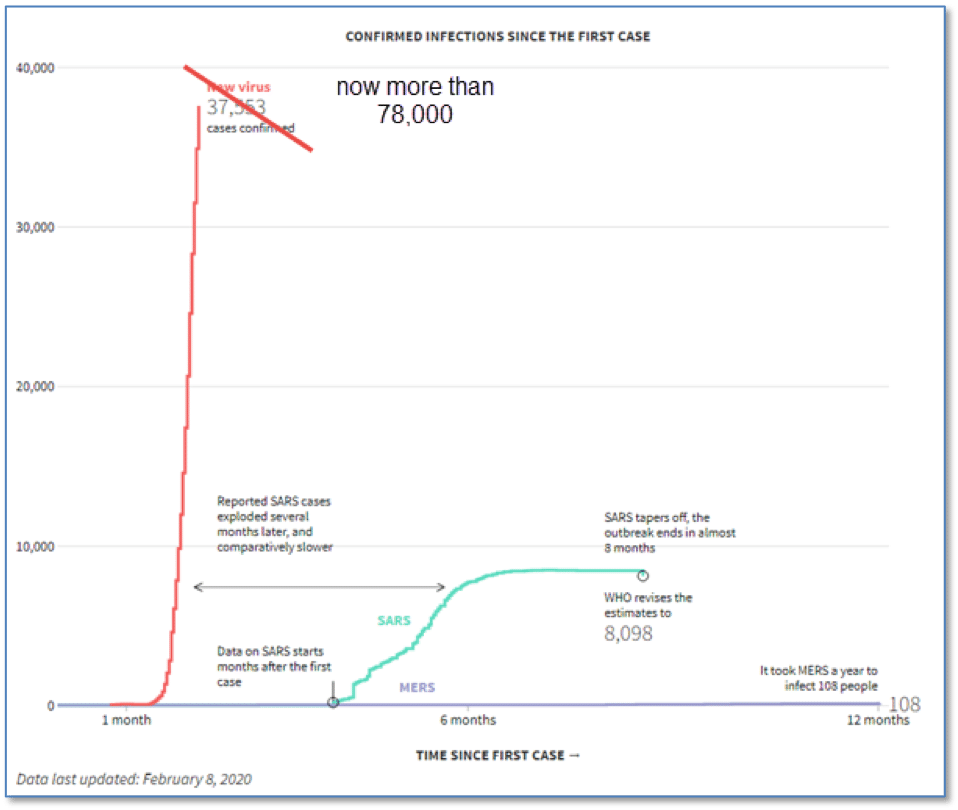
source: Reuters
By now almost everyone is aware of the coronavirus outbreak first detected in China and now known as “COVID-19”. The latest data (2/23/20) from Johns Hopkins University, which has been monitoring the situation closely, shows 78,990 confirmed cases worldwide, with 2,469 deaths.
An under-appreciated facet of this virus is the stunningly high rate of transmission, as illustrated by the nearly-vertical line on the chart below. The extremely high velocity of transmission from person to person is perhaps the most frightening characteristic of this new killer.
Economic Update
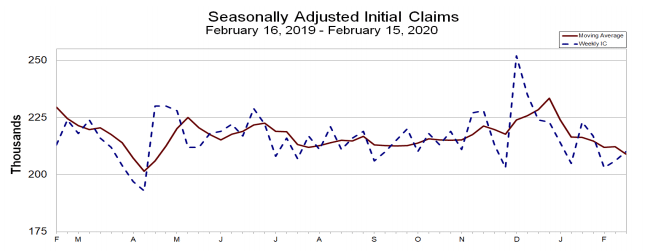
source: Department of Labor
The number of Americans claiming first-time unemployment benefits rose slightly, but remained near post-recession lows. The Labor Department reported initial jobless claims edged up by 4,000 to 210,000 last week. The reading matched economists’ forecasts. The more stable monthly average of new claims, which filters out the often‑volatile weekly number, slipped by 3,250 to 209,000 – its lowest reading since last April. Meanwhile, the number of people already collecting unemployment benefits, known as “continuing claims”, rose by 25,000 to 1.73 million. That number had soared as high as 6.6 million near the end of the 2007-2009 Financial Crisis.
Confidence among the nation’s homebuilders remained near all-time highs despite growing concerns that first-time homebuyers may be weighed down by excessive debt. The National Association of Home Builders reported its monthly confidence index dropped one point to 74 this month. The reading is just two points below the index’s highest reading since June of 1999. Mortgage rates have hit a three-year low, propping up the housing market, but analysts note that many potential buyers are saddled with student loan debt. Rubeela Farooqi, chief U.S. economist at High Frequency Economics stated “Student loans remain high and present an obstacle in first time buyers’ ability to save for a down payment.”
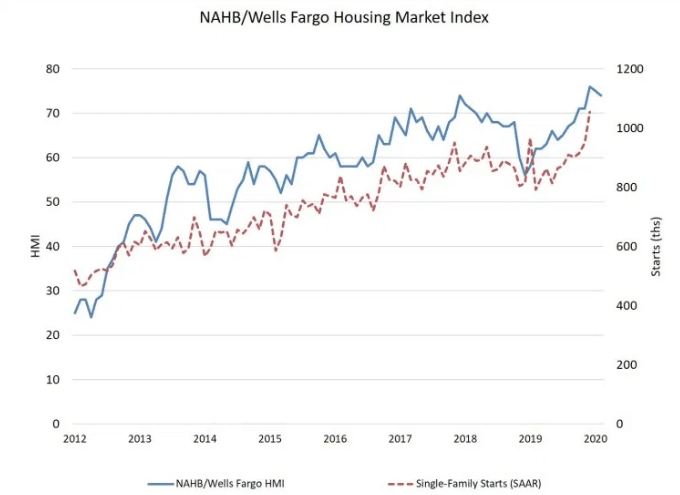
source: NAHB
Sales of previously-owned homes dipped in January, but the overall trend remains up. The National Association of Realtors reported existing-home sales slipped 1.3% last month to an annual pace of 5.46 million. Yet that number is still 10% higher than at the same time last year. Sales were off more than 9% in the West, accounting for last month’s entire decline. In the South and Midwest sales rose slightly, and in the Northeast sales were flat. The median sales price was $266,300—up 6.8% from a year earlier. There was just a 3.1 month supply of homes for sale last month, far below the 6-month supply that is generally considered a “balanced” housing market.
The number of new homes under construction dipped in January, but an indicator of future building activity remained resilient. The Commerce Department reported housing starts slipped -3.6% following a remarkably strong showing at the end of 2019. Housing starts fell to an annual pace of 1.57 million, exceeding economists’ forecasts of a 1.43 million rate. Building permits, which analysts use to gauge future building activity, rose 9.2% to a nearly 13-year high. Both starts and permits are sharply higher compared to the same time last year, reflecting the rebound in the housing market tied to lower interest rates.
Source: Federal Reserve Bank of NY
Manufacturing activity in the New York-area surged this month to its highest level in nine months, the Federal Reserve reported. The NY Fed’s Empire State Manufacturing Index rose 8.1 points to 12.9—its highest reading since last May. Economists had expected a reading of just 4.0. Readings above 0 indicate improving conditions. In the details, the new orders index rose to its highest level in over a year, up 15.5 points, while the shipments index also had a strong gain. The index of future business conditions remained little-changed at 22.9. T.J. Connelly, head of research at Contingent Macro stated, “Phase One of the U.S./China trade deal appears to have eased uncertainty and helped a rebound in activity after several quarters of slow business.”
It was a similar story in the mid-Atlantic region. The Philadelphia Fed reported its manufacturing index jumped to its highest level in three years this month. The regional Fed bank’s index jumped to 36.7 this month, up 20 points from January. Readings above zero indicate improving conditions. Economists had expected a reading of just 10. In the details, new orders increased 15 points to its highest level since May 2018 and the shipments index rose 2 points to 25.2. The measure of six-month business outlook rose 7 points to 45.4—its fifth consecutive month of improvement.
Federal Reserve officials remained upbeat about the economic outlook for the remainder of the year, according to meeting minutes released this week. Officials expressed concerns about the threat of the coronavirus outbreak in China and rising tensions in the Middle East. Fed Chairman Jerome Powell told Congress last week that the central bank was “carefully monitoring” COVID-19, the deadly virus that is hampering the production of goods in China, especially those for U.S. technology firms. Analysts were surprised by the “cautious optimism” expressed about the business sector, which remained mostly stagnant last year. There was also some optimism about the outlook for inflation, which has lagged below the Fed’s 2% target. Despite the optimism, Fed officials were careful not to signal any change in interest rates.
Riverbend Market Indicators

As a reading of our Bull-Bear Indicator for U.S. Equities (comparative measurements over a rolling one-year timeframe), we remain firmly in Cyclical Bull territory.
Counting up the number of all our indicators that are ‘Up’ for U.S. Equities, we are in ‘Mostly Positive’ territory.
This status is drawn from a scale that goes from Negative, to Mostly Negative, to Neutral, to Mostly Positive, to Positive, and totals-up current readings based on a multitude of timeframes (days/weeks/months/quarters/years, the ‘years’ being the Cyclical Bull or Bear reading).
The Week Ahead
Monday: German Ifo Business Climate 95.0 exp, 95.9 prior
Tuesday: U.S. CB Consumer Confidence 132.6 exp, 131.6 prior U.S. Richmond Manufacturing Index 10 exp, 20 prior
Wednesday: U.S. New Home Sales 710k exp, 694k prior Australian Private Capital Expenditures q/q +0.5% exp, -0.2% prior
Thursday: Durable Goods U.S. Durable Goods Orders m/m -1.4% exp, +2.4% prior U.S. Core Durable Goods Order m/m +0.2% exp, -0.1% prior U.S. Pending Home Sales m/m +2.1% exp, -4.9% prior
Friday: Eurozone Core CPI Flash Estimate y/y N/A exp +1.1% prior Canadian GDP m/m +0.1% exp, +0.1% prior U.S. Core PCE Price Index m/m +0.2% exp, +0.2% prior U.S. Chicago PMI 46.4 exp, 42.9 prior China Manufacturing PMI N/A exp, 50.0 prior
(Sources: All index- and returns-data from Yahoo Finance; news from Reuters, Barron’s, Wall St. Journal, Bloomberg.com, ft.com, guggenheimpartners.com, zerohedge.com, ritholtz.com, markit.com, financialpost.com, Eurostat, Statistics Canada, Yahoo! Finance, stocksandnews.com, marketwatch.com, wantchinatimes.com, BBC, 361capital.com, pensionpartners.com, cnbc.com, FactSet)
[/fusion_text][/fusion_builder_column][/fusion_builder_row][/fusion_builder_container]


