Nassim Taleb, in his 2001 book ‘Fooled by Randomness’, described ‘Black Swan Events’ as high-profile, hard-to-predict and rare events that are beyond the realm of normal expectations in history, science, finance, and technology.
Black Swan Events are named for real-life black swans, which at one time were widely believed to not even exist. Second Century Romans even had a phrase: ‘Rara avis in terris nigroque simillima cygno’, to describe someone or something as so rare or unlikely to exist that it would be like seeing a black swan. Centuries later, however, black swans were discovered to actually exist, in Australia!
This week, I think we can probably agree that a black swan has landed once more.
The sudden spread of the Covid-19 coronavirus, and the subsequent worldwide shock that it has produced, has now infected the stock market. Thursday, February 27th, was the largest point-drop ever for the Dow 30 (but given the lofty levels of the previous high, it’s nowhere among the historical largest percent-drops).
The S&P 500 and the Nasdaq both set new all-time highs just a week and a day ago (February 19th), and the Dow a week before that (February 12th); but since then, each has lost more than 12% in a cascade of multi-hundred-point down-days.
The S&P 500 is now back to where we were in mid-October of last year. In the big picture, being set back by four months in the market doesn’t typically raise an eyebrow, as that’s a pretty common occurrence; such corrections have happened dozens of times in history. What makes this time seem different, however, is the speed of the decline … that’s the ‘black swan’ nature of it.
Thursday was the third day in the last week with a hugely-lopsided down-to-up volume ratio (almost 30:1 Down:Up among S&P 500 stocks on Thursday). Usually, such a tremendously-oversold condition leads to an imminent rally. The most memorable such episode in recent times would be December 24th, 2018 and December 26th, 2018, going from worst-in-a-decade (or even a bit beyond that) new Maximum Drawdowns for many investment portfolios, to a months-long steep and unabated run-up commencing the very next market day. That being said, we can’t say exactly how things may play out this time, of course.
Market Update
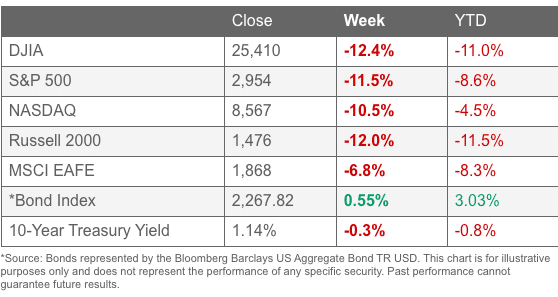
U.S. Markets: Fears over the spreading coronavirus, now known as COVID-19, drove the fastest market correction in history. Stocks suffered their worst weekly decline in over a decade as investors reacted to the global spread of the COVID-19 outbreak. All of the major indexes fell into “correction” territory—down more than 10% from their recent peaks just a week earlier. The technology-heavy NASDAQ Composite fared the “best” only giving up -10.5%, whereas the Dow Jones Industrial Average plunged 3,583 points to 25,409—a decline of -12.4%. The large cap S&P 500 index gave up -11.5%, while the mid-cap S&P 400 fared the worst, closing down -13.0% and the small cap Russell 2000 ended the week down -12.0%.
International Markets: It was a similar story in international markets, although most fared better than the U.S. Canada’s TSX declined -8.9%, the United Kingdom’s FTSE fell -11.1%, and France’s CAC 40 retreated -11.9%. Germany’s DAX fared the worst plunging -12.4%. In Asia, China’s Shanghai Composite retreated -5.2%, while Japan’s Nikkei ended down -9.6%. As grouped by Morgan Stanley Capital International, developed markets ended down -8.8%, while emerging markets fell -6.4%.
Commodities: There was some strange price action in the precious metals market this week. Gold is usually seen as a safe-haven investment that rises during times of market stress, but this week it closed down -5.0% to $1566.70 per ounce. Silver, which often trades with more volatility than Gold, plunged -11.2%. The industrial metal copper, viewed by analysts as a barometer of world economic health due to its wide variety of uses, declined -2.6%. West Texas Intermediate crude oil plunged -16.2% last week.
February Summary: For the month of February, the Dow finished down -10.1%. The NASDAQ Composite declined ‑6.4%. By market cap the large cap S&P 500 retreated -8.4%, the mid-cap S&P 400 fell -9.6%, and the small cap Russell 2000 declined ‑8.5%. Canada’s TSX declined -6.1% and the UK’s FTSE fell -9.7%. On Europe’s mainland, France’s CAC 40 fell -8.6% and Germany’s DAX declined -8.4%. China’s Shanghai Composite ended down -3.2%, and Japan’s Nikkei retreated -8.9%. Developed markets gave up -7.8%, while emerging markets ended down -3.8%. For the month, Gold finished February down -1.3%, while Silver declined -8.6%. Oil gave up -13.2%, while copper managed a slight gain, gaining 0.9%.
Economic Update
The Labor Department reported that the number of Americans applying for first-time unemployment benefits rose by 8,000 last week to a one-month high of 219,000. However, overall claims remain very close to a 50-year low. Economists had expected claims to total 214,000. Meanwhile, the monthly average of new claims, smoothed to iron-out the weekly volatility, edged up by 500 to 209,750. Continuing claims, which counts the number of people already receiving benefits, fell by 9,000 to 1.72 million. That number is reported with a one-week delay.
Sales of new homes soared to their highest level since 2007. The Census Bureau reported sales of newly-constructed homes soared 7.9% on a monthly basis in January to a seasonally-adjusted annual rate of 764,000. That is the highest reading of new home sales since July of 2007 and marks a new cycle high for the housing market. On an annual basis, new home sales were up 18.6% compared with the same time last year. By region, sales for the month increased the most in the Midwest, where they rose 30.3%, followed by the West at 23.5%. In the Northeast, new home sales increased a more modest 4.8% between December and January, and they dropped 4.4% over that same time frame in the South. The median sales price of new homes sold in January was $348,200.
The pace of home-price appreciation ramped up in December, according to the latest report from S&P CoreLogic/Case-Shiller. Case-Shiller’s 20-city home price index posted a 2.9% year-over-year gain in December, up from 2.5% the previous month. Month-over-month, the index increased 0.4% between November and December. Despite the end-of-year ramp, the overall rate of home-price growth was slower in 2019 than the previous year. In the details of the report, Phoenix (+6.5%), Charlotte, N.C. (+5.3%), and Tampa (+5.2%) led the way with the largest gains.
Confidence among the nation’s consumers remained high in early February, but that was before fears of the coronavirus took hold. The Conference Board reported consumers were still very optimistic about the economy in early February with its index rising to 130.7—its highest reading in six months. However, analysts were quick to point out the cutoff date for the survey was two weeks ago—before the outbreak of the COVID-19 virus spread outside of China. Confidence is still fairly high by historical standards — the index hit an 18-year peak of 137.9 in late 2018 — but it’s unlikely to hold up if the latest coronavirus keeps spreading. Economists at Jefferies LLC wrote, “Looking ahead, confidence is going to depend on how everything plays out with coronavirus.”
Americans bought more new cars and spent more money on food and hotels in January, but overall spending has slowed since last summer. The Commerce Department reported consumer spending increased a tepid 0.2% last month, a tick below forecasts. Incomes shot up 0.6%, the biggest gain in 11 months, but the increase included annual cost-of-living increases in Social Security benefits as well as tax credits tied to the Affordable Care Act. Inflation, as measured by the Personal Consumption Expenditures Index (rumored to be the Federal Reserve’s preferred gauge), rose a scant 0.1% for the month, lifting the increase over the past year to 1.7% from 1.5%.
The economy expanded at a 2.1% pace in the final quarter of last year, but the U.S. will struggle to achieve even that rate of growth in the months ahead if the coronavirus isn’t contained. The Commerce Department forecasts a 2.1% growth rate in the first quarter of 2020 as well. However, tourism and travel-related businesses are already warning of softer sales and profits as cancellations increase. Consumer spending, the main engine of the economy, was revised down a notch to show a mediocre 1.7% pace of growth in the fourth quarter. Outlays had risen 3.2% in the prior quarter. The trade deficit was also sharply lower, giving the biggest boost to GDP.
International Economic News:
Canada’s economic growth slowed in the final quarter of 2019 to its worst performance in almost four years. Statistics Canada reported growth came in at an annualized 0.3% in the fourth quarter, due in part to strikes, bad weather, and shutdowns. The number matched economists’ estimates as well as the Bank of Canada’s prediction. The Bank of Canada meets this coming week and market expectations of a cut jumped as the Canadian economy faces challenges from the coronavirus outbreak and rail blockades by environmental groups. The central bank hasn’t adjusted interest rates since October 2018.
Across the Atlantic, Bank of England governor Mark Carney stated the United Kingdom is already feeling the economic impact from the coronavirus outbreak. Carney stated that the British economy, which relies heavily on tourism revenues and manufacturing, is already seeing the impact. “What we are picking up with some of our bigger companies and companies around the world, like for Jaguar Land Rover in the Midlands, things are getting a little tight,” he said. Data out earlier this month showed that the British economy stagnated at the end of 2019.
The coronavirus, which has killed nearly 3,000 people worldwide and all but paralyzed China for the past month, now is targeting Europe’s $19 trillion economy. “The economic effects of a severe pandemic could be as bad as those of the global financial crisis,” Capital Economics, a London-based research consultancy, warned clients this week. France has banned indoor gatherings of more than 5,000 people and canceled the Paris half-marathon that was expected to attract 40,000 runners this week. Germany’s Federal Statistics Office reported exports had fallen by 0.2% in the fourth quarter of last year—confirming that Europe’s largest economy was stagnating even before the coronavirus outbreak began.
In Asia, with factories forced to remain closed after the traditional lunar New Year’s holiday shutdown, China’s official Purchasing Managers’ Index (PMI) plunged further in February than at any time in the past 12 years, China’s National Bureau of Statistics reported. The release confirmed fears that China’s economy was in bad shape and fanned speculation that it may even contract in the first quarter. Larry Hu, chief China economist at Macquarie Capital in Hong Kong, said in a note that Beijing might report negative growth for “the first time since the Cultural Revolution”. The manufacturing PMI, which measures factory activity, dropped to 35.7 in February – below the previous all-time low of 38.8 set in November 2008 during the global financial crisis.
Japanese Prime Minister Shinzo Abe announced a $2.5 billion emergency economic package to help fight the coronavirus outbreak. Abe said at a news conference that Japan is at critical juncture to determine whether the country can keep the outbreak under control ahead of this summer’s Tokyo Olympics. Earlier this week, Abe announced a plan to close all schools for more than a month, taking them through the end of the Japanese academic year. The emergency package includes financial support for parents and their employers affected by the school closures. He said that much about the virus is still unknown, and that “fighting against an unknown and unclear enemy is not easy. Frankly speaking, this battle cannot be won solely by the efforts of the government,” Abe said. “We cannot do it without understanding and cooperation from every one of you, including medical institutions, families, companies and local governments.”
Chart of the Week
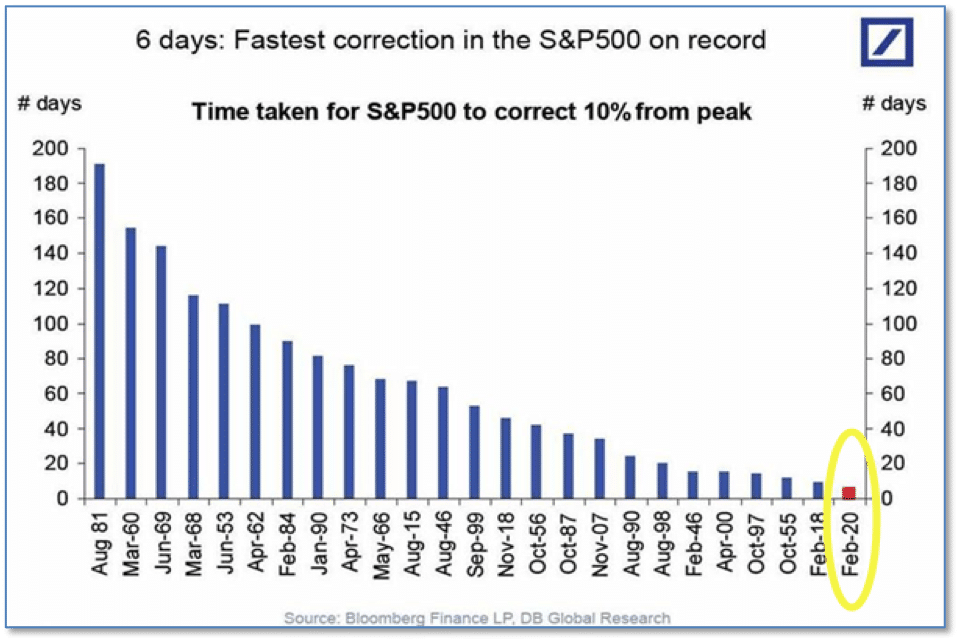
If you blinked twice, you likely missed this week’s market plunge. In fact, as researchers at Deutsche Bank illustrate in the chart below, it’s been the fastest correction for the benchmark S&P 500 index on record.
The time taken for all of the major indexes to give up more than 10% of their value has been just six days. A little over a week ago, on February 19, all three major indexes were hitting record highs.
Riverbend Market Indicators

As a reading of our Bull-Bear Indicator for U.S. Equities (comparative measurements over a rolling one-year timeframe), we remain firmly in Cyclical Bull territory.
Counting up the number of all our indicators that are ‘Up’ for U.S. Equities, we are in ‘Mostly Positive’ territory.
This status is drawn from a scale that goes from Negative, to Mostly Negative, to Neutral, to Mostly Positive, to Positive, and totals-up current readings based on a multitude of timeframes (days/weeks/months/quarters/years, the ‘years’ being the Cyclical Bull or Bear reading).
Week Ahead
Monday: U.S. ISM Manufacturing PMI 50.5 exp, 50.9 prior Reserve Bank of Australia Rate Statement
Tuesday: U.S. IBD/TIPP Economic Optimism 58.1 exp, 59.8 prior Australia GDP q/q +0.4% exp, +0.4% prior China Caixin Services PMI 48.0 exp, 51.8 prior
Wednesday: U.S. ADP Non-Farm Employment Change 170k exp, 291k prior U.S. ISM Non-Manufacturing PMI 55.1 exp, 55.5 prior
Thursday: OPEC Meetings U.S. Factory Orders m/m -0.2% exp, +1.8% prior
Friday: Jobs Report German Factory Orders m/m +1.5% exp, -2.1% prior U.S. Non-Farm Employment Change 185k exp, 225k prior U.S. Average Hourly Earnings m/m +0.3% exp, 0.2% prior U.S. Unemployment Rate +3.5% exp, +3.6% prior


