Based on my research, it is still a bit too early to tell. While I am seeing numerous buy signals in our short-term models, the sectors that have been driving the market higher this past week are not the sectors you would expect to see in a rising interest rate environment.
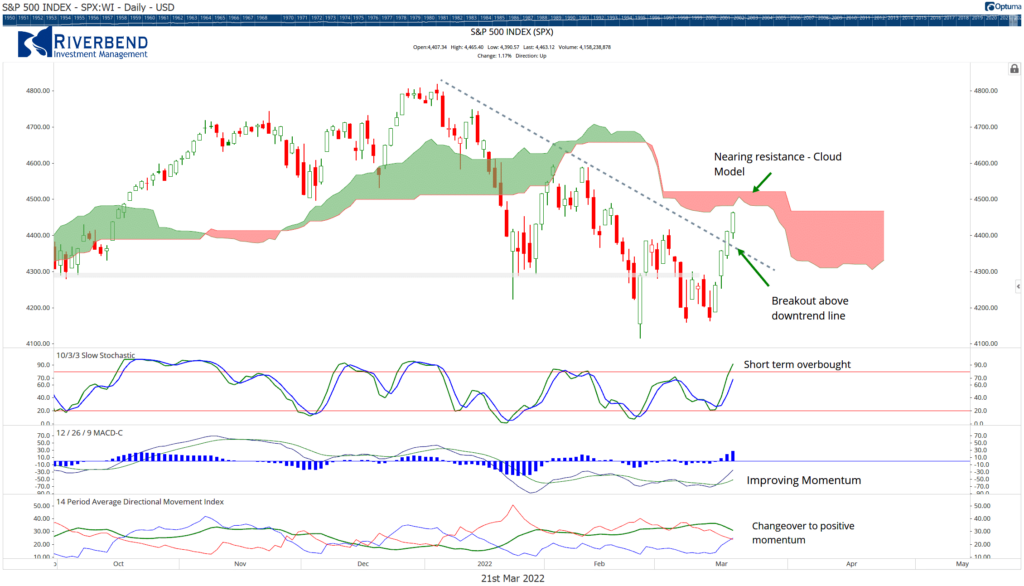
Taking a look at the S&P 500 index, there have been some positives — a breakout above the downtrend line and improving positive momentum.
However, the market starting to look overbought in the short term as the S&P 500 is nearing support within the cloud model.
If the market can breakout above “the cloud”, I would view this as an extremely positive market signal.
Tech is still trading below its 200 day moving average and is beginning to look overbought.
The longer-term relative strength between the S&P 500 and technology still remains in a downtrend as well.
All these factors indicate that last week’s rally in the market may be a short-term countertrend move.
This week will provide us with more evidence whether this is just a short-term move or the beginning of a long-term and tradable move upwards.
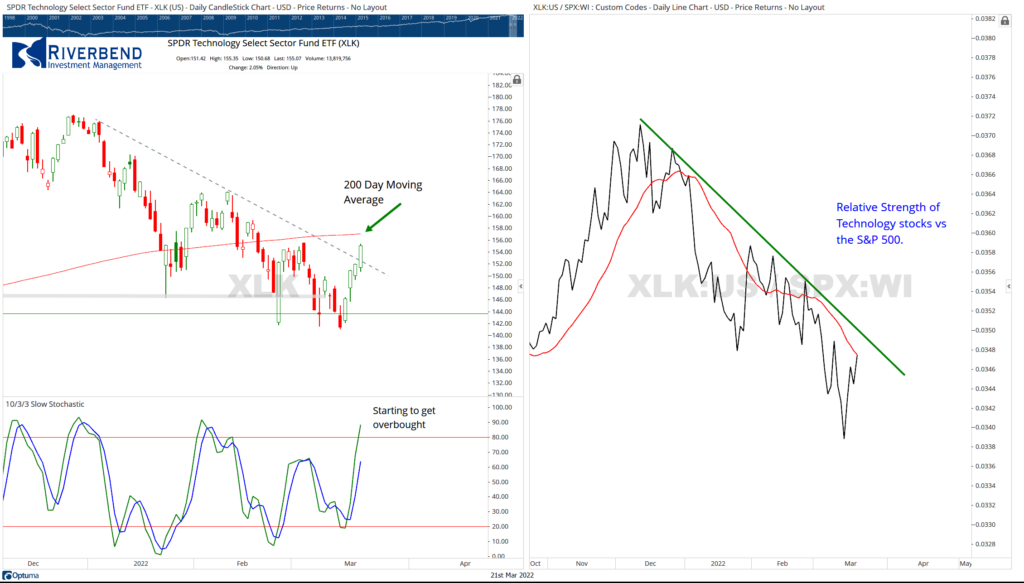
Chart of the Week:
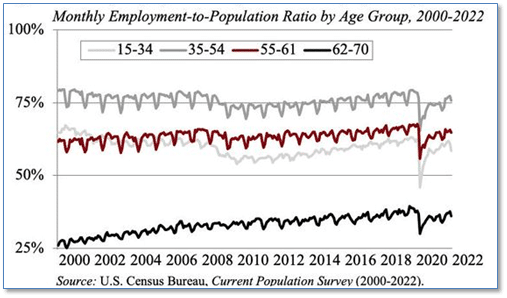
However, a deeper look into labor force data from the U.S. Census Bureau shows this isn’t exactly the case.
For example, for those ages 62-70, 37.4% were employed in January 2020. That percentage dipped to 30% in April 2020 but rebounded to 36% in January 2022.
Similar calculations are done for each age group, shown below. It turns out that the age group contributing most to the “missing workers” total is actually the 15-34 age group.
That group alone accounts for 42% of the “missing workers” total. (Chart by Marketwatch.com)
Riverbend Indicators:
- As a reading of our Bull-Bear Indicator for U.S. Equities (comparative measurements over a rolling one-year timeframe), we remain in Cyclical Bull territory.
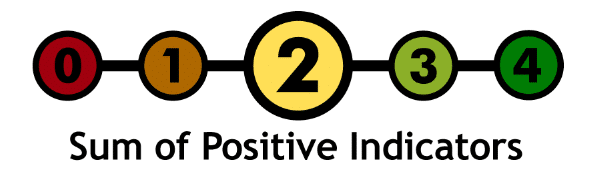
- Counting up of the number of all our indicators that are ‘Up’ for U.S. Equities, the current tally is that two of four are Positive, representing a multitude of timeframes (two that can be solely days/weeks, or months+ at a time; another, a quarter at a time; and lastly, the {typically} years-long reading, that being the Cyclical Bull or Bear status).
The Week Ahead: