[fusion_builder_container hundred_percent=”no” equal_height_columns=”no” menu_anchor=”” hide_on_mobile=”small-visibility,medium-visibility,large-visibility” class=”” id=”” background_color=”” background_image=”” background_position=”center center” background_repeat=”no-repeat” fade=”no” background_parallax=”none” parallax_speed=”0.3″ video_mp4=”” video_webm=”” video_ogv=”” video_url=”” video_aspect_ratio=”16:9″ video_loop=”yes” video_mute=”yes” overlay_color=”” video_preview_image=”” border_size=”” border_color=”” border_style=”solid” padding_top=”” padding_bottom=”” padding_left=”” padding_right=””][fusion_builder_row][fusion_builder_column type=”1_1″ layout=”1_1″ background_position=”left top” background_color=”” border_size=”” border_color=”” border_style=”solid” border_position=”all” spacing=”yes” background_image=”” background_repeat=”no-repeat” padding_top=”” padding_right=”” padding_bottom=”” padding_left=”” margin_top=”0px” margin_bottom=”0px” class=”” id=”” animation_type=”” animation_speed=”0.3″ animation_direction=”left” hide_on_mobile=”small-visibility,medium-visibility,large-visibility” center_content=”no” last=”no” min_height=”” hover_type=”none” link=””][fusion_text]
The big question for many investors is “Are we past the Omicron fear?”
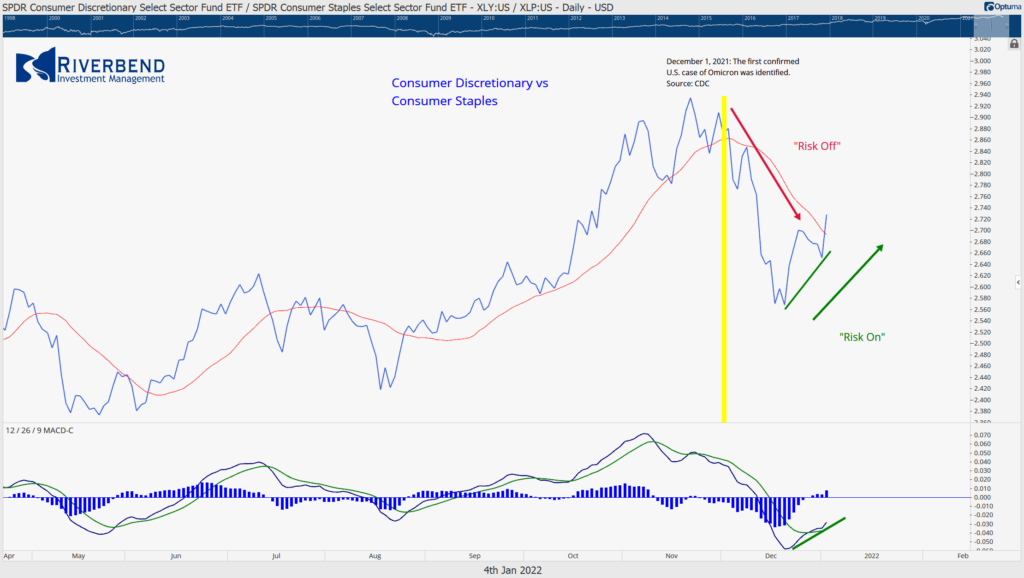
After the December 1st announcement by the CDC that Omicron was found in the US, equity markets went “risk-off”. We can see the change by looking at a relative strength chart of consumer discretionary vs consumer staples.
When investors are happy about the economy, they focus on discretionary spending by consumers. But when investors are worried, they look towards more defensive areas of the market, such as consumer staples. (Remember the rush to buy toilet paper during the height of COVID fears?).
The relationship between discretionary and staples is showing that investors are becoming less worried about the Omicron variant and are more comfortable with risk again:
We can see confirmation of the “risk-on” status by looking at our momentum ranking tables. Generally, we always want to own asset classes that are outperforming cash. During a “risk-off” environment, we will see equity asset classes fall below the cash ranking and defensive areas, such as bonds, rise above. Right now, the markets are showing the opposite of that:
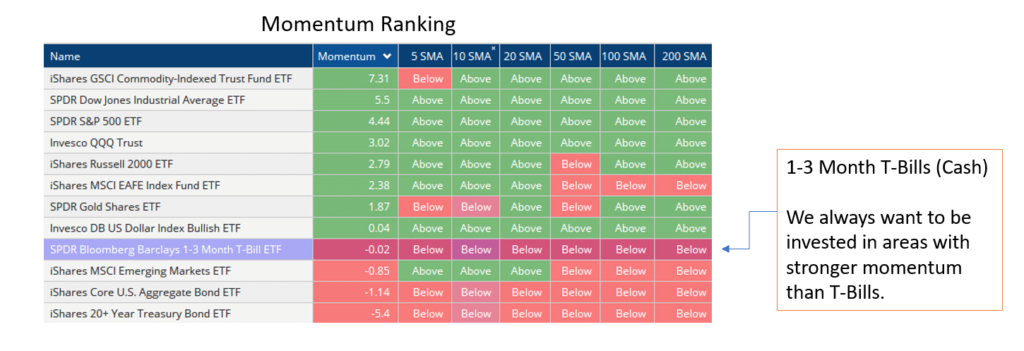
However, the area of the market driving equity momentum higher has not been the usual suspect.
For the past few years, growth stocks have led the US stock market higher – primarily driven by large-cap tech names. Growth stocks have been favored by investors over their value counterparts for some time, and with good reason:
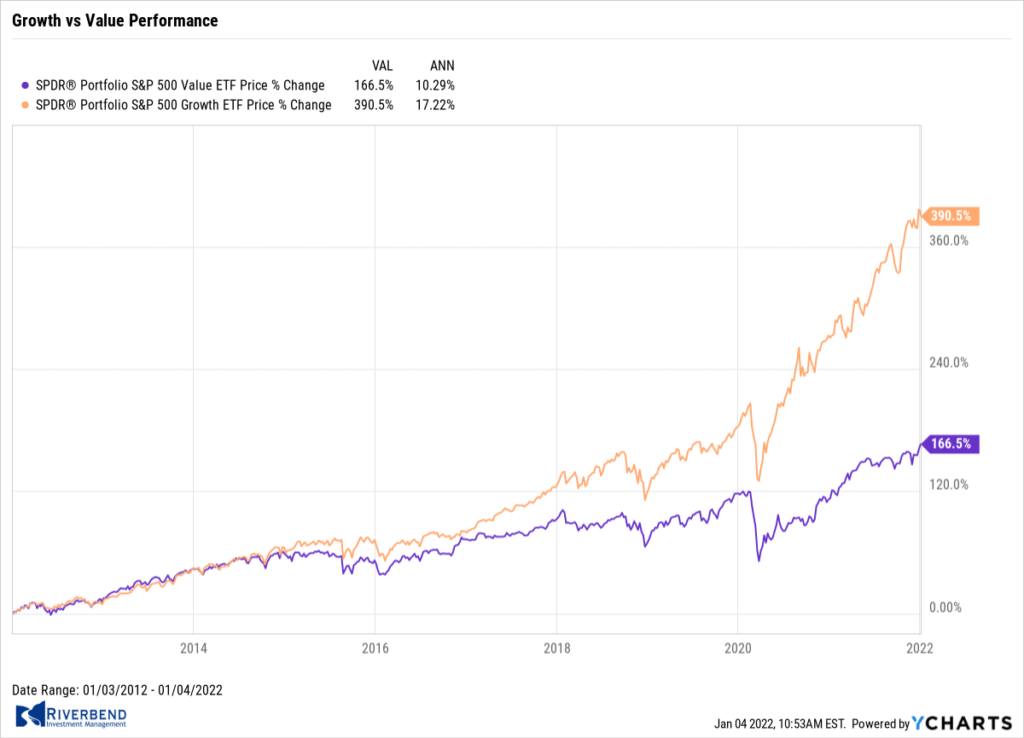
However, we may be starting to see a change in leadership.
Technology names continue to weaken vs the S&P 500 index. Meaning, the outperformance of technology vs the S&P 500 is slowing down:
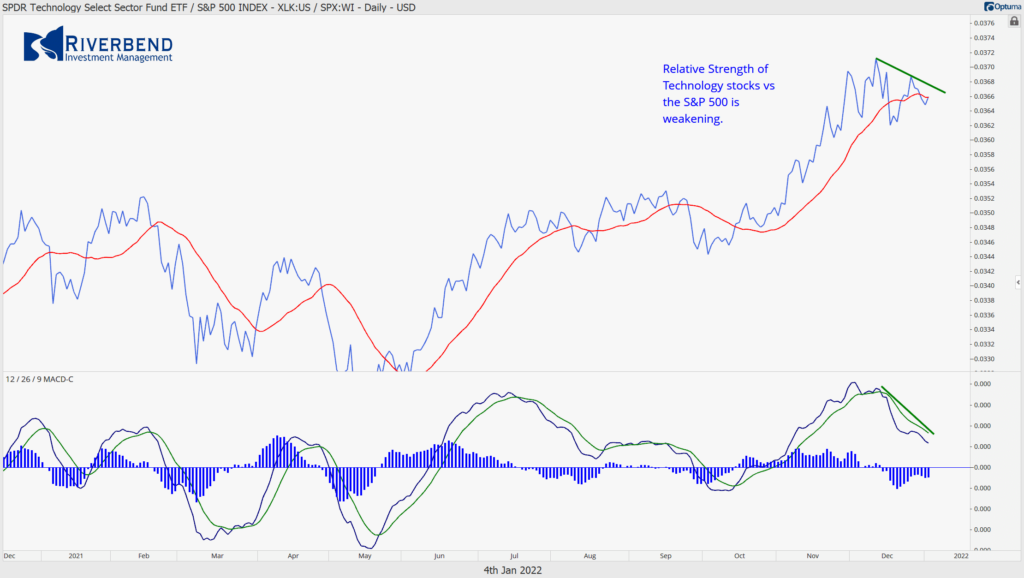
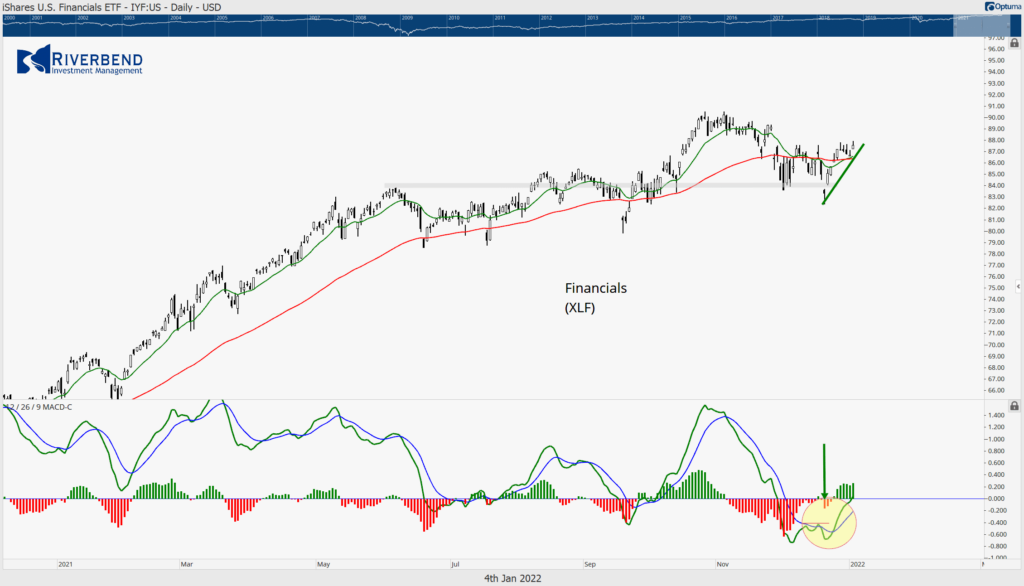
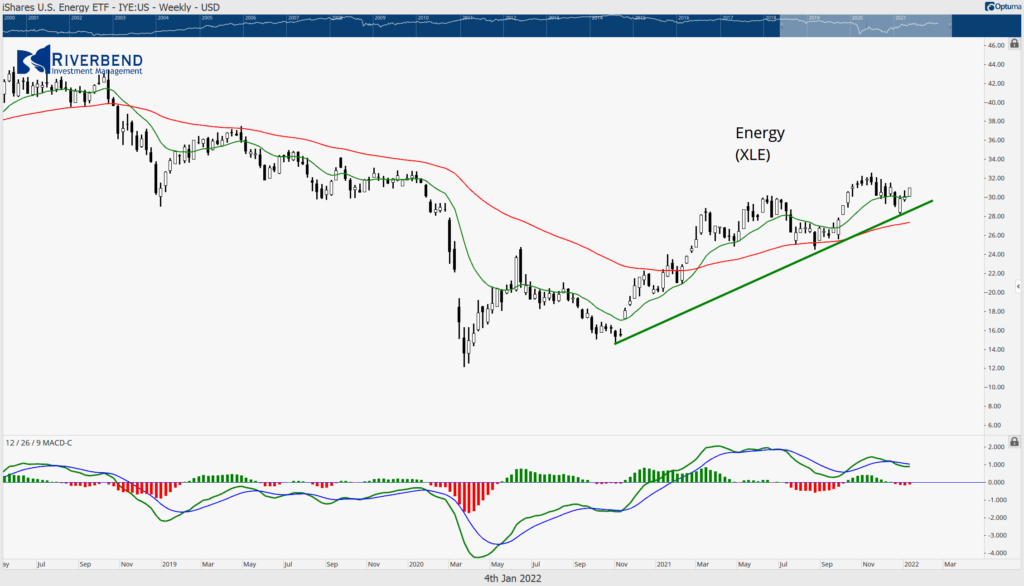
Instead, we are starting to see strength in value areas like financials and energy:
In fact, looking at a relative comparison chart shows the increasing strength of value over growth stocks:
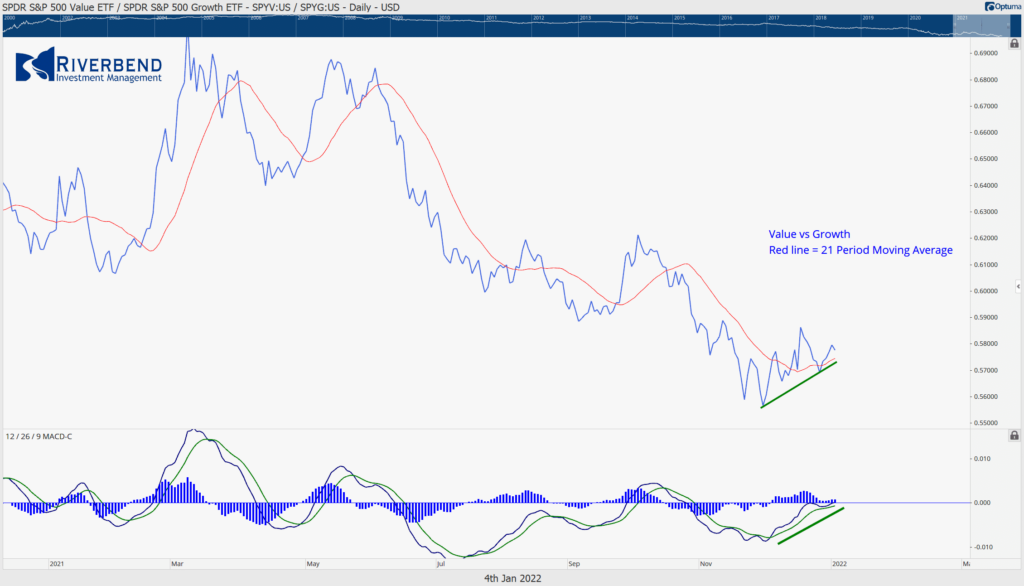
As we enter a new trading year, investors should pay close attention to this relationship. Many have gotten very comfortable with the growth names in their portfolios, 2022 may surprise them.
Chart of the Week:
Ever heard of “Click & Collect”? Visit your local Walmart on any given day and you’ll likely see a row of minivans and sedans with trunks open lining the side of the store and workers loading bins into them.
Initially developed by supermarket chains, this so-called “Click & Collect” service made it possible for consumers to buy online and then conveniently collect their purchases at the nearest store location.
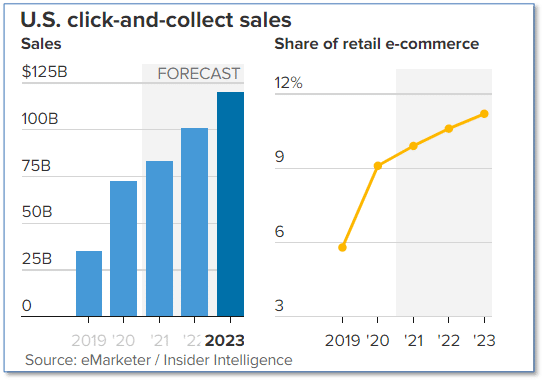
Walmart embraced this business model wholeheartedly and overtook the grocery stores to become by far the biggest click & collect retailer in the country. Data from Insider Intelligence shows Walmart scored 25.4% of all click & collect orders in 2021—which translates to an estimated $20.4 billion in sales.
After Walmart, Home Depot is expected to have the second-largest market share for click and collect in 2021, accounting for an estimated 13.3% of all sales through the channel. Furthermore, Insider Intelligence expects click & collect sales to jump by 21% to $101 billion in 2022.
Riverbend Indicators:

Each week we post notable changes to the various market indicators we follow.
- As a reading of our Bull-Bear Indicator for U.S. Equities (comparative measurements over a rolling one-year timeframe), we remain in Cyclical Bull territory.
- Counting up of the number of all our indicators that are ‘Up’ for U.S. Equities, the current tally is that four of four are Positive, representing a multitude of timeframes (two that can be solely days/weeks, or months+ at a time; another, a quarter at a time; and lastly, the {typically} years-long reading, that being the Cyclical Bull or Bear status).
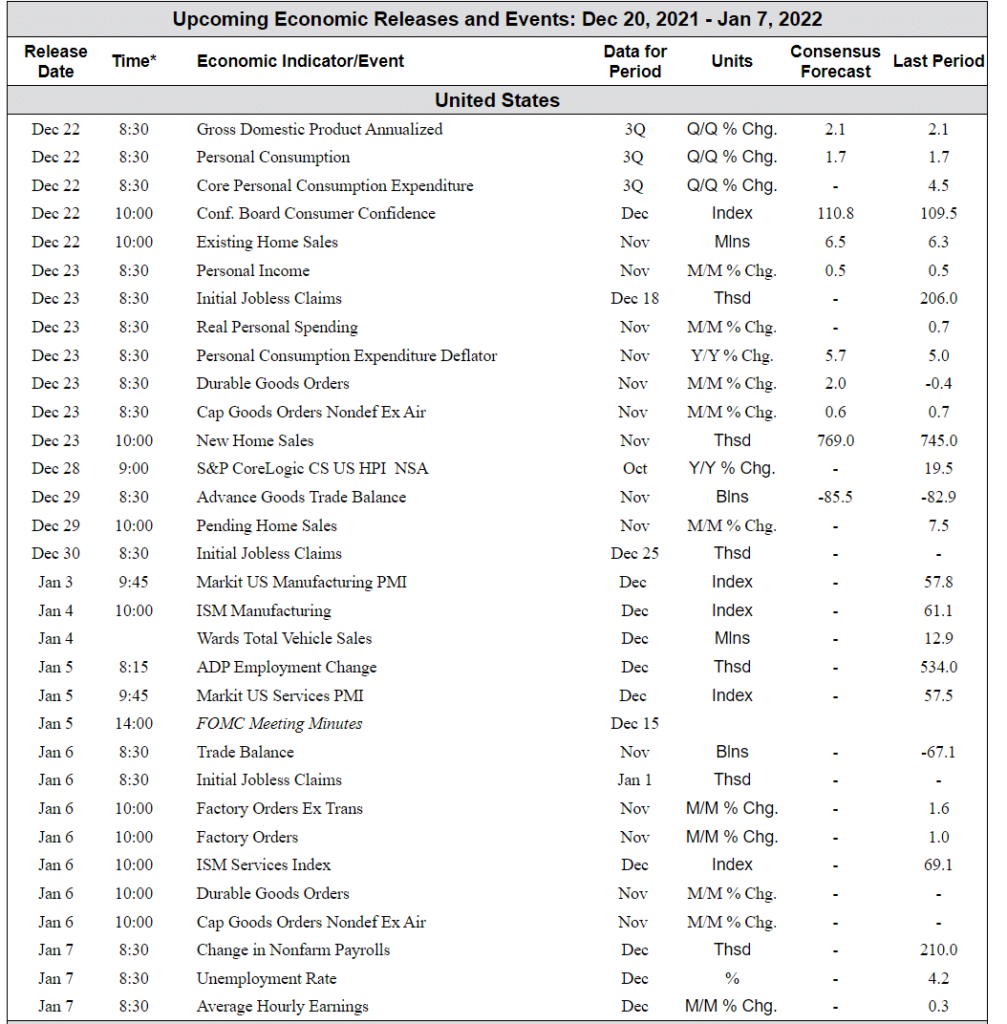
The Week Ahead:
[/fusion_text][/fusion_builder_column][/fusion_builder_row][/fusion_builder_container]


