The US equity markets continue to show strength as we enter a new quarter. Last week the S&P 500 traded above the key levels that I have been closely watching.
As the equity market reached these levels, it became overbought in the short term resulting in a small pullback at the end of the week. We took advantage of this and reallocated our client portfolios to be positioned to take advantage of the rising strength in the market.
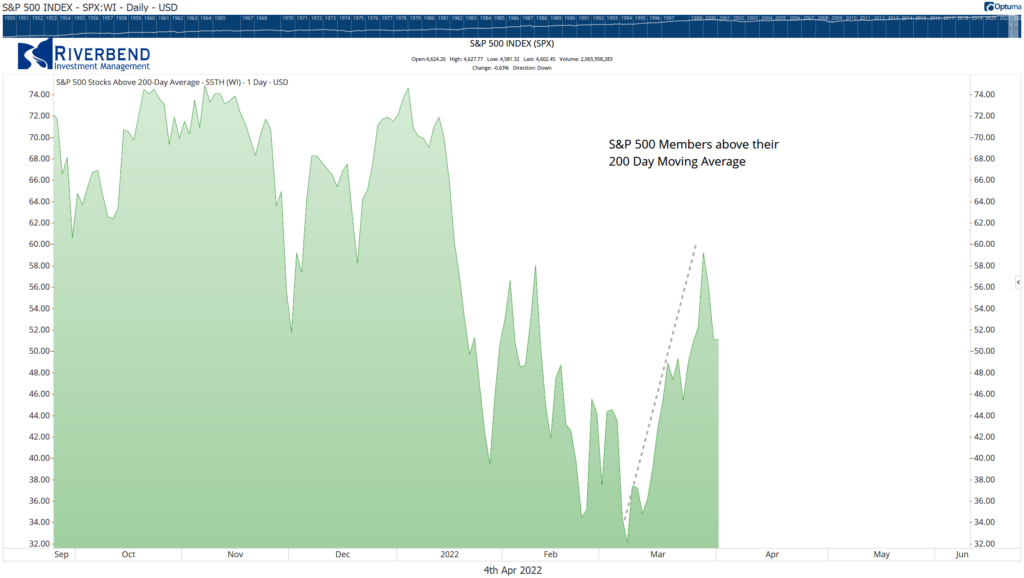
We continue to see more and more stocks trade above their 200-day moving average:
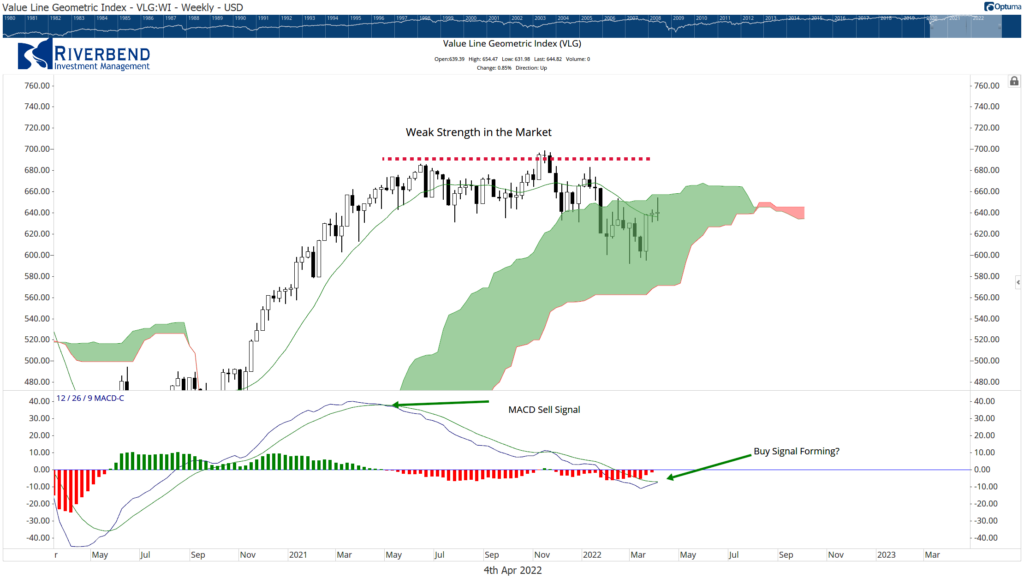
Additionally, the Value Line Geometric Index, which is an equal-weighted index comprised of 1700 stocks (and a great gauge of market strength), is forming its first MACD buy signal since last year.
The chart below shows the index with a sell signal generated last April. Afterward, the majority of the market, with the exception of tech stocks, was weak and traded sideways.
(Note: No signal is 100% accurate. Instead, it can be combined with other signals to give us a better understanding of market direction)
The increased positive momentum in the market coincides with the start of April – a historically strong month in the stock market.
Since the 1950s, the month of April has been the strongest month of the year for equities. Over the past 16 years, April has rewarded investors in 15 of those years:
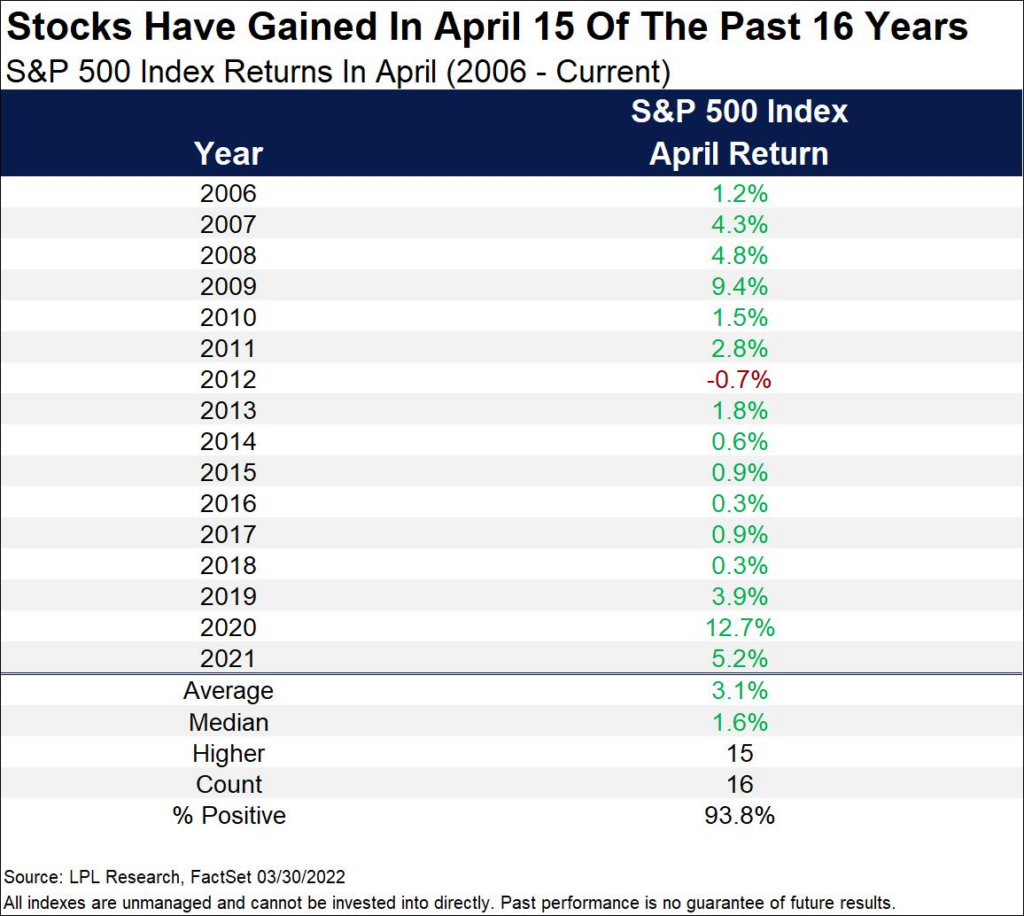
Chart of the Week:
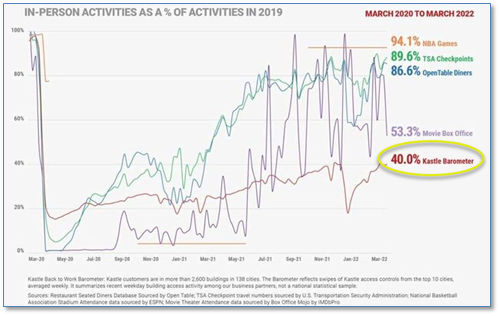
As the pandemic winds down, life in many respects is almost back to normal—except for one area—office space.
According to building security provider Kastle, which monitors the use of security and ID cards in office buildings, the “Kastle Barometer” of average weekly occupancy for offices is still just 40% of pre-pandemic levels.
In contrast, the NBA is reporting attendance just 6% down from 2019 levels, and the TSA is reporting air traffic down 11%.
Nicholas Colas, co-founder of DataTrek Resources, attributes the stagnation to multiple factors. Not only did the pandemic show businesses that, in many cases, their office functions could be performed online, but the current labor market has given employees a strong upper hand in the job market.
“Many businesses want their workers back in the office but know that pushing the issue risks increasing labor force turnover. Many workers want – and can demand – flexible work schedules where they continue to work from home some or all of the time,” he said.
Riverbend Indicators:
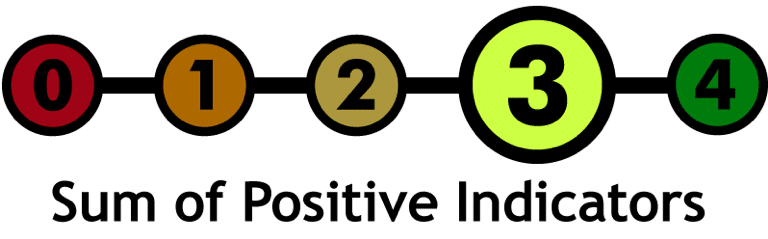
- As a reading of our Bull-Bear Indicator for U.S. Equities (comparative measurements over a rolling one-year timeframe), we remain in Cyclical Bull territory.
- Counting up the number of all our indicators that are ‘Up’ for U.S. Equities, the current tally is that three of four are Positive, representing a multitude of timeframes (two that can be solely days/weeks, or months+ at a time; another, a quarter at a time; and lastly, the {typically} years-long reading, that being the Cyclical Bull or Bear status).
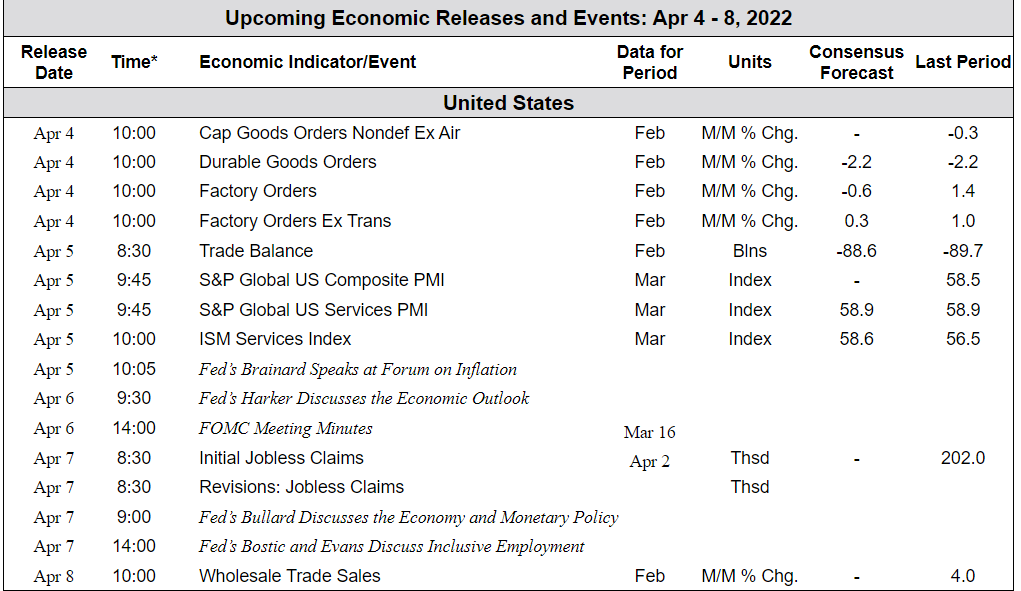
The Week Ahead: