This week, we will get better insight into the Fed’s projection for future interest rate hikes. The FOMC meets this Wednesday and is expected to raise rates by .25% or possibly (but unlikely) more.
Last month, the markets were starting to price in a .50% increase in rates. However, with the recent spike in oil prices – which can be deflationary in the short term – and the unknowns surrounding the Ukraine crisis, the odds of a .50% increase have dropped to almost zero.
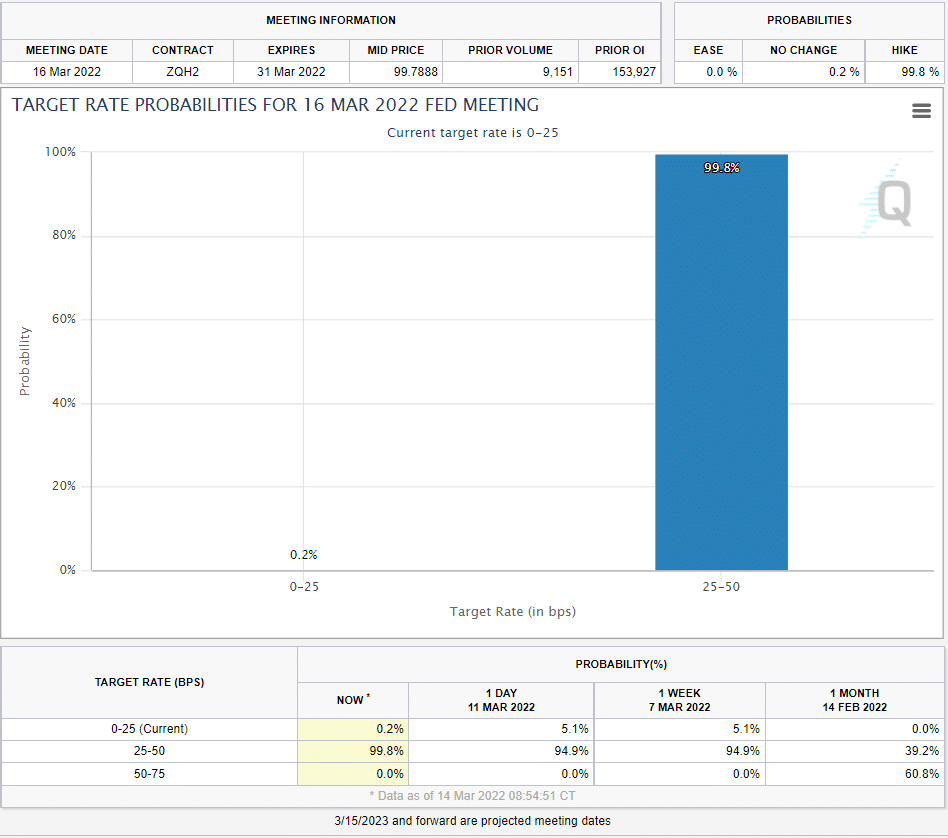
Source: CMEgroup
What will be important to market watchers is what the Fed says this week.
Numerous analysts are predicting multiple rate hikes this year. Goldman Sachs, for example, has been calling for up to 7 rate hikes this year.
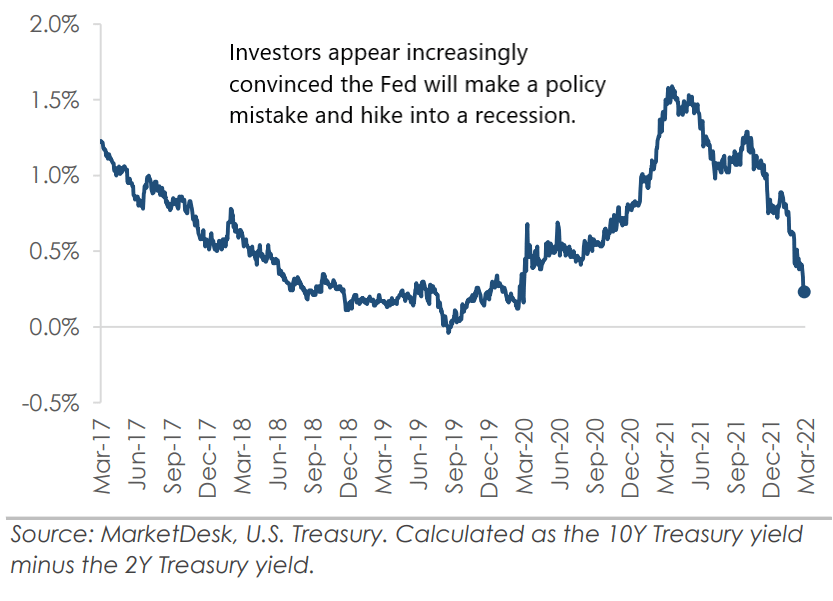
Investors are starting to worry that the aggressive stance by the Fed is a policy mistake that will cause a recession.
If we take a look at the spread between 10-year and 2-year treasury bonds, we can see it is narrowing. Historically when the spread narrows to zero, it is an early warning sign of a recession.
A negative 10-2 spread has predicted every recession from 1955 to 2018, however, it has occurred 6-24 months before a recession happens, and is thus seen as a far-leading indicator.
Meanwhile, equity markets continue to struggle and remain in a downtrend. The S&P 500 is nearing a “death cross” – when its 50-day moving average crosses below the 200-day moving average.
While the results are mixed on whether this is an accurate market indicator, it is an area where some long-term investors may exit the market.
As a result of this, we may see some additional volatility. Plus you may hear it mentioned on the news as the “death cross” is too alluring of a term to ignore.
So, is there any good news?
History shows equities traded lower in the 1-2 months after the first 2004 and 2016 rate hikes, which suggests the market could find an investable bottom in late April/early May.
The bottom may come quicker this time as investors seem to have already priced in the worst-case scenarios. Any positive news may cause investors to rush back into the market.
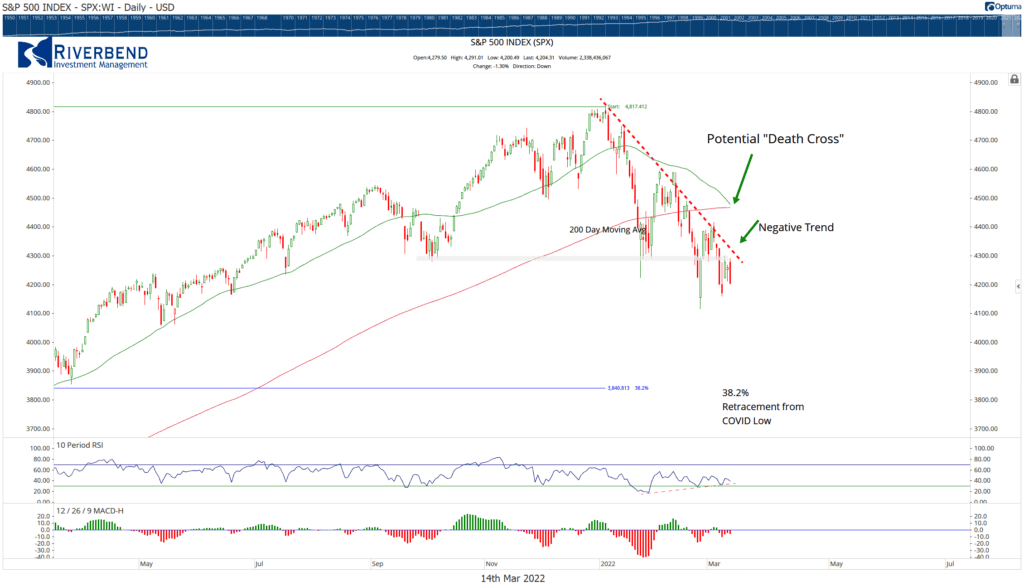
Chart of the Week:
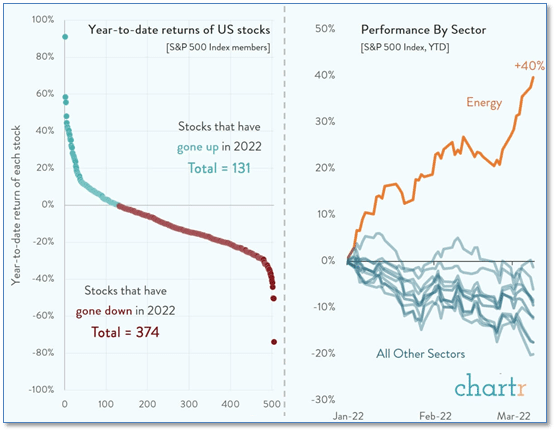
The S&P 500 is down about -12% for the young year. About a quarter of the stocks in the S&P 500 are up so far, and three-quarters are down.
Energy is the only sector enjoying a good start to 2022, up about 40%. Every other sector is down year to date.
Losses are not confined to obscure second-tier companies – among the worst-performing stocks are some big names: Netflix (down -42%), Meta (formerly known as Facebook) (‑44%), Moderna (-50%) and PayPal (-50%).
Riverbend Indicators:
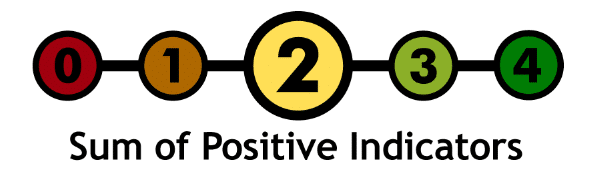
- As a reading of our Bull-Bear Indicator for U.S. Equities (comparative measurements over a rolling one-year timeframe), we remain in Cyclical Bull territory.
- Counting up of the number of all our indicators that are ‘Up’ for U.S. Equities, the current tally is that two of four are Positive, representing a multitude of timeframes (two that can be solely days/weeks, or months+ at a time; another, a quarter at a time; and lastly, the {typically} years-long reading, that being the Cyclical Bull or Bear status).
The Week Ahead:
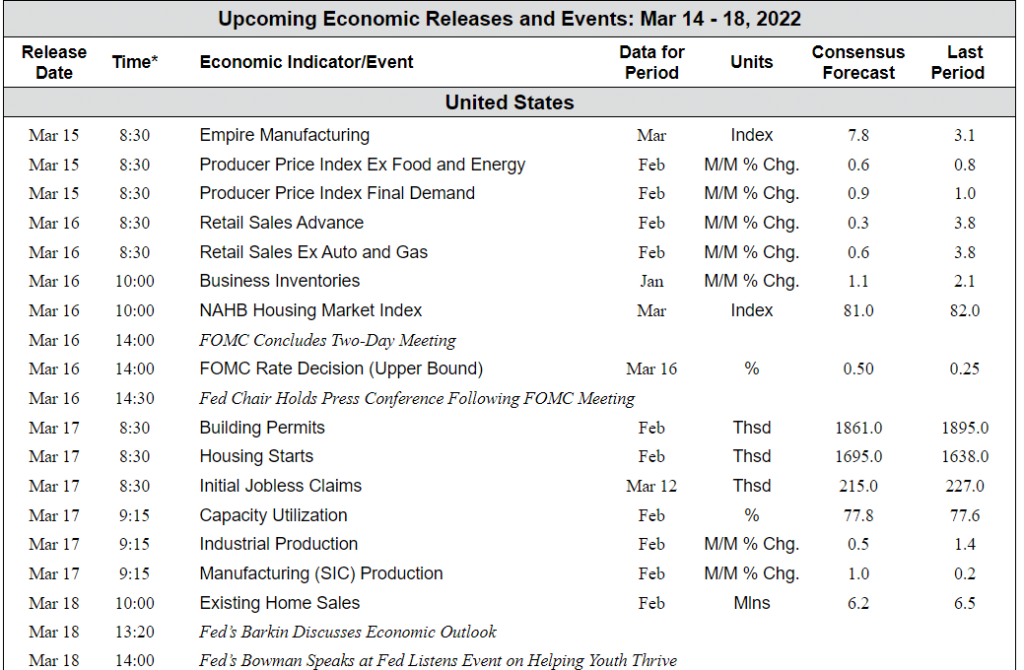
Source: Bloomberg, TD Economics


