[fusion_builder_container hundred_percent=”no” equal_height_columns=”no” menu_anchor=”” hide_on_mobile=”small-visibility,medium-visibility,large-visibility” class=”” id=”” background_color=”” background_image=”” background_position=”center center” background_repeat=”no-repeat” fade=”no” background_parallax=”none” parallax_speed=”0.3″ video_mp4=”” video_webm=”” video_ogv=”” video_url=”” video_aspect_ratio=”16:9″ video_loop=”yes” video_mute=”yes” overlay_color=”” video_preview_image=”” border_size=”” border_color=”” border_style=”solid” padding_top=”” padding_bottom=”” padding_left=”” padding_right=””][fusion_builder_row][fusion_builder_column type=”1_6″ spacing=”” center_content=”no” link=”” target=”_self” min_height=”” hide_on_mobile=”small-visibility,medium-visibility,large-visibility” class=”” id=”” hover_type=”none” border_size=”0″ border_color=”” border_style=”solid” border_position=”all” border_radius=”” box_shadow=”no” dimension_box_shadow=”” box_shadow_blur=”0″ box_shadow_spread=”0″ box_shadow_color=”” box_shadow_style=”” padding_top=”” padding_right=”” padding_bottom=”” padding_left=”” margin_top=”” margin_bottom=”” background_type=”single” gradient_start_color=”” gradient_end_color=”” gradient_start_position=”0″ gradient_end_position=”100″ gradient_type=”linear” radial_direction=”center” linear_angle=”180″ background_color=”” background_image=”” background_image_id=”” background_position=”left top” background_repeat=”no-repeat” background_blend_mode=”none” animation_type=”” animation_direction=”left” animation_speed=”0.3″ animation_offset=”” filter_type=”regular” filter_hue=”0″ filter_saturation=”100″ filter_brightness=”100″ filter_contrast=”100″ filter_invert=”0″ filter_sepia=”0″ filter_opacity=”100″ filter_blur=”0″ filter_hue_hover=”0″ filter_saturation_hover=”100″ filter_brightness_hover=”100″ filter_contrast_hover=”100″ filter_invert_hover=”0″ filter_sepia_hover=”0″ filter_opacity_hover=”100″ filter_blur_hover=”0″ last=”no”][/fusion_builder_column][fusion_builder_column type=”2_3″ layout=”1_1″ background_position=”left top” background_color=”” border_size=”” border_color=”” border_style=”solid” border_position=”all” spacing=”yes” background_image=”” background_repeat=”no-repeat” padding_top=”” padding_right=”” padding_bottom=”” padding_left=”” margin_top=”0px” margin_bottom=”0px” class=”” id=”” animation_type=”” animation_speed=”0.3″ animation_direction=”left” hide_on_mobile=”small-visibility,medium-visibility,large-visibility” center_content=”no” last=”no” min_height=”” hover_type=”none” link=””][fusion_text]
[/fusion_text][fusion_vimeo id=”536004383″ alignment=”center” width=”1000″ height=”” autoplay=”false” api_params=”” hide_on_mobile=”small-visibility,medium-visibility,large-visibility” class=”” css_id=”” /][fusion_text]
U.S. Markets: 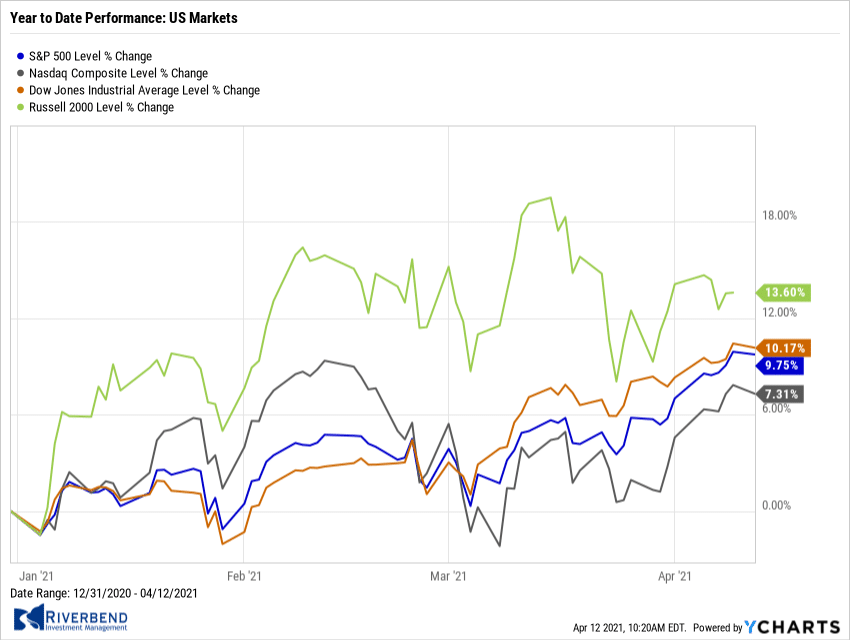
Most of the major U.S. benchmarks moved steadily to new record highs this week, although the small-cap Russell 2000 index recorded a modest loss.
The Dow Jones Industrial Average rose 2% to finish the week at 33,801, while the technology-heavy NASDAQ Composite rallied 3.1% to close at 13,900.
By market cap, the large cap S&P 500 finished up 2.7%, while the mid-cap S&P 400 added 0.9%. The small-cap Russell 2000 finished down -0.5%.
International Markets: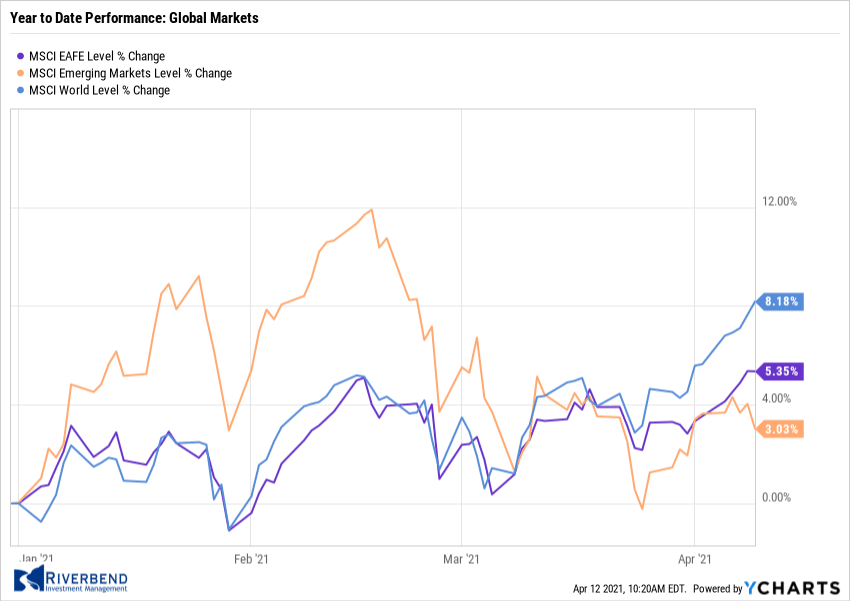
Canada’s TSX rose 1.3%, while the United Kingdom’s FTSE 100 gained 2.6%. On Europe’s mainland, France’s CAC 40 and Germany’s DAX added 1.1% and 0.8%, respectively.
In Asia, China’s Shanghai Composite retreated -0.5%. Japan’s Nikkei finished the week up 1.3%.
As grouped by Morgan Stanley Capital International, developed markets closed the week up 1.5%, emerging markets retreated -0.6%.
Commodities: 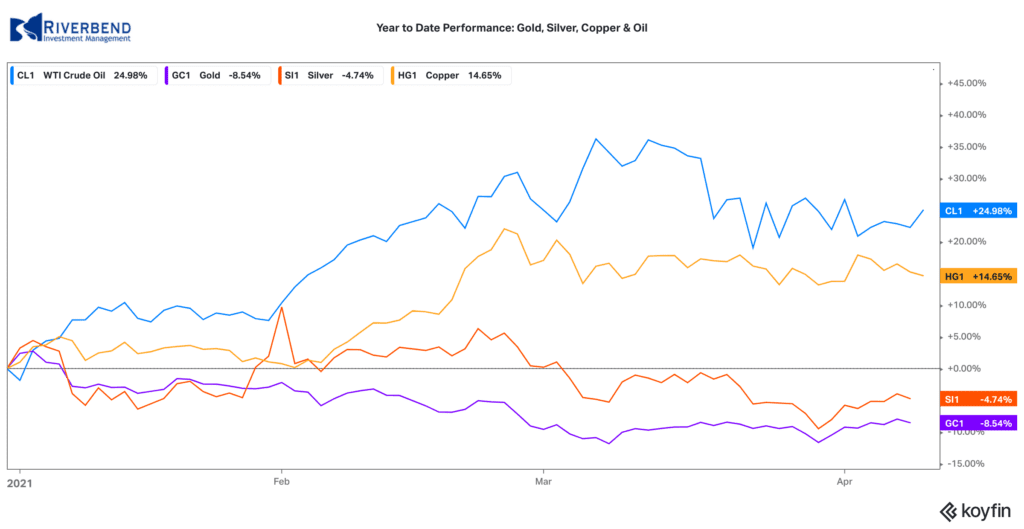
Precious metals found firm footing while trading in a narrow range for a fourth consecutive week. Gold rose $16.40 to $1744.80 an ounce, while Silver finished the week up 1.5% to $25.33 per ounce.
Energy declined for a fourth time in five weeks. West Texas Intermediate crude oil fell -3.5% to $59.32 per barrel.
Copper, viewed by some analysts as a barometer of world economic health due to its wide variety of industrial uses, ended the week up 1.2%.
U.S. Economic News: 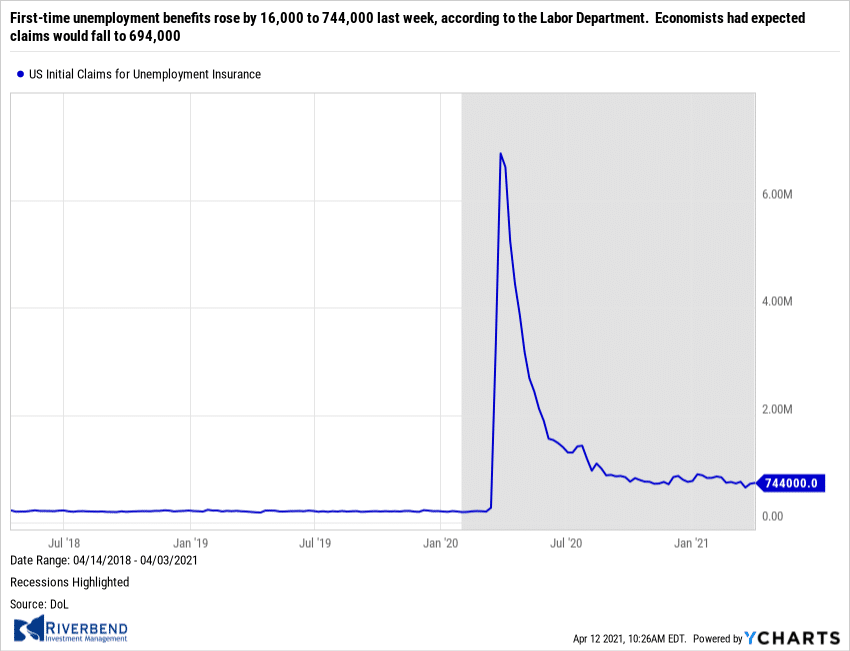
The number of Americans filing first-time unemployment benefits rose by 16,000 to 744,000 last week, according to the Labor Department. Economists had expected claims would fall to 694,000. New claims rose sharply in California and New York. There were more modest declines in Ohio and Texas.
Continuing claims, which counts the number of people already receiving benefits, declined by 16,000 to a seasonally-adjusted 3.09 million. That’s the lowest level for continuing claims in a year. Despite the recent tick-up, claims are expected to continue to trend lower as the economy re-opens and more Americans are vaccinated.
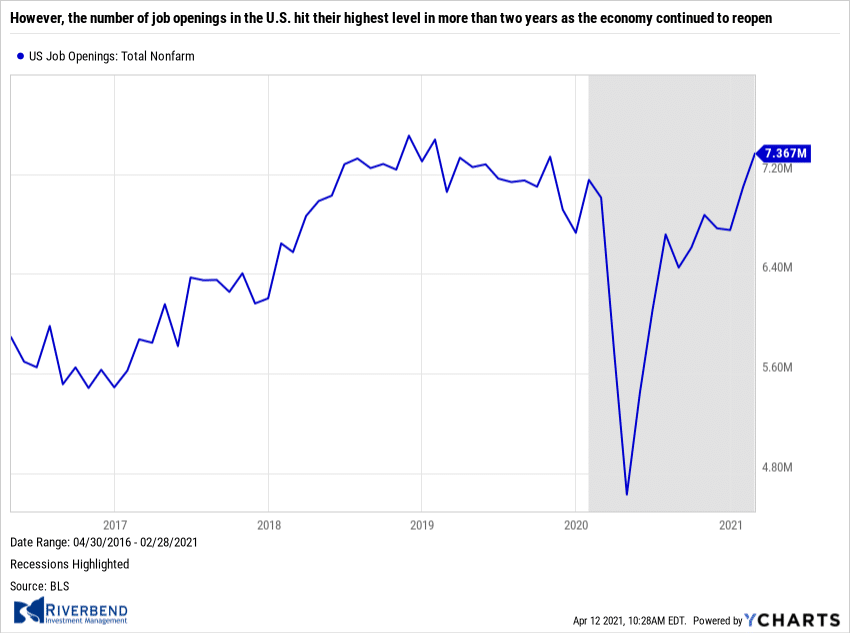 The number of job openings in the U.S. hit their highest level in more than two years as the economy continued to reopen. The Labor Department’s Job Openings and Labor Turnover Survey (JOLTS) showed that job openings jumped to 7.37 million from 7.1 million in January. Job openings rose the most in February in health care, hotels, restaurants, theaters, museums and parks and recreation.
The so-called ‘quits rate’, rumored to be closely watched by the Federal Reserve as it is assumed a worker would only quit a position in favor of a more lucrative one, remained unchanged at 2.6% among private-sector employees and is back to pre-crisis levels. At the height of the coronavirus crisis, the quits rate had fallen to a seven-year low of 1.8%.
Activity in the services side of the U.S. economy, which makes up more than two-thirds of U.S. economic output, soared in March as governments lifted businesses restrictions and rising vaccinations gave Americans more confidence to go out and shop, travel or take a vacation.
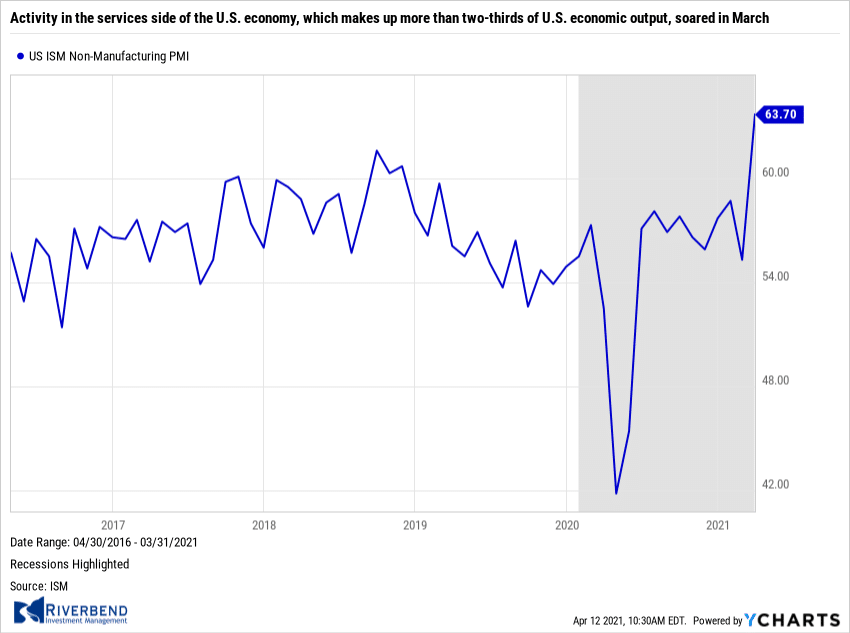 A survey of business leaders at service-oriented firms such as banks, retailers and restaurants jumped to 63.7 last month from 55.3 in February, the Institute for Supply Management (ISM) reported. The month-over-month jump was the highest on record since ISM began the survey in 1997. All 18 services industries tracked by the ISM expanded in March. In the details of the report, new orders and production made big leaps as each sub-index also hit their highest levels on record.
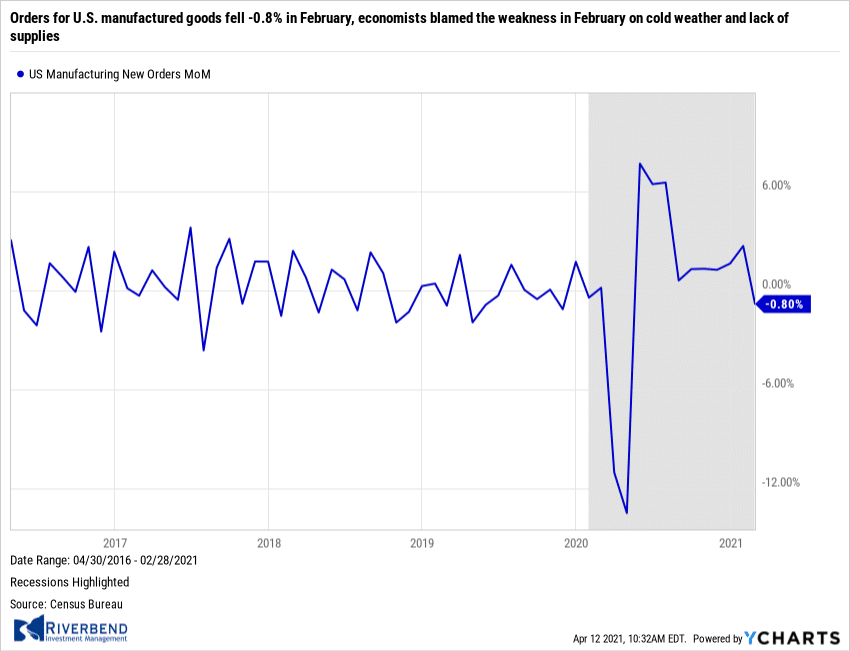 Orders for U.S. manufactured goods fell -0.8% in February, the Commerce Department reported. This was the first decline since the depths of the coronavirus recession last April. Economists were expecting just a -0.6% decline. Orders for so-called ‘durable goods’—items expected to last at least three years—fell a revised -1.2% in February. Orders for ‘non-durable goods’ were down -0.4% for the month. Economists blamed the weakness in February on cold weather. Analysts also suggested the lack of key supplies may also have placed a role.
According to minutes of their March meeting released this week, Federal Reserve officials seemed divided almost evenly over their outlook for inflation. “Several” Fed officials said that supply bottlenecks and strong demand would push up price inflation “more than anticipated,” the minutes said.
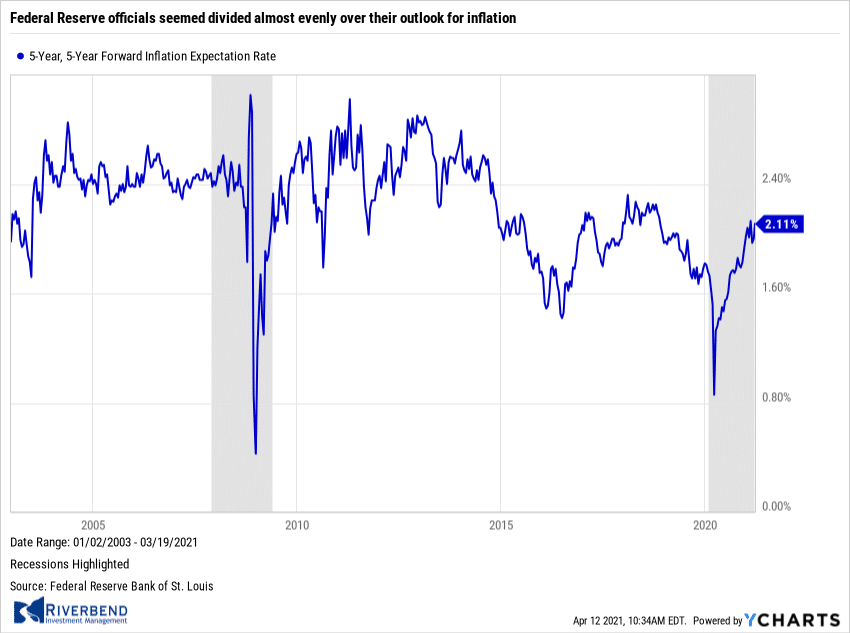 At the same time, “several” other Fed officials expressed belief that the factors that had contributed to low inflation over the past decade “could again exert more downward pressure on inflation than expected.” The Fed upgraded its forecast for growth and employment and forecast that headline inflation would rise to 2.4% rate this year — above the 2% target — but then settle down to 2.1% by 2023. Despite these changes, the Fed’s median forecast was for no liftoff in interest rates through 2023.
Chart of the Week: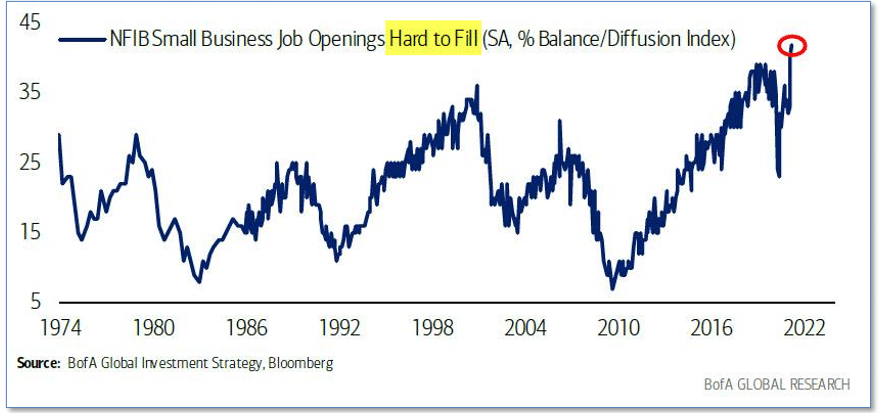
“Signs, signs, everywhere a sign” sang the 70’s Canadian rock group Five Man Electrical Band. The sign that is everywhere now is “Help Wanted”!
The latest data from the Bureau of Labor Statistics shows there are over 100 million Americans who are currently out of the labor force. But of that group, just 6.85 million people are currently looking for a job. Why are less than 7% of available workers looking for a job?
Interviews reveal the prevailing attitude: it pays darn well to not work! The trillions of dollars in government stimulus are now incentivizing potential workers not to seek gainful employment, but to sit back and collect the next “stimmy check” for not working.
The chart above, from Bank of America’s Global Research department, plots the National Federation of Independent Business (NFIB) “Hard to Fill” job openings category. As can be seen, the current level of 40 is the highest in the history of the index.
The Week Ahead:
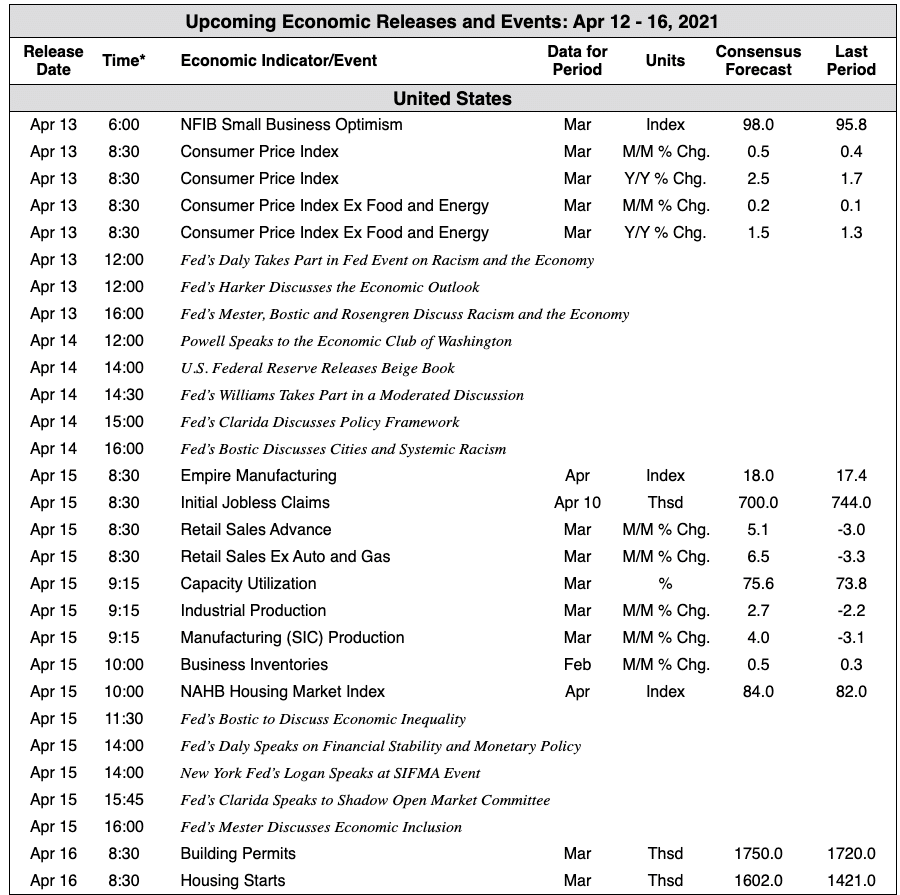
Source: Bloomberg, TD Economics
[/fusion_text][/fusion_builder_column][fusion_builder_column type=”1_6″ spacing=”” center_content=”no” link=”” target=”_self” min_height=”” hide_on_mobile=”small-visibility,medium-visibility,large-visibility” class=”” id=”” hover_type=”none” border_size=”0″ border_color=”” border_style=”solid” border_position=”all” box_shadow=”no” box_shadow_blur=”0″ box_shadow_spread=”0″ box_shadow_color=”” box_shadow_style=”” background_type=”single” gradient_start_position=”0″ gradient_end_position=”100″ gradient_type=”linear” radial_direction=”center” linear_angle=”180″ background_color=”” background_image=”” background_image_id=”” background_position=”left top” background_repeat=”no-repeat” background_blend_mode=”none” animation_type=”” animation_direction=”left” animation_speed=”0.3″ animation_offset=”” filter_type=”regular” filter_hue=”0″ filter_saturation=”100″ filter_brightness=”100″ filter_contrast=”100″ filter_invert=”0″ filter_sepia=”0″ filter_opacity=”100″ filter_blur=”0″ filter_hue_hover=”0″ filter_saturation_hover=”100″ filter_brightness_hover=”100″ filter_contrast_hover=”100″ filter_invert_hover=”0″ filter_sepia_hover=”0″ filter_opacity_hover=”100″ filter_blur_hover=”0″ last=”no”][/fusion_builder_column][/fusion_builder_row][/fusion_builder_container]


