Market Recap
U.S. Markets:
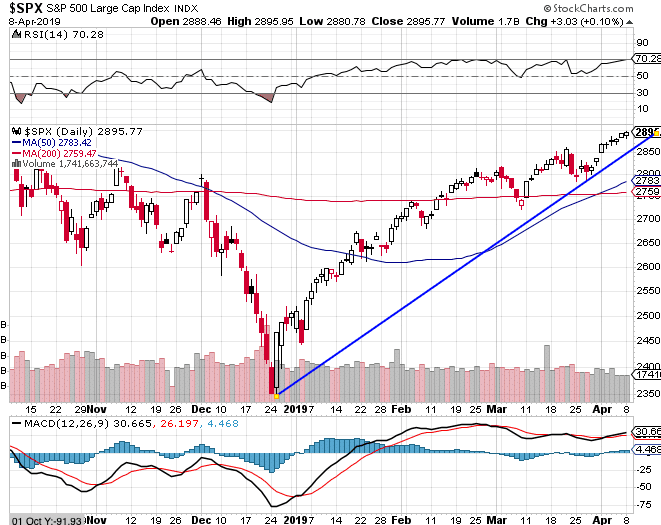
U.S. stocks recorded solid gains for the week and most major indexes are now back within 2% of their all-time highs, set last September. The S&P 500 index recorded seven consecutive days of gains, its longest winning streak since 2017.
The Dow Jones Industrial Average added 496 points last week to close at 26,424, a gain of 1.9%. The technology-heavy NASDAQ Composite gained 2.7% and closed at 7,938.
By market cap, the large cap S&P 500 rose 2.1%, while both the S&P 400 mid cap index and small cap Russell 2000 index added 2.8%.
International Markets:
All major international markets finished in the green last week. Canada’s TSX rose 1.8% and the United Kingdom’s FTSE added 2.3%. On Europe’s mainland, France’s CAC 40 gained 2.4%, Germany’s DAX surged 4.2%, and Italy’s Milan FTSE rose 2.2%.
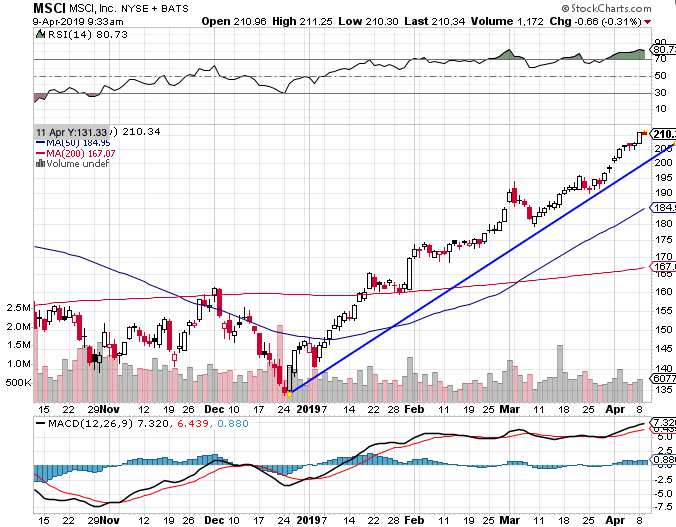
In Asia, China’s Shanghai Composite jumped 5.0%, while Japan’s Nikkei added 2.8%. As grouped by Morgan Stanley Capital International, developed markets rose 2.1%, while emerging markets surged 3.5%.
Commodities:
Precious metals were weak, reacting to strength in the stock markets. Gold retreated -0.2% to close at $1295.60 an ounce, and Silver also finished down -0.2% at $15.09 per ounce.
Energy continued to be bid higher, now up five consecutive weeks. West Texas Intermediate crude oil surged 4.9%, closing at $63.09 per barrel.
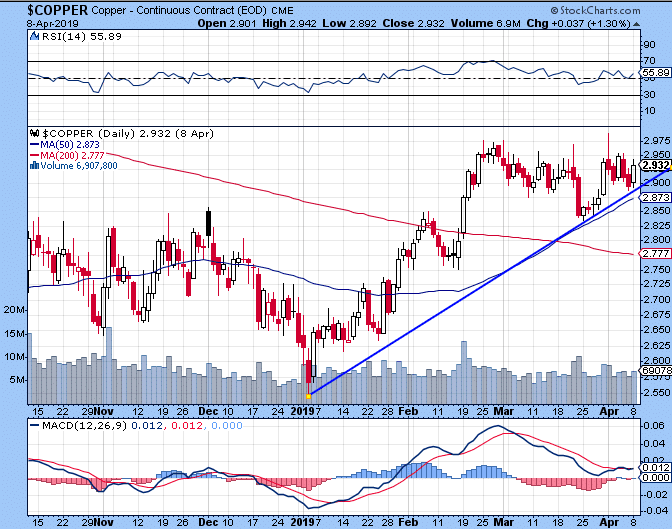
The industrial metal copper, viewed by analysts as a barometer of global economic health due to its variety of industrial uses, retreated -1.4% last week.
U.S. Economic News:
The number of people applying for first-time unemployment benefits at the end of last month fell to their lowest level in almost 50 years—a very reassuring sign for the economy amid other reports which hinted at slower growth early in the year. The Labor Department reported initial jobless claims fell by 10,000 to 202,000.
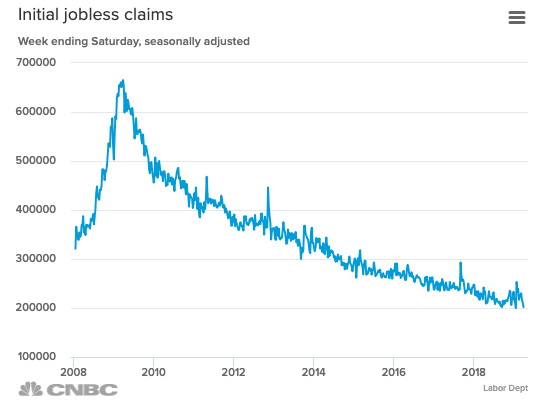
Economists had forecast a reading of 216,000. Jobless claims have fallen three weeks in a row and are down sharply from the beginning of the year. The downward descent is also apparent in the less-volatile monthly moving average of claims, which fell by 4,000 to 213,000. That number is at its lowest level since October. Continuing claims, which counts the number of people already receiving benefits, slipped by 38,000 to 1.72 million.
The U.S. economy added 196,000 jobs last month, handily beating economists’ forecasts for 179,000 new jobs and a positive sign of the health of the U.S. economy. Hiring increased in most major segments of the economy, especially among health care and white-collar employers. Health-care providers led the way with 49,000 new positions added, followed by professional and technical firms, which added 34,000.
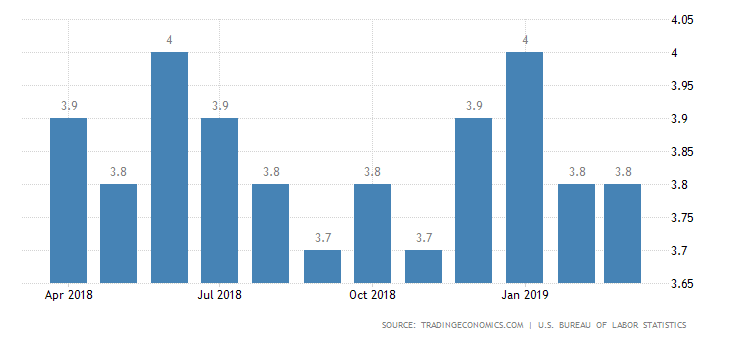
The unemployment rate held near its 50-year low of 3.8%, the Labor Department reported. Although a significant number of large companies have announced layoffs recently, most firms are still looking to hire. Employers continue to report a shortage of skilled labor. Addressing concerns that a strong labor market may lead to inflation and therefore Fed rate hikes, Eric Winograd, senior economist at AllianceBernstein wrote, “The labor market is certainly strong enough to keep the economy moving forward, but it isn’t generating the sort of inflationary pressure that would push the Fed off of its patient stance.”
Orders for “durable goods” (goods expected to last at least 3 years), slumped in February largely due to fewer orders for commercial aircraft and defense-related hardware. The Commerce Department reported durable-goods orders sank -1.6%, however the reading was better than the forecast of a -2.1% decline.
It was its first negative reading in four months. Stripping out the volatile transportation component, orders actually rose 0.1%. Core capital-goods orders, a key measure of business investment, fell for the third time in four months—down -0.1%. Business investment has been flat for the last three months and up just 2.6% over the past year. That is down sharply from the 10% year-over-year pace seen a year and a half ago.
Sales at the nation’s retailers fell in February for the second time in the last three months, according to the Commerce Department. The weaker sales number was another sign of the slowdown affecting broad areas of the U.S. economy. Retail sales declined -0.2% in February, far lower than the 0.3% increase economists had expected. However, offsetting the decline was a bigger gain in January than was initially reported.
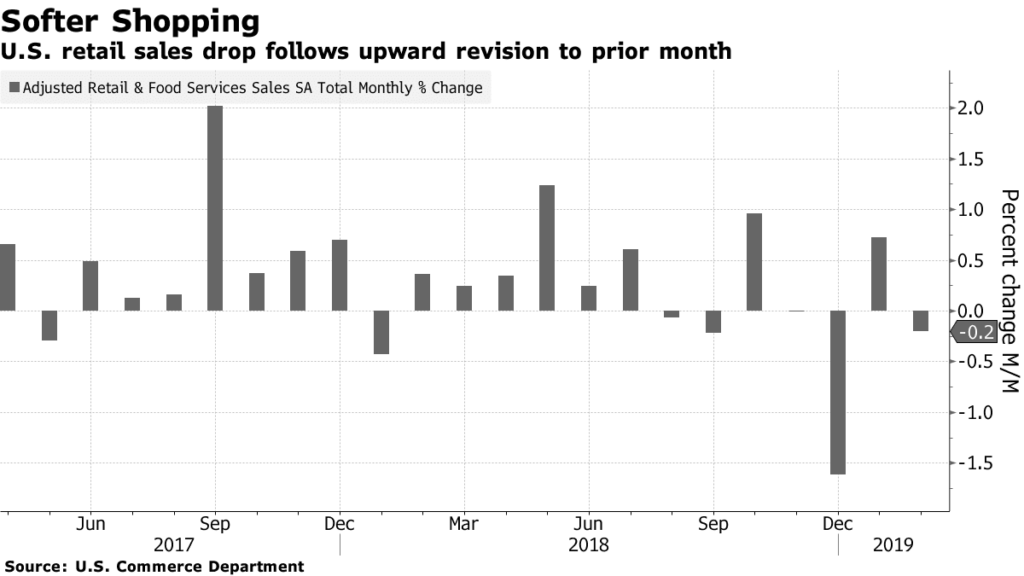
The government revised sales upward in the first month of the year to show a 0.7% increase instead of 0.2%. While most retail segments showed no or little growth, sales at gas stations rose 1% and auto dealers posted a 0.7% increase. Chief Economist Richard Moody of Regions Financial stated, “Our bottom line is that U.S. consumers remain on firm footing, though rising gasoline prices could curb growth in spending in other categories.”
The Institute for Supply Management (ISM) reported its index of manufacturing activity rebounded last month, after hitting a 2-year low in February. ISM’s manufacturing index rose to 55.3 from 54.2, exceeding analyst forecasts of 54.6. In the details, the sub-index for new orders jumped 1.9 points to 57.4, while the production sub-index rose 1 point to 55.8 and the employment sub-index surged 5.2 points to 57.5.
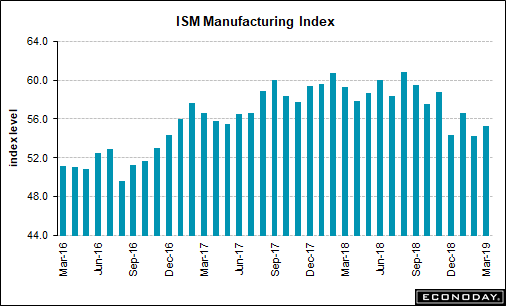
By industry, sixteen of the eighteen manufacturing industries surveyed by ISM expanded in March. The report provides evidence that, at least in manufacturing, the economy continues to grow. Richard Moody, Chief Economist at ISM summed up the report writing, “There is nothing in the details of the data or the comments to make you think the expansion is going to come to an end anytime soon.”
In the services sector, ISM reported growth at its slowest pace in over a year and a half, but firms remain “optimistic”. ISM’s non-manufacturing (services) index retreated 3.6 points to 56.1 last month, but that was down from one of the highest readings in decades.
Analysts consider readings over 50 as positive for the economy, and anything over 55 is exceptional. In the report, new orders and production retreated from very high levels, but still showed plenty of strength. Sixteen of the eighteen services industries tracked by ISM showed expansion, while only two—education and retail—contracted. Jim O’Sullivan, chief U.S. economist at High Frequency Economics observed, “The data are consistent with moderate rather than dramatic slowing in the economy.”
Current Indicators
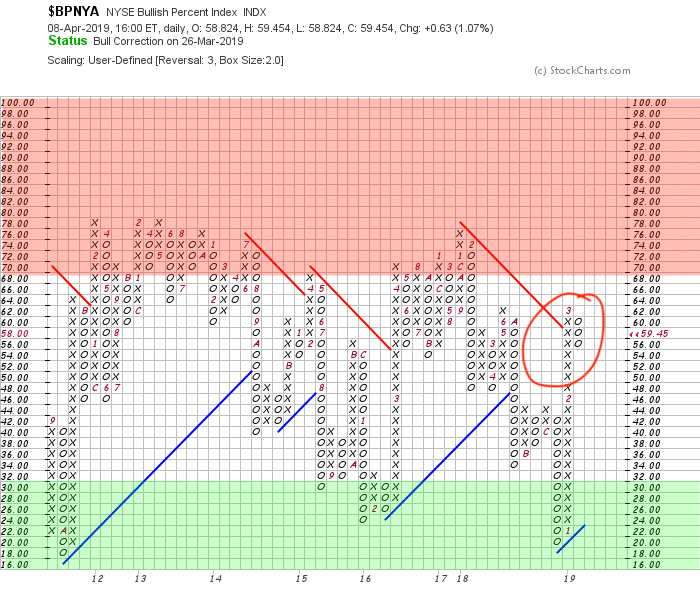
NYSE Bullish Percent Index:
The current status of the NYSE bullish percent index is telling us that the US equity market is still in a “distribution phase”. This indicates that investors are selling into the current strength of the market.
NASDAQ 100 Bullish Percent Index:
The NASDAQ 100 Bullish Percent Index has thrust higher into overbought territory (and high risk). Currently, the index is at a level where sellers start to step in.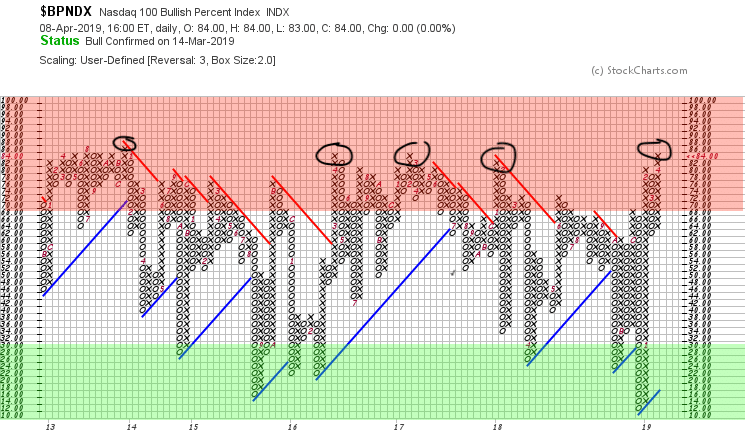
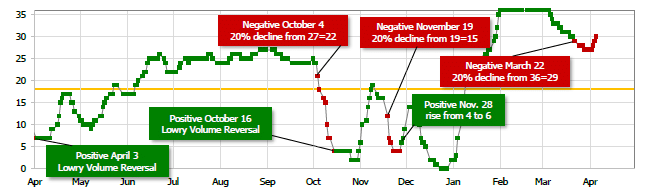
Short Term Trend:
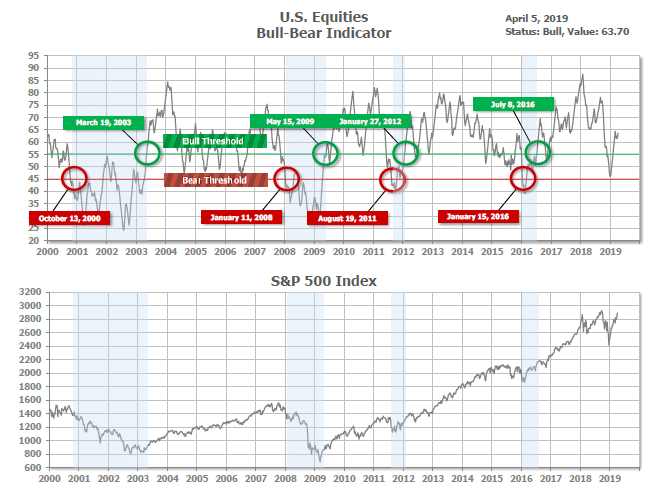
Bull/Bear Market Status:
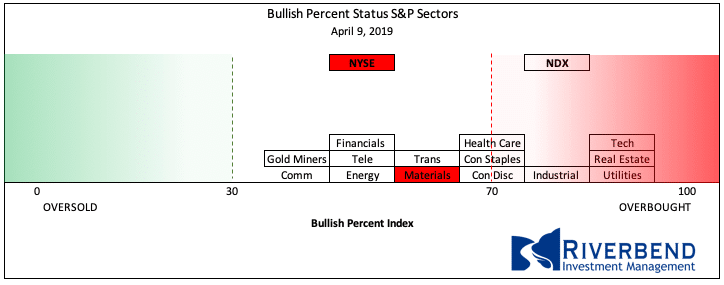
S&P Sector Bullish Percent Index:
The Bullish Percent Index is showing increased volatilty in most sectors. Technology, Real Estate, and Utilities are very overbought.
SHUT vs DIME
The ranking relationship between the defensive SHUT sectors is one way to gauge institutional investor sentiment in the market.
“S”=Staples [a.k.a. consumer non-cyclical]
“H”=Healthcare
“U”=Utilities and
“T”=Telecom
and the offensive DIME sectors:
“D”=Discretionary [a.k.a. Consumer Cyclical]
“I”=Industrial,
“M”=Materials
“E”=Energy
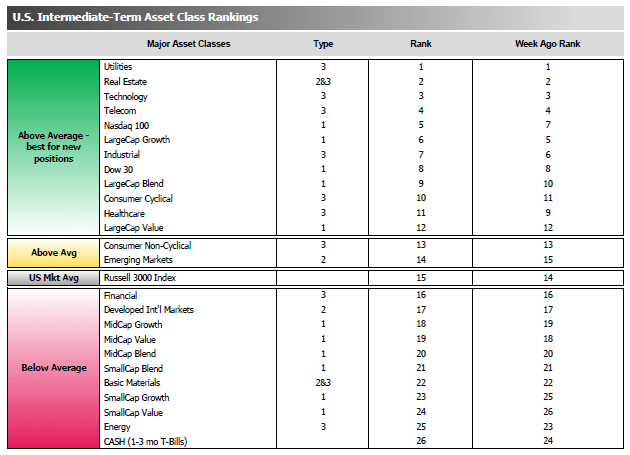
The average ranking of Defensive SHUT sectors declined to 7.25 from the prior week’s 6.75, and the average ranking of the Offensive DIME sectors also declined to 16.00 from the prior week’s 15.50. The Defensive SHUT sectors maintained a lead over Offensive DIME sectors.
Note: these are “ranks”, not “scores”, so smaller numbers are higher ranks and larger numbers are lower ranks.
Chart of Interest
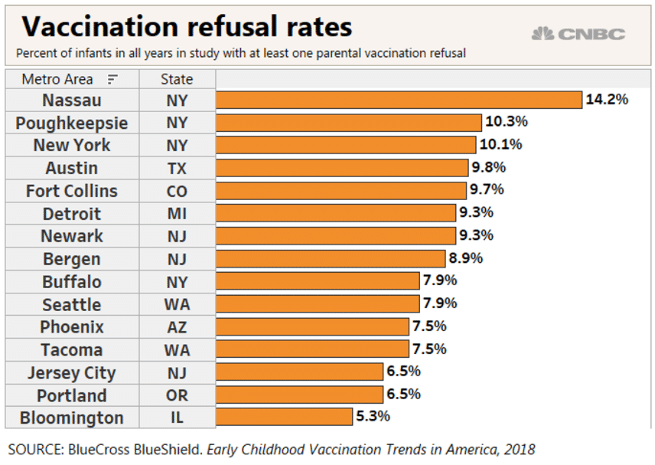
A common mainstream-media portrayal of “anti-vaxxers”, or parents who opt out of getting their children vaccinated, is that they are backward anti-government conspiracy theorists who reside predominantly in rural enclaves in “fly-over” areas of the country.
However, recent data from health insurance giant Blue Cross Blue Shield suggests otherwise. Their data, from a 2018 study, shows that the highest percent of parents who have refused to have their children vaccinated in the entire country were found in and around…New York City!
The Eastern Long Island communities comprising Nassau County, New York – home of some of the wealthiest and most sophisticated neighborhoods in the state and country – topped the list, and two other New York metro area entities, including New York City itself, round out the top three.
What’s Happening in Your Portfolio?
(as of 4/8/19)
We are still investing portfolios very conservatively. Our current objective is to protect the year to date gains in the portfolio as the market remains in high risk and overbought territory.
Yes, the market has risen during the past week. I like to use the analogy of a light bulb burning brightest before it burns out.
While markets can remain overbought for weeks, the current risk/reward ratio, in our opinion, isn’t worth putting capital at risk for a few extra percentage points.
If you have any questions, please reach out to me directly at john.rothe@riverbendinvestments.com
(sources: all index return data from Yahoo Finance; Reuters, Barron’s, Wall St Journal, Bloomberg.com, ft.com, guggenheimpartners.com, ritholtz.com, markit.com, financialpost.com, Eurostat, Statistics Canada, Yahoo! Finance, stocksandnews.com, marketwatch.com, wantchinatimes.com, BBC, 361capital.com, pensionpartners.com, cnbc.com, FactSet; Figs 1-5 source W E Sherman & Co, LLC)
© 2019 Riverbend Investment Management, LLC. This presentation is intended for informational purposes only.
The information and statistical data contained herein have been obtained from sources we believe to be reliable but in no way are warranted by us as to accuracy or completeness. The opinions expressed are those of Riverbend Investment Management, LLC. and are subject to change without notice. No part of this presentation may be reproduced in any manner without the written permission of Riverbend Investment Management, LLC. Any securities discussed should not be construed as a recommendation to buy or sell and there is no guarantee that these securities will be held for a client’s account nor should it be assumed that they were or will be profitable. Past performance does not guarantee future comparable results.
Riverbend Investment Management, LLC is a Registered Investment Adviser in Northern VA
ADV II available upon request
Riverbend Investment Management, LLC
1818 Library Street, Suite 500
Reston VA 20190
Tel:703-349-6327
www.riverbendinvestments.com


