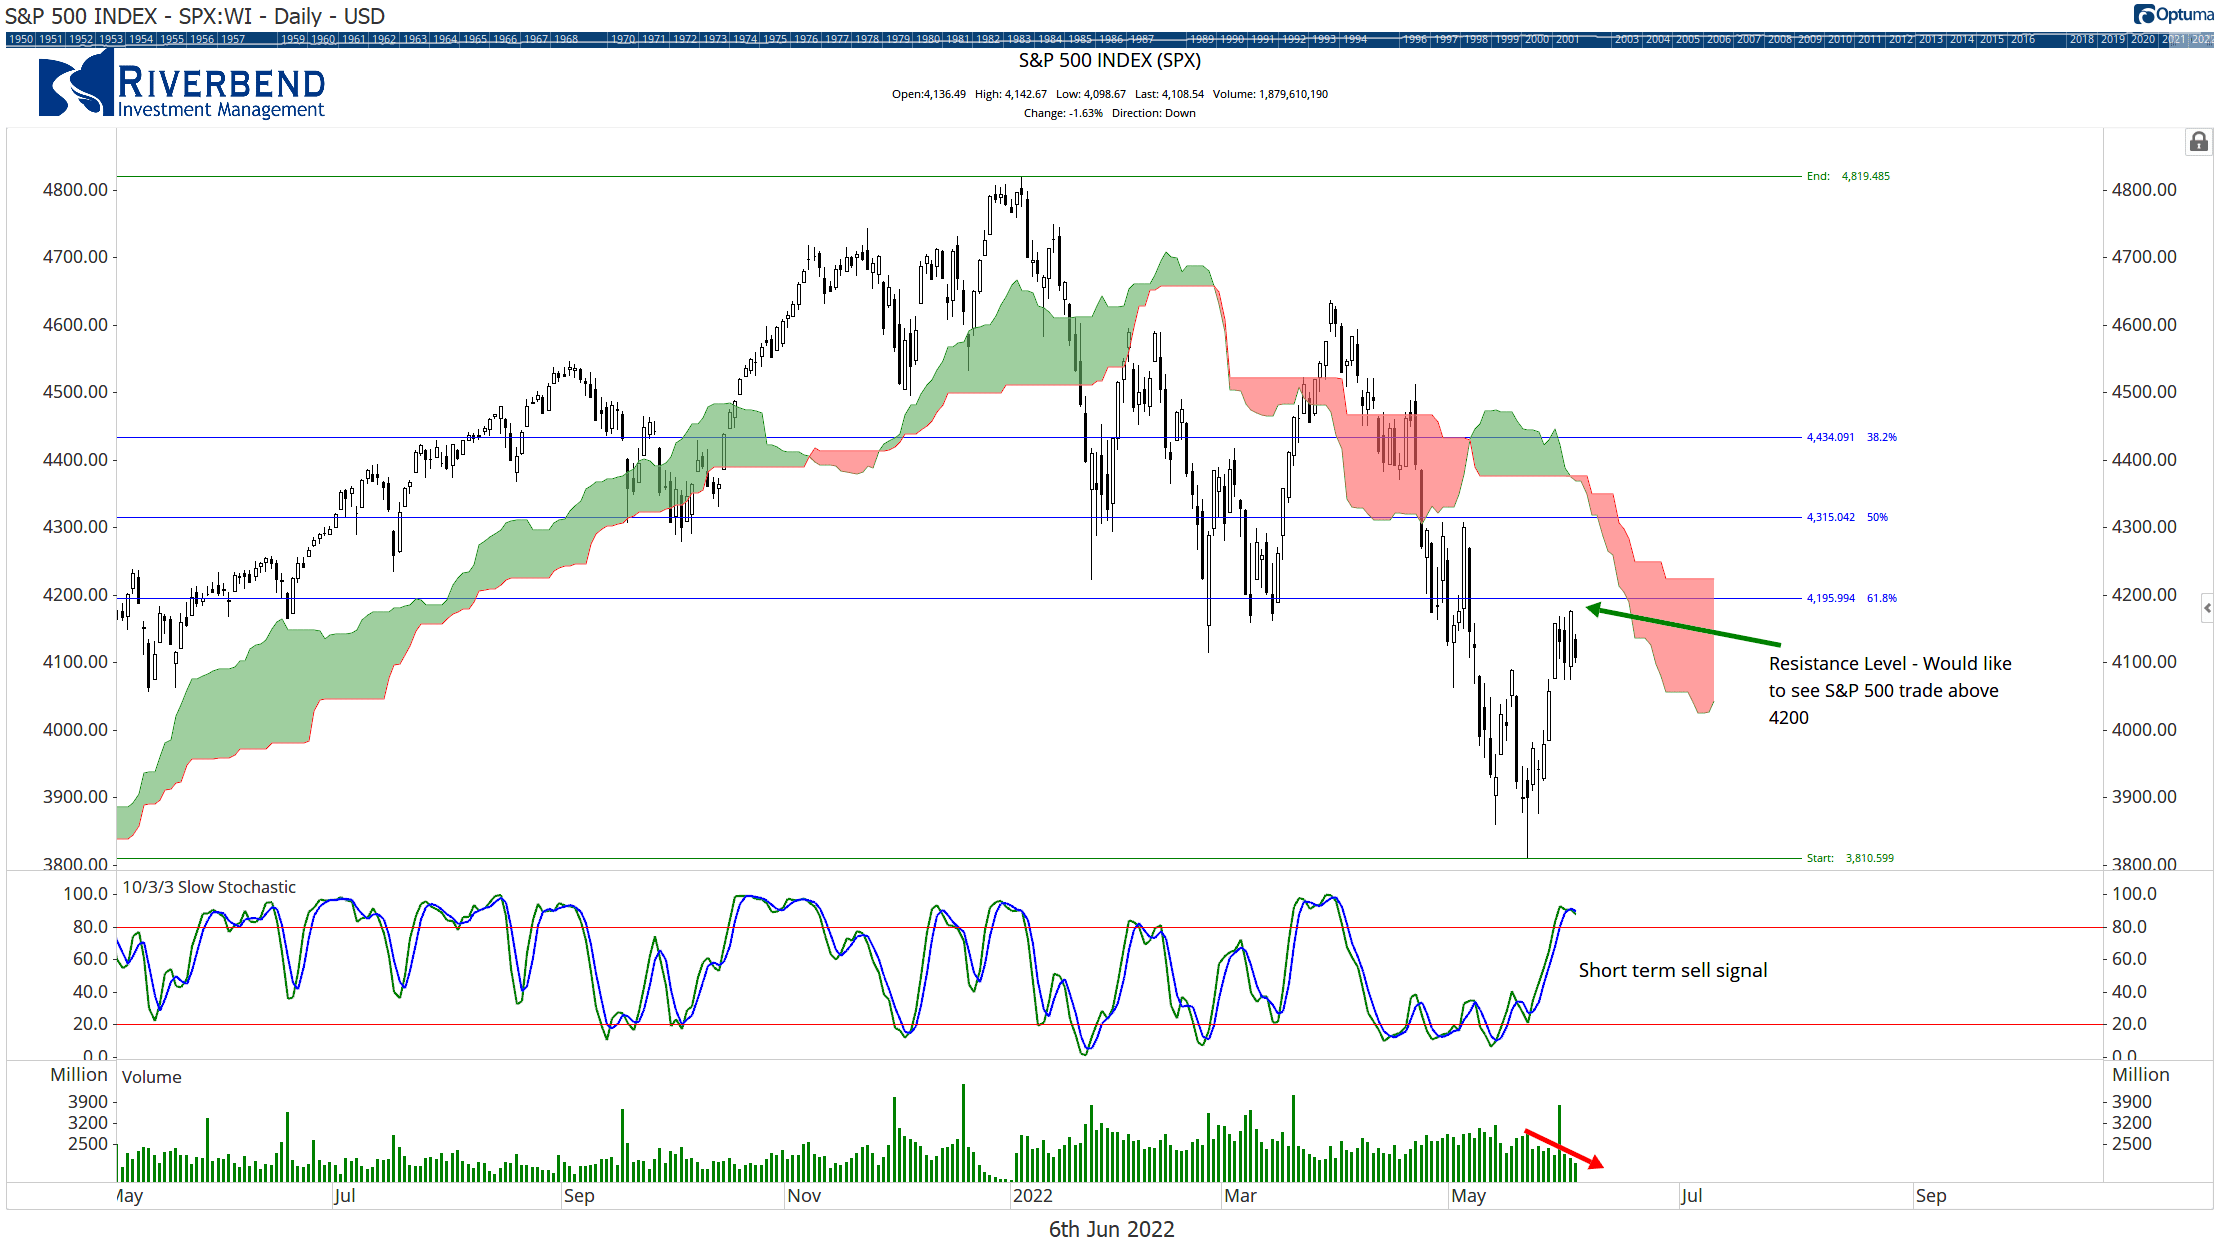
Last week I wrote about how the S&P 500 was in a countertrend reversal: lower trading volume as the market neared resistance levels.
Last week’s chart:
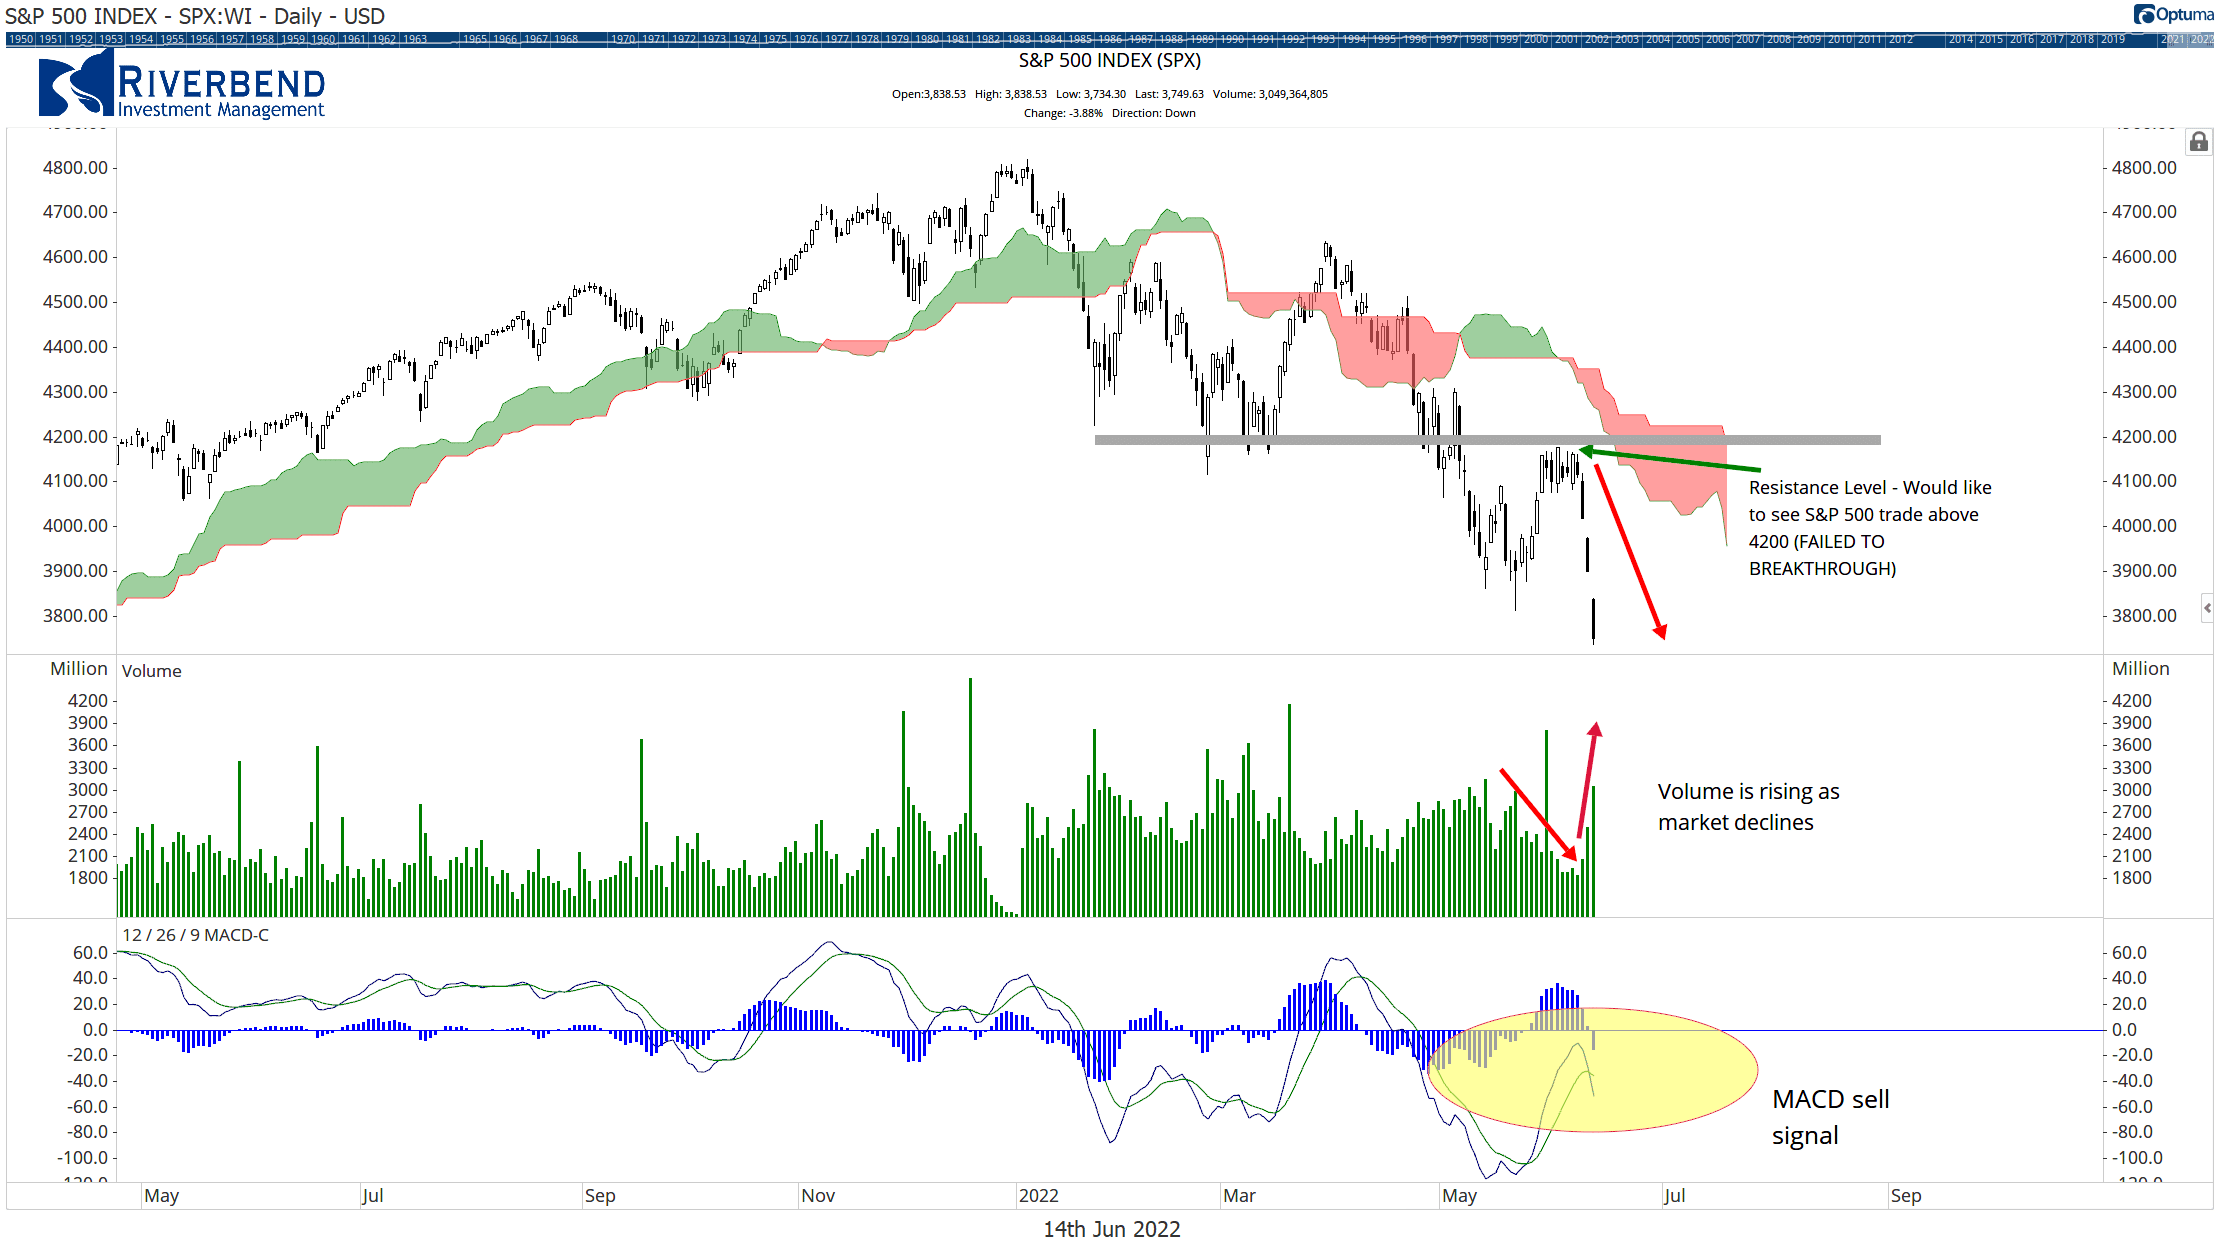
Fast forward to today and we are seeing the exact opposite. The market failed to break through resistance levels and now is trending lower again.
However, in textbook fashion, volume is rising again — confirming that the overall trend is still bearish.
Additionally, a new MACD sell signal (indicating momentum has turned negative again) was formed last week:
Traders had been hoping inflation data would begin to cool before this week’s FOMC meeting. However, last week’s inflation data came in hotter than expected.
This is causing investors to reevaluate their positions on how aggressive the Fed will be.
Bond traders pushed bond yields much higher causing widespread increases across the fixed income markets.
For example, 30-year mortgage rates jumped to over 6%.
Investors will be listening closely to the Fed this week!
For now, our strategies continue to remain in cash and/or hedged.
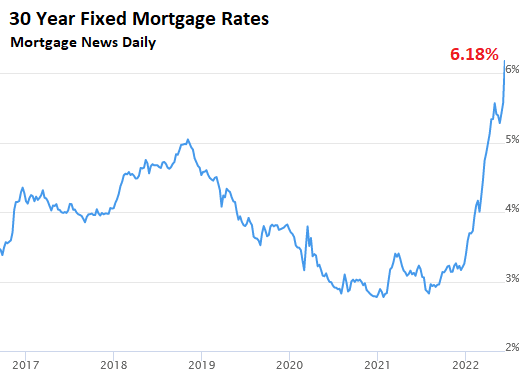
Chart of the Week:
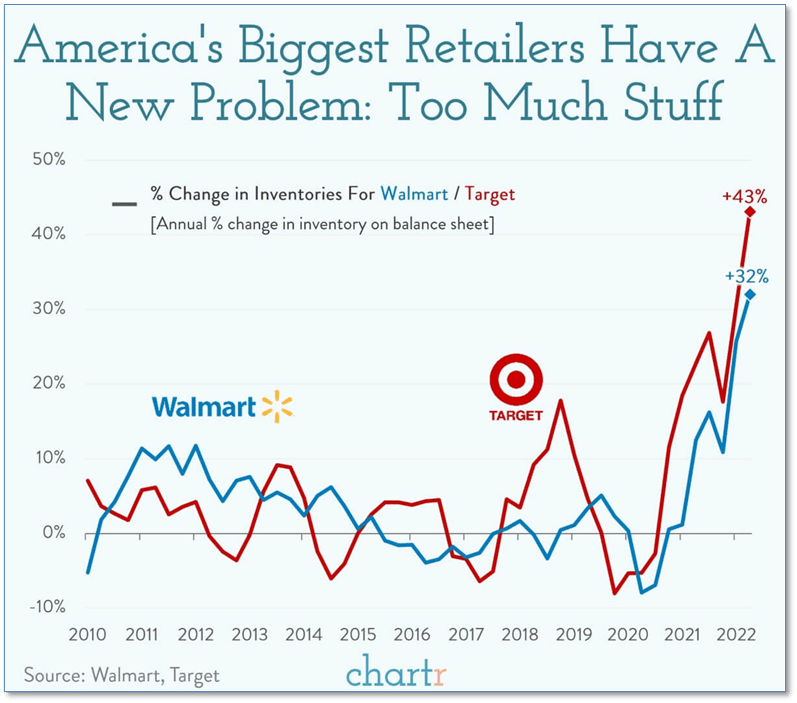
If you’re in the market for patio furniture, appliances, large electronics, or other expensive household items you might be in luck.
Big retail’s loss might become your gain. America’s biggest retailers, Walmart and Target, have a new problem to go along with supply chain issues and a tight labor market—too much inventory.
Target announced this week that it was holding a lot of inventory that has gone out of favor as consumers have switched their spending to travel, entertainment, and less expensive consumer items. And as taught in Econ 101, the only real way to move huge volumes of merchandise that is no longer in demand is to discount the heck out of it.
So if you’re in the market for any of these items, it’s likely your local Target or Walmart will have them on sale in the near future.
Unfortunately for shareholders, there’s been a big sale on Target and Walmart stock as well. Target is down 33% year-to-date, and Walmart has shed 15%.
Riverbend Indicators:
- As a reading of our Bull-Bear Indicator for U.S. Equities (comparative measurements over a rolling one-year timeframe), we remain in Cyclical Bull territory.
- Counting up the number of all our indicators that are ‘Up’ for U.S. Equities, the current tally is that zero of four are positive, representing a multitude of timeframes (two that can be solely days/weeks, or months+ at a time; another, a quarter at a time; and lastly, the {typically} years-long reading, that being the Cyclical Bull or Bear status).
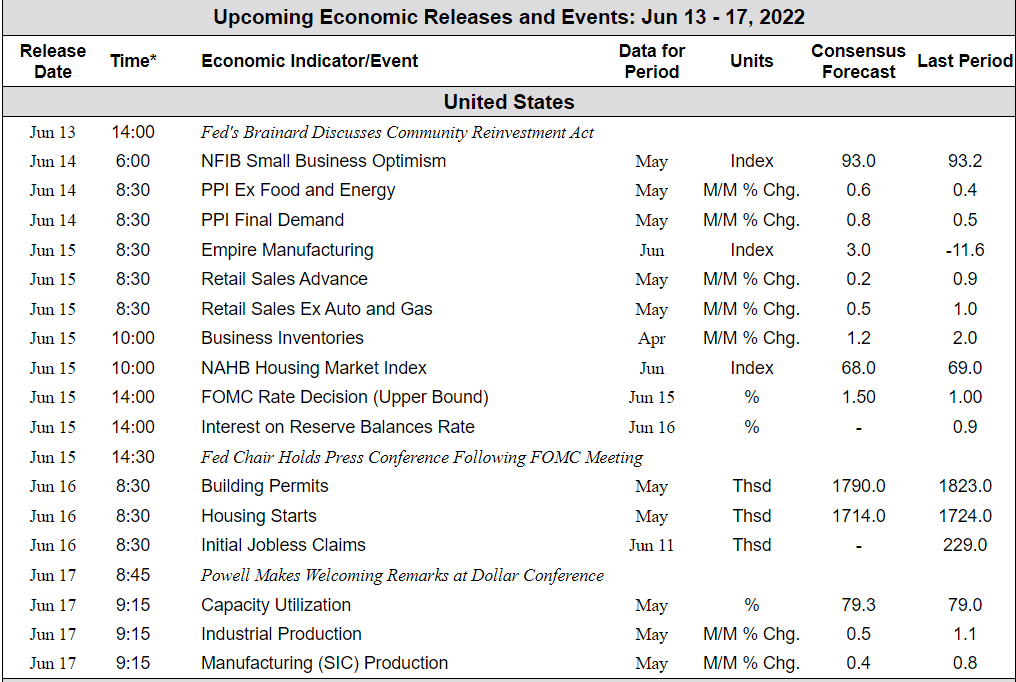
The Week Ahead: