[fusion_builder_container hundred_percent=”no” equal_height_columns=”no” menu_anchor=”” hide_on_mobile=”small-visibility,medium-visibility,large-visibility” class=”” id=”” background_color=”” background_image=”” background_position=”center center” background_repeat=”no-repeat” fade=”no” background_parallax=”none” parallax_speed=”0.3″ video_mp4=”” video_webm=”” video_ogv=”” video_url=”” video_aspect_ratio=”16:9″ video_loop=”yes” video_mute=”yes” overlay_color=”” video_preview_image=”” border_size=”” border_color=”” border_style=”solid” padding_top=”” padding_bottom=”” padding_left=”” padding_right=””][fusion_builder_row][fusion_builder_column type=”1_1″ layout=”1_1″ background_position=”left top” background_color=”” border_size=”” border_color=”” border_style=”solid” border_position=”all” spacing=”yes” background_image=”” background_repeat=”no-repeat” padding_top=”” padding_right=”” padding_bottom=”” padding_left=”” margin_top=”0px” margin_bottom=”0px” class=”” id=”” animation_type=”” animation_speed=”0.3″ animation_direction=”left” hide_on_mobile=”small-visibility,medium-visibility,large-visibility” center_content=”no” last=”no” min_height=”” hover_type=”none” link=””][fusion_text]
[/fusion_text][fusion_vimeo id=”579485214″ alignment=”center” width=”1000″ height=”” autoplay=”false” api_params=”” hide_on_mobile=”small-visibility,medium-visibility,large-visibility” class=”” css_id=”” /][fusion_text][fusion_text][fusion_text]
U.S. Markets: 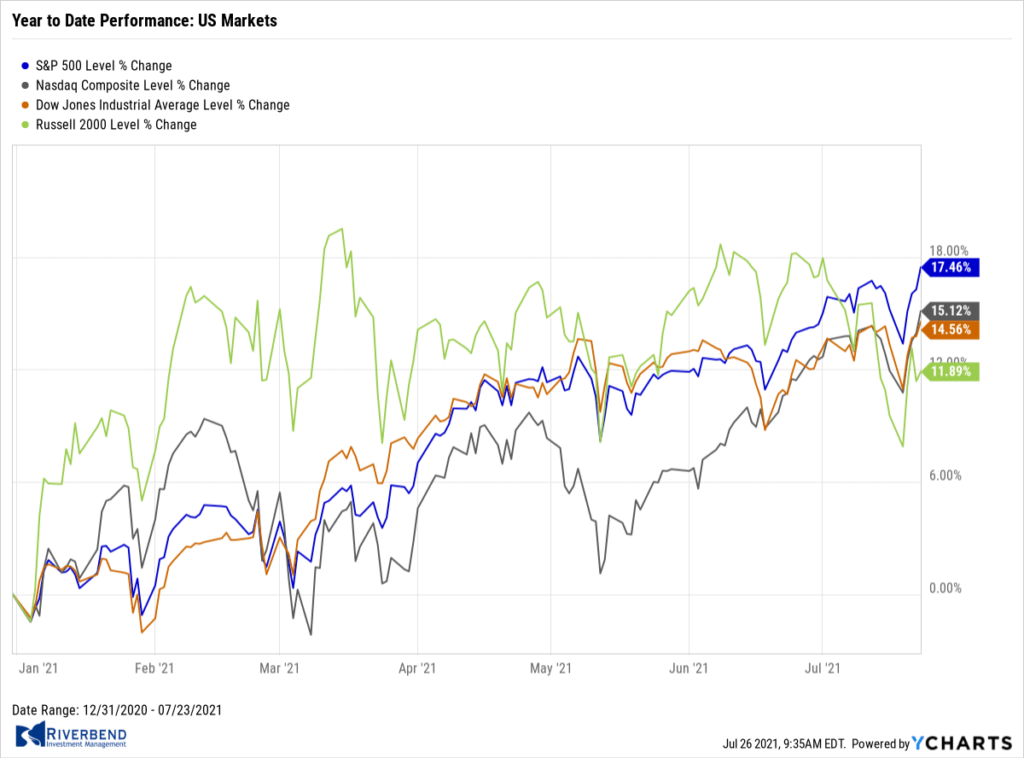
U.S. stocks ended the week higher, rebounding from a sharp sell-off on Monday. The advance was somewhat narrow, with much of the gains concentrated in technology and internet-related giants.
The Dow Jones Industrial Average finished the week up 374 points to 35,062—a gain of 1.1%. The technology-heavy NASDAQ Composite powered ahead 2.8% to 14,837.
By market cap, the large cap S&P 500 rose 2.0%, while the mid cap S&P 400 and small cap Russell 2000 each rose 2.1%.
International Markets: 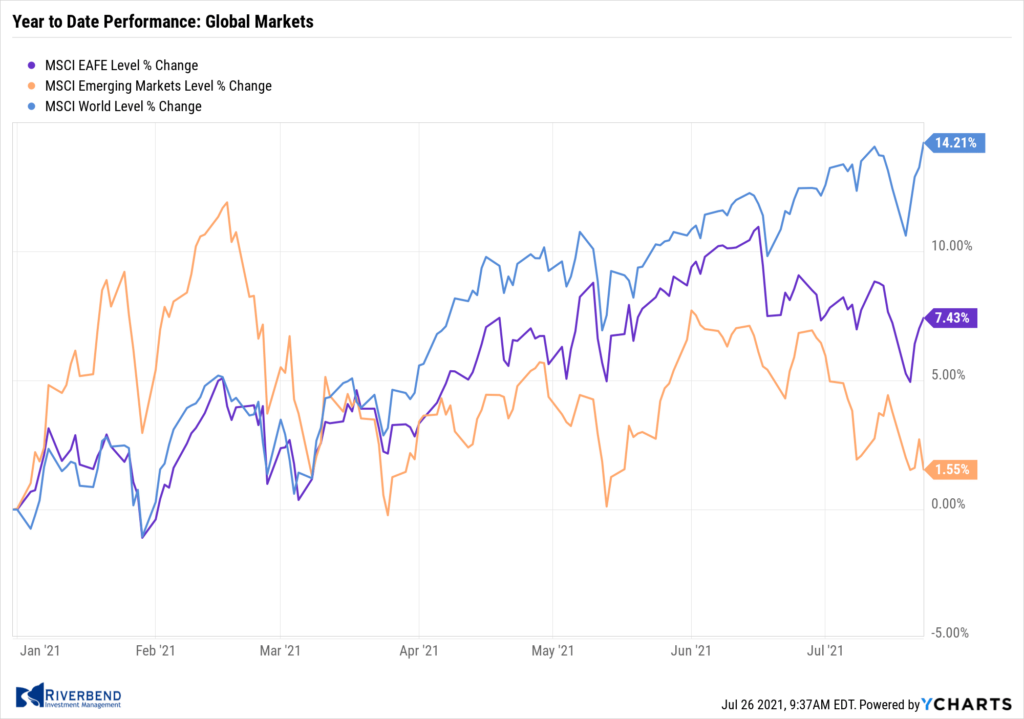
Canada’s TSX added 1%, while the UK’s FTSE 100 rose for the first time in four weeks adding 0.3%. On Europe’s mainland, France’s CAC 40 and Germany’s DAX gained 1.7% and 0.8%, respectively.
Major markets were mixed in Asia; China’s Shanghai Composite added 0.3% while Japan’s Nikkei declined -1.6%.
As grouped by Morgan Stanley Capital International, developed markets rose 1.1%, while emerging markets declined -2.0%.
Commodities: 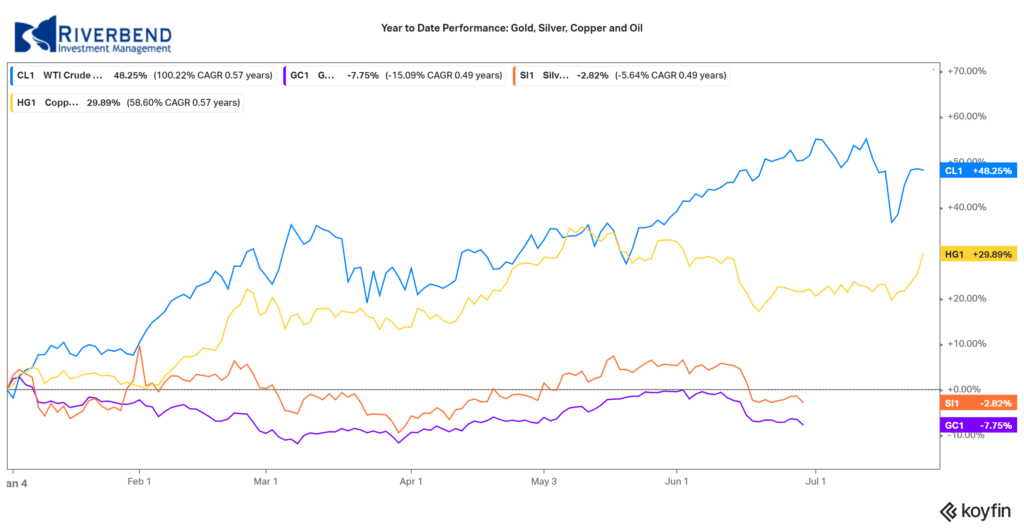
Commodities finished the week mixed. Gold retreated after three consecutive weeks of gains declining 0.7% to $1801.80 per ounce, while Silver gave up -2.2% to $25.23 per ounce.
Oil rebounded following an early week sell-off. West Texas Intermediate crude oil rose 0.7% to $72.07 per barrel.
The industrial metal copper, viewed by some analysts as a barometer of world economic health due to its wide variety of uses, finished the week up 1.8%.
U.S. Economic News: 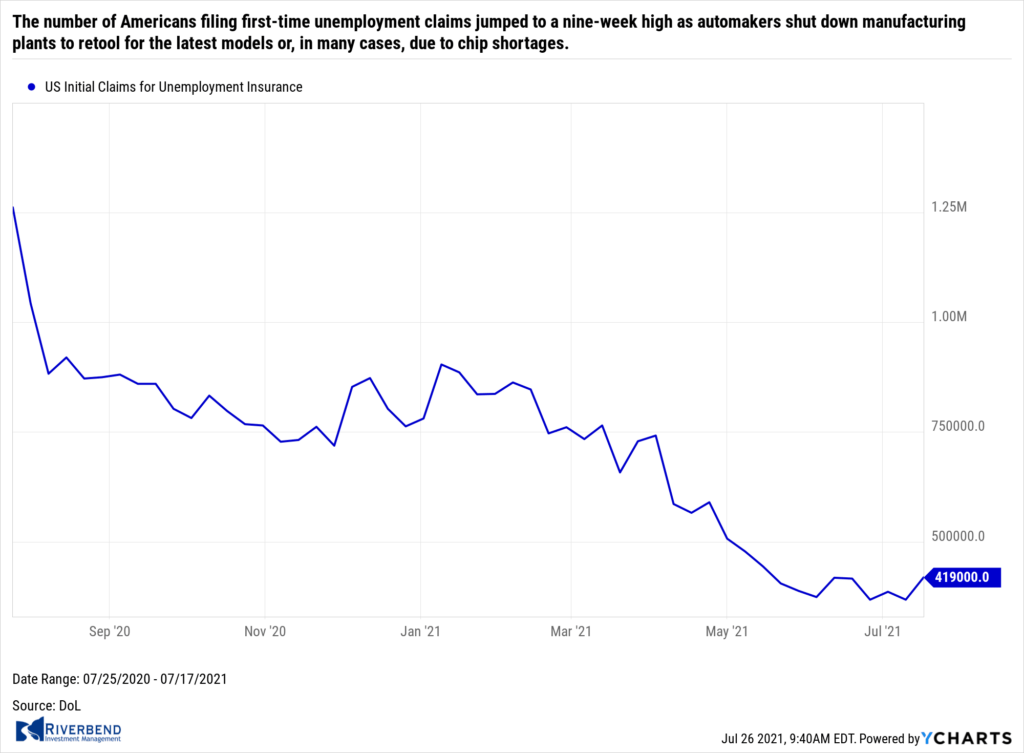
The number of Americans filing first-time unemployment claims jumped to a nine-week high as automakers shut down manufacturing plants to retool for the latest models or, in many cases, due to chip shortages. The Labor Department reported initial jobless claims surged by 51,000 to 419,000 last week. Economists had expected just 348,000 new claims. Analysts noted the increase was concentrated in the few states heavily engaged in automaking and probably doesn’t reflect a broader slowdown in the U.S. economy.
The biggest increase took place in Michigan, where autoworkers are eligible for benefits when manufacturing plants are briefly shut down each summer to retool for the latest models. Kentucky and Texas – both big auto-manufacturing states – also reported large increases in new claims. The number of people already collecting state jobless benefits, meanwhile, fell by 29,000 to a seasonally adjusted 3.24 million. These so-called “continuing claims” are consistently falling to new pandemic lows.
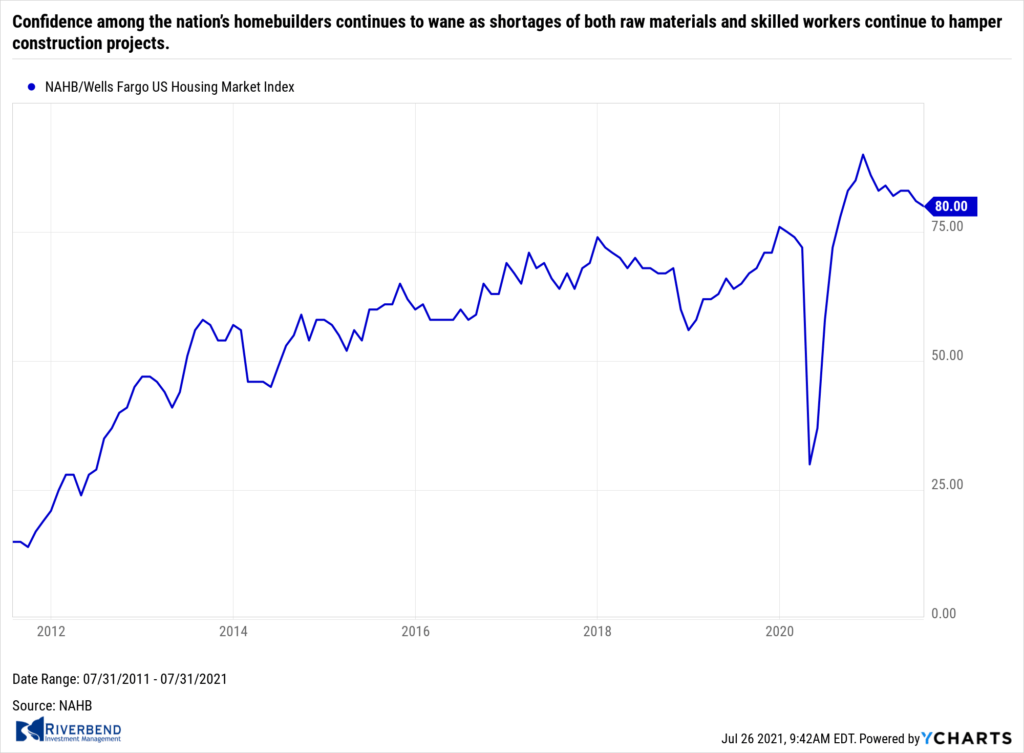 Confidence among the nation’s homebuilders continues to wane as shortages of both raw materials and skilled workers continue to hamper construction projects. The National Association of Home Builders (NAHB) reported its monthly confidence index declined 1 point to 80 in July. Economists had been expecting a reading of 81.
Robert Dietz, NAHB’s chief economist, said in the report “Builders are contending with shortages of building materials, buildable lots and skilled labor as well as a challenging regulatory environment.” “This is putting upward pressure on home prices and sidelining many prospective home buyers even as demand remains strong in a low-inventory environment,” he added. In the details of the report, the index that gauges the traffic of prospective buyers saw a pronounced decline, dropping six points to 65. Another index, which measures current sales conditions, fell one point to 86, while the index of sales expectations over the next six months actually increased two points to 81.
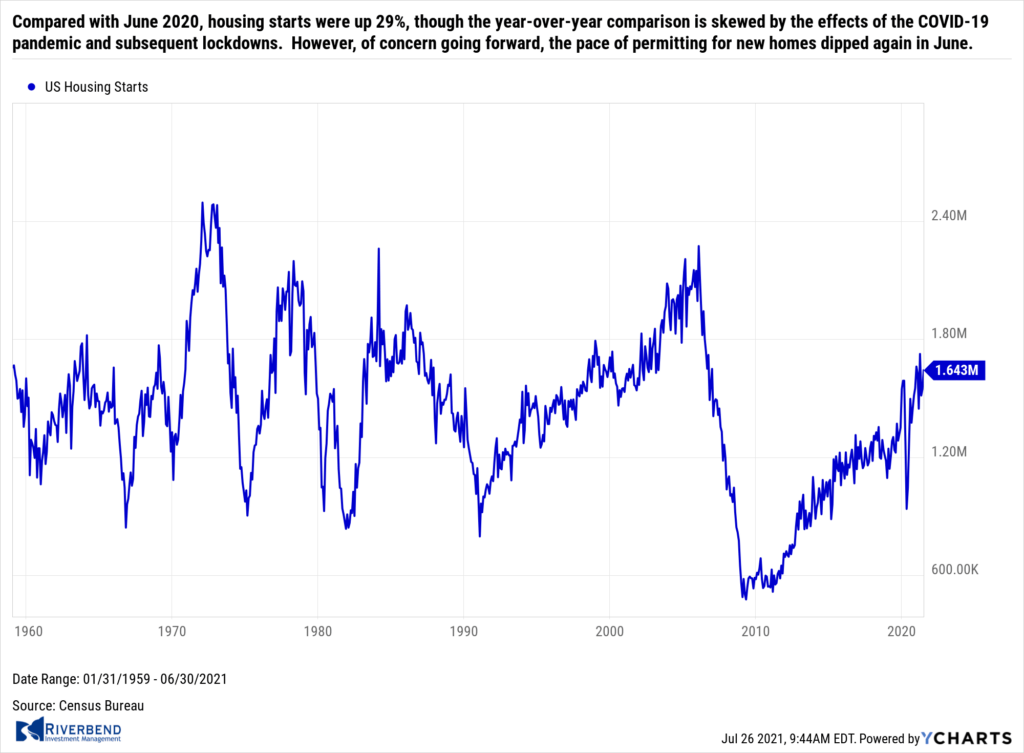 The U.S. Census Bureau reported its measure of home construction activity continued to improve last month, but homebuilders are facing a challenging market. U.S. home builders started construction on homes at a seasonally-adjusted annual rate of 1.64 million in June, representing a 6.3% increase from the previous month’s downwardly-revised figure, the U.S. Census Bureau reported.
Compared with June 2020, housing starts were up 29%, though the year-over-year comparison is skewed by the effects of the COVID-19 pandemic and subsequent lockdowns. However, of concern going forward, the pace of permitting for new homes dipped again in June. Permitting for new homes occurred at a seasonally-adjusted annual rate of nearly 1.6 million, down 5% from May. By region, the Northeast and Midwest both saw declines in housing starts, while the West and South saw gains. The West in particular saw housing starts surge to the highest level since February, with a 13% monthly increase.
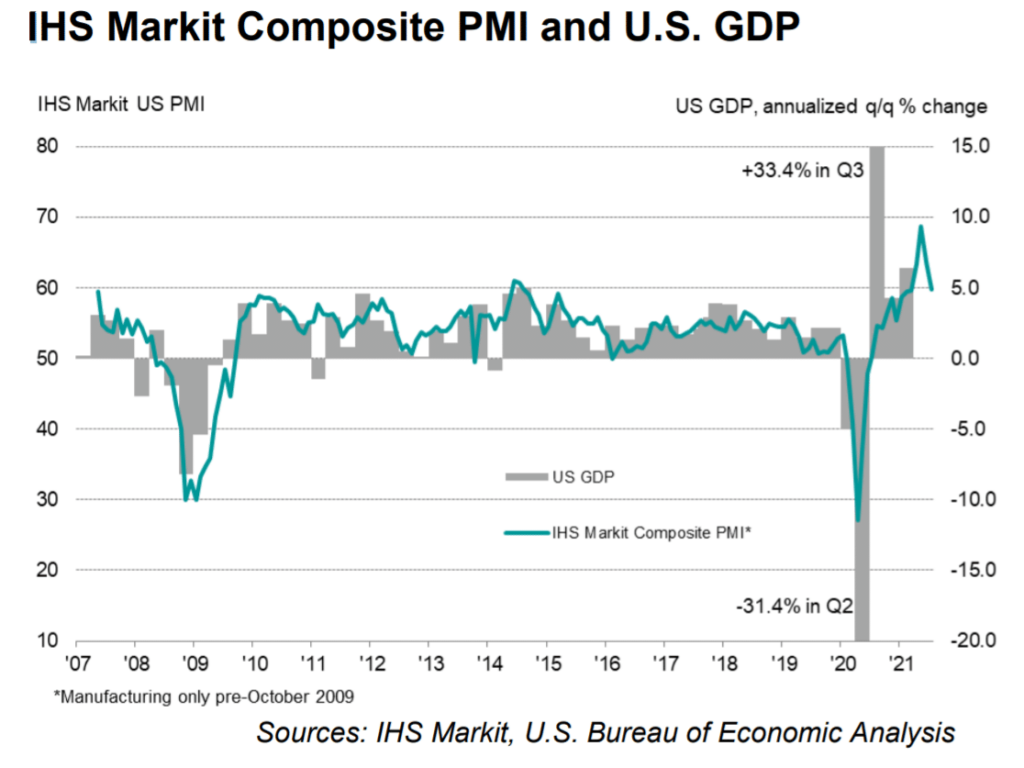 After surging higher in the second quarter the U.S. economy cooled a bit, according to data from analytics firm IHS Markit. Markit reported its preliminary composite output index for the U.S. fell to a four-month low of 59.7 in July. That’s down four points from June’s reading. Chris Williamson, chief business economist at IHS Markit stated, “The provisional PMI data for July point to the pace of economic growth slowing for a second successive month, though importantly this cooling has followed an unprecedented growth spurt in May.”
IHS Markit said its flash survey of U.S. manufacturers rose slightly to 63.1 in July from 62.1 in the prior month. A similar survey of service-oriented companies — banks, restaurants, retailers and the like — dipped to a five-month low of 59.8 from 64.6 in June. The report noted inflation and short-term capacity issues remain major sources of uncertainty among businesses. Of concern, business optimism about the year ahead fell to the lowest level seen so far this year.
Chart of the Week: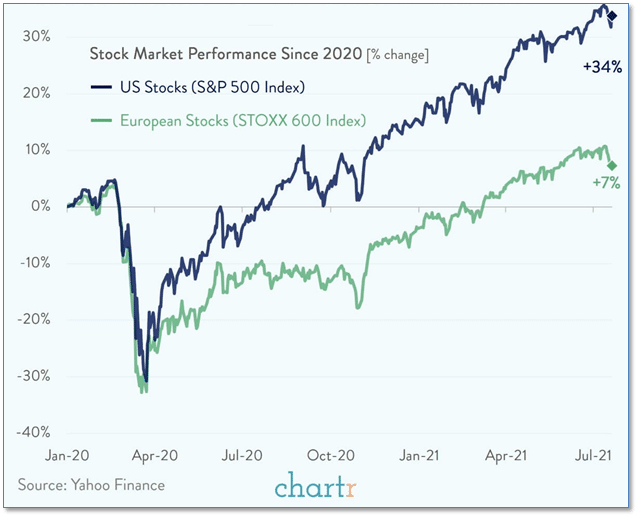
If you went back in time to the start of 2020 and predicted the stock market would be up almost 35% over the year-and-a-half, most people would have probably believed you. After all, other than a few minor bumps the market had been on a solidly upward trajectory over the last few years. But then a global pandemic, a recession, and an explosion in unemployment claims rocked markets around the world.
Since 2011, U.S. markets have sharply outperformed international markets. Would that continue when the market picked itself up and began advancing again? Many forecasters predicted that, at long last, international markets – in particular, European markets – would lead the global recovery in stock markets and finally outperform the U.S. Except it didn’t happen.
Once again, U.S. markets took the lead and never looked back, with a 34% advance in the S&P 500 since 1/1/2020, almost 5 times better than the 7% gain in the STOXX 600 European Stock Index.
Riverbend Indicators:

Each week we post notable changes to the various market indicators we follow.
- As a reading of our Bull-Bear Indicator for U.S. Equities (comparative measurements over a rolling one-year timeframe), we remain in Cyclical Bull territory.
- Counting up of the number of all our indicators that are ‘Up’ for U.S. Equities, the current tally is that three of four are Positive, representing a multitude of timeframes (two that can be solely days/weeks, or months+ at a time; another, a quarter at a time; and lastly, the {typically} years-long reading, that being the Cyclical Bull or Bear status).
The Week Ahead:
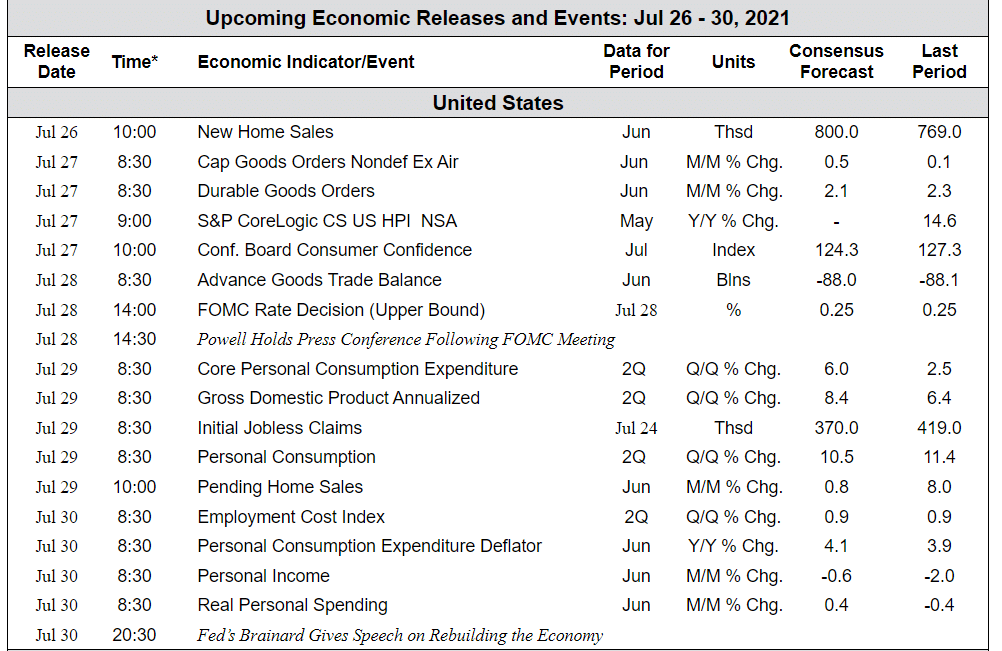
Source: Bloomberg, TD Economics
(Sources: All index- and returns-data from Yahoo Finance; news from Reuters, Barron’s, Wall St. Journal, Bloomberg.com, ft.com, guggenheimpartners.com, zerohedge.com, ritholtz.com, markit.com, financialpost.com, Eurostat, Statistics Canada, Yahoo! Finance, stocksandnews.com, marketwatch.com, wantchinatimes.com, BBC, 361capital.com, pensionpartners.com, cnbc.com, FactSet.)
[/fusion_text][/fusion_builder_column][/fusion_builder_row][/fusion_builder_container]


