[fusion_builder_container hundred_percent=”no” equal_height_columns=”no” menu_anchor=”” hide_on_mobile=”small-visibility,medium-visibility,large-visibility” class=”” id=”” background_color=”” background_image=”” background_position=”center center” background_repeat=”no-repeat” fade=”no” background_parallax=”none” parallax_speed=”0.3″ video_mp4=”” video_webm=”” video_ogv=”” video_url=”” video_aspect_ratio=”16:9″ video_loop=”yes” video_mute=”yes” overlay_color=”” video_preview_image=”” border_size=”” border_color=”” border_style=”solid” padding_top=”” padding_bottom=”” padding_left=”” padding_right=””][fusion_builder_row][fusion_builder_column type=”1_1″ layout=”1_1″ background_position=”left top” background_color=”” border_size=”” border_color=”” border_style=”solid” border_position=”all” spacing=”yes” background_image=”” background_repeat=”no-repeat” padding_top=”” padding_right=”” padding_bottom=”” padding_left=”” margin_top=”0px” margin_bottom=”0px” class=”” id=”” animation_type=”” animation_speed=”0.3″ animation_direction=”left” hide_on_mobile=”small-visibility,medium-visibility,large-visibility” center_content=”no” last=”no” min_height=”” hover_type=”none” link=””][fusion_text]
[/fusion_text][fusion_vimeo id=”562889894″ alignment=”center” width=”1000″ height=”” autoplay=”false” api_params=”” hide_on_mobile=”small-visibility,medium-visibility,large-visibility” class=”” css_id=”” /][fusion_text][fusion_text][fusion_text]
U.S. Markets: 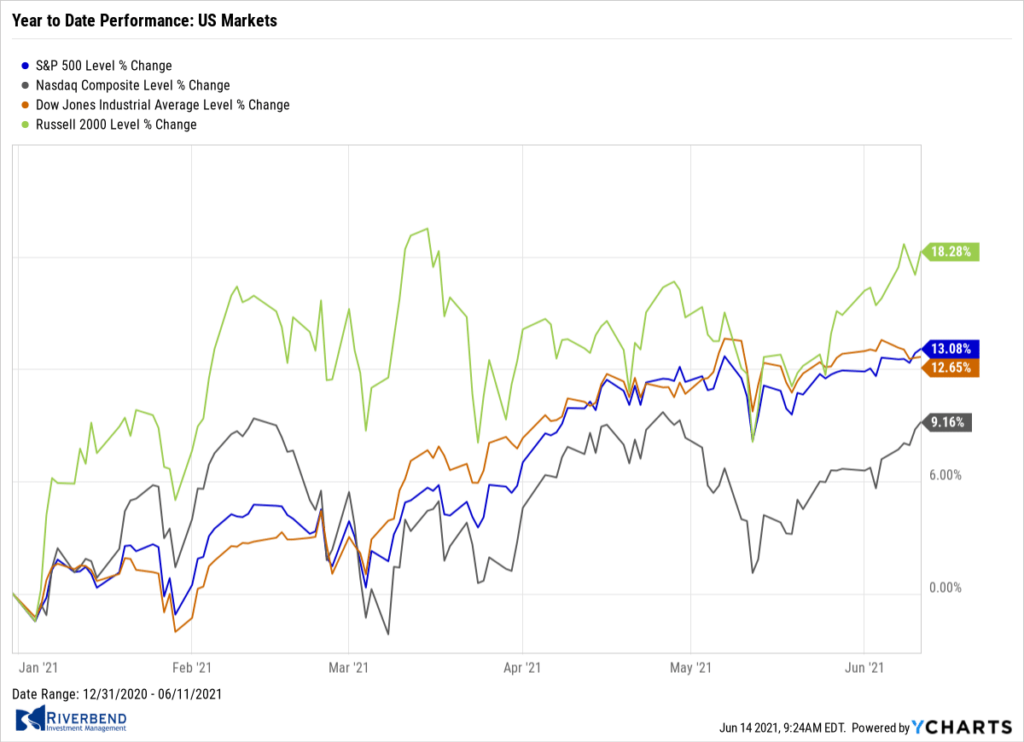
A sharp decrease in longer-term bond yields appeared to help push the S&P 500 Index to a record high in a week of relatively light summer trading.
The technology-heavy NASDAQ Composite Index outperformed, rising 1.8% to 14,069, marking its fourth consecutive weekly gain, while the narrowly focused Dow Jones Industrial Average recorded a modest loss of -0.8% closing at 34,480.
By market cap, the large cap S&P 500 rose 0.4%, while the mid-cap S&P 400 and small-cap Russell 2000 finished the week up 0.9% and up 2.2%, respectively.
International Markets: 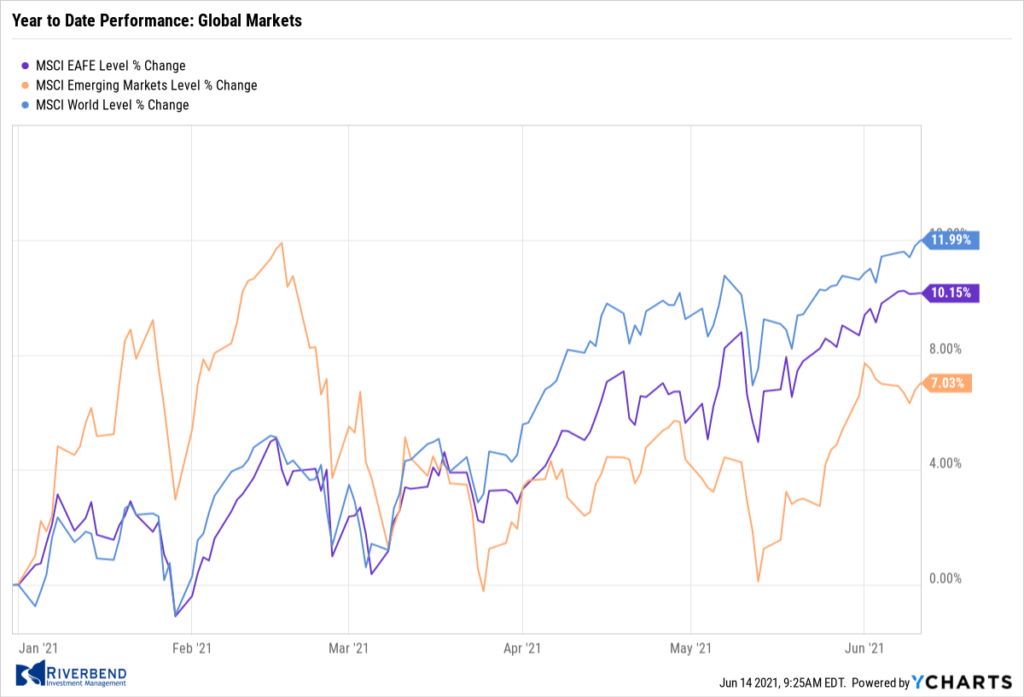
Canada’s TSX rose 0.5%, while the United Kingdom’s FTSE added 0.9%. On Europe’s mainland, Frances CAC 40 rallied 1.3%, while Germany’s DAX finished the week unchanged.
In Asia, China’s Shanghai Composite ticked down -0.1% and Japan’s Nikkei rose just 7 points to 28,949—a negligible percentage gain.
As grouped by Morgan Stanley Capital International (MSCI), emerging markets retreated -0.8%, while developed markets added 0.5%.
Commodities: 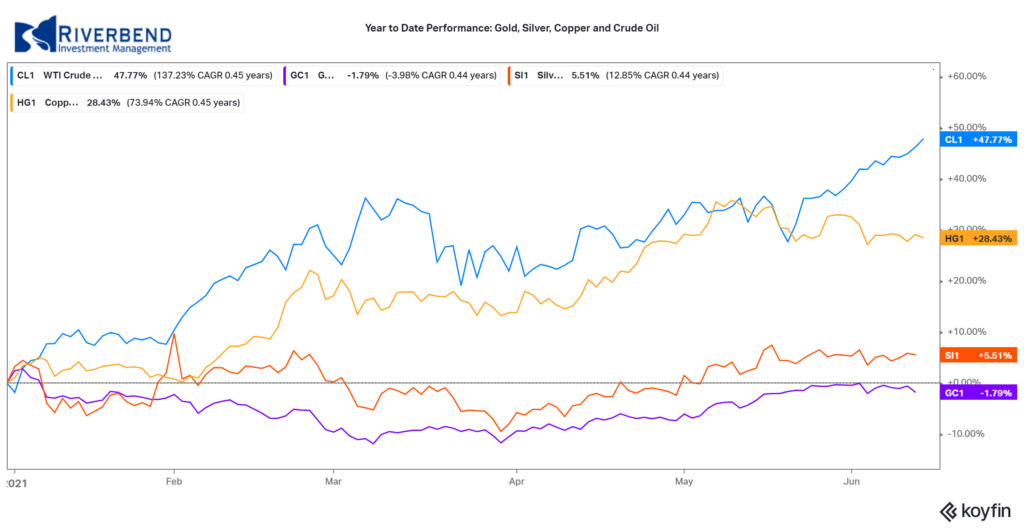
Precious metals finished the week mixed. Gold retreated -0.7% to $1879.60 per ounce, while Silver rose 0.9% to $28.15 per ounce.
Crude oil continued to break out to the upside rising for a third consecutive week. West Texas Intermediate crude oil finished the week up 1.9% to $70.91 per barrel.
The industrial metal copper, viewed by some analysts as a barometer for global economic health due to its wide variety of uses, retraced some of last week’s decline finishing the week up 0.2%.
U.S. Economic News: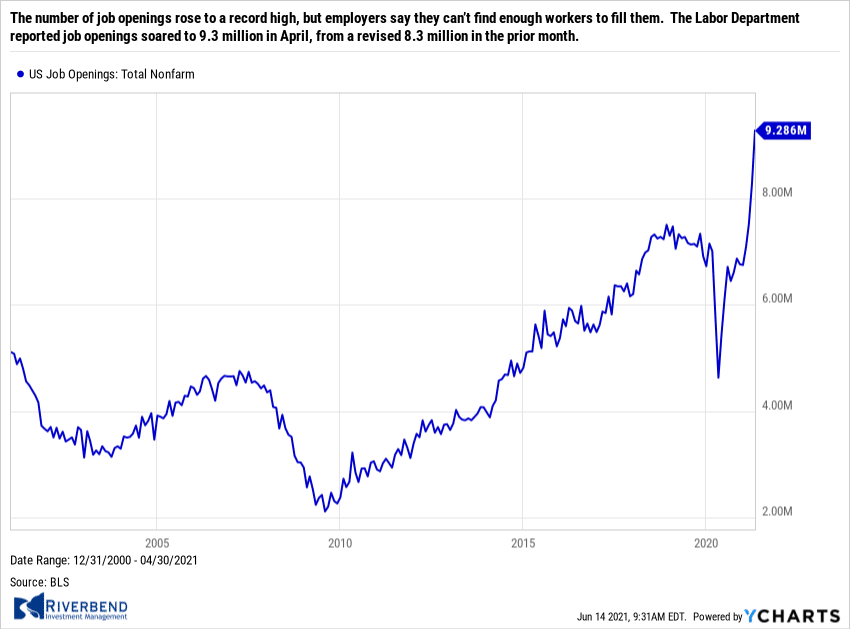
The number of job openings rose to a record high, but employers say they can’t find enough workers to fill them. The Labor Department reported job openings soared to 9.3 million in April, from a revised 8.3 million in the prior month. Many companies, both big and small, have reported difficulty finding qualified workers. The surprising difficulty in getting people to return to work is tied to a number of problems, economists say. They blame a wave of early retirements, a lack of child-care options, a lingering fear of the coronavirus and generous unemployment benefits.
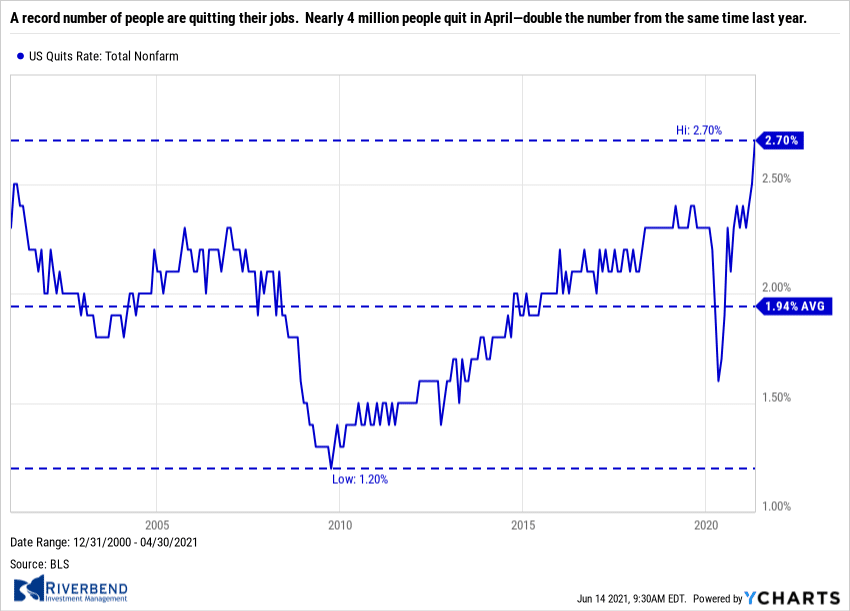
To add fuel to the fire, a record number of people are quitting their jobs. Nearly 4 million people quit in April—double the number from the same time last year. The so-called “quits rate” rose a tick to a record 2.8% among private-sector employees. The quits rate is rumored to be the Federal Reserve’s preferred gauge of the health of the labor market as it is assumed that an employee would only quit a job in favor of a more lucrative one. At the height of the coronavirus crisis, the quits rate had fallen to a seven-year low of 1.8%.
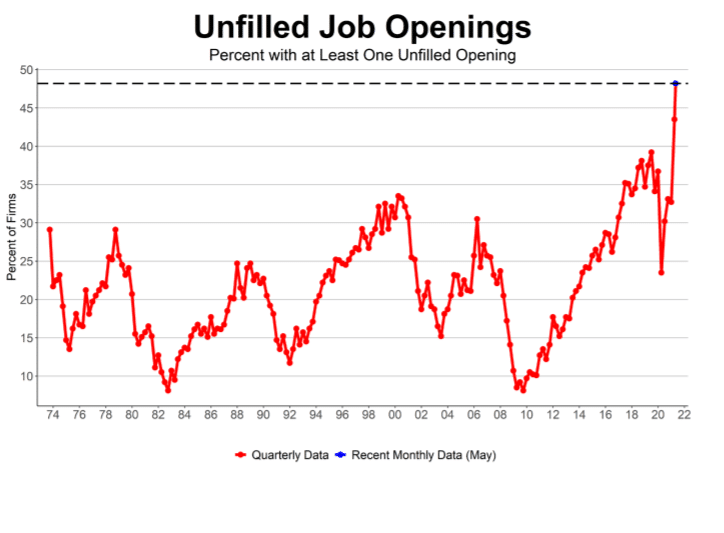
Source: NFIB
Small business owners reported the labor shortage across the nation is holding back growth. The National Federation of Independent Business (NFIB) stated its small-business index fell for the first time this year over growing labor and inflation worries. The index slipped 0.2 points to 99.6. Business owners say they are losing sales because they can’t find enough people to fill open positions. And now, rising inflation is adding to their worries.
Source: NFIB
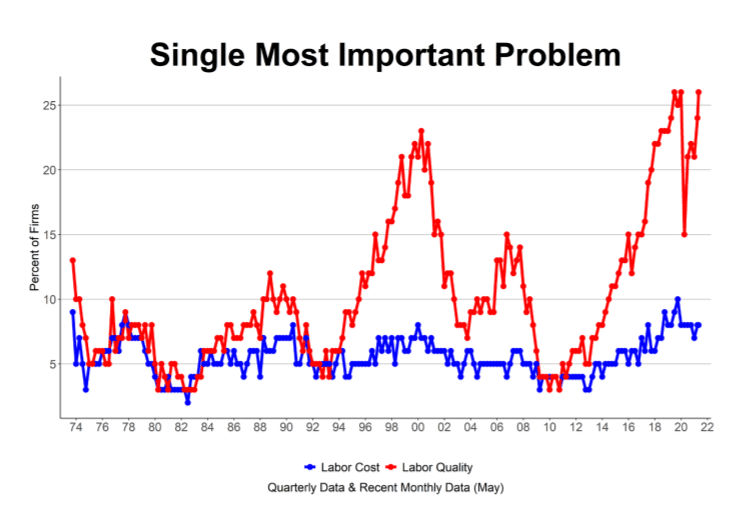
In the details of the report, NFIB – the nation’s largest small-business lobbying group – said a record 48% of small businesses surveyed could not fill open jobs, even with many of them offering higher pay. “The labor shortage is holding back growth for small businesses across the country,” said NFIB chief economist Bill Dunkelberg. The businesses that have raised wages in an effort to lure more workers say they plan to pass higher labor costs on to customers, potentially adding upward pressure to U.S. consumer prices. The percentage of businesses raising prices rose to the highest level since 1981.
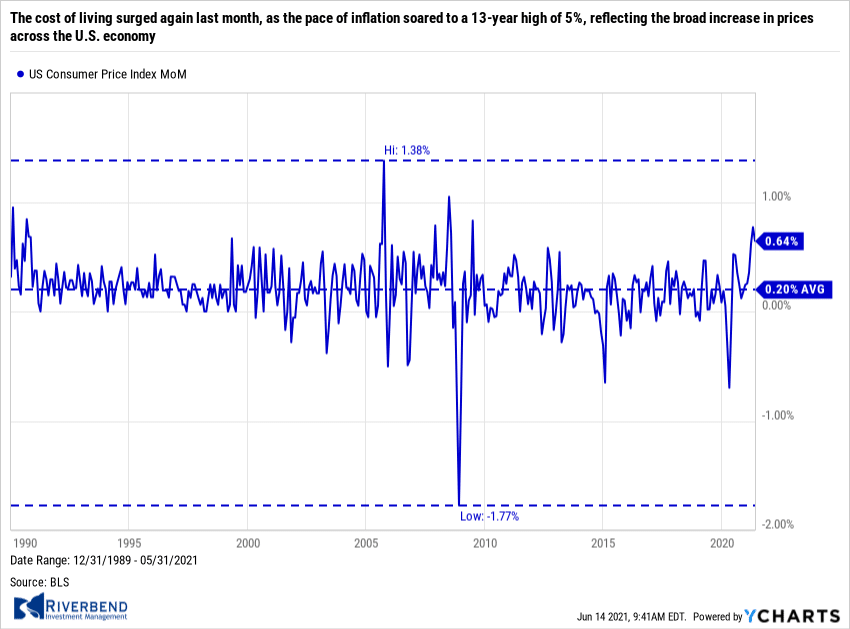 The cost of living surged again last month, as the pace of inflation soared to a 13-year high of 5%, reflecting the broad increase in prices across the U.S. economy. The consumer price index jumped 0.6% last month to mark the fourth large gain in a row, the government reported. Economists had expected a gain of 0.5%. The rate of inflation over the past year escalated to 5% from 4.2% in the prior month. That put it at the highest level since 2008, a time when the cost of oil hit a record $150 a barrel.
Prior to that, the last time inflation was this high was in 1991. Another closely watched measure of inflation that omits volatile food and energy also shot up 0.7% in May. The so-called “core” 12-month rate of inflation climbed to 3.8% from 3%, a 29-year high. The Federal Reserve insists price pressures will subside once the U.S. and global economies regain a more normal footing. The upsurge in inflation is mostly tied to temporary shortages that will fade away as supply catches up to demand, senior Fed officials say.
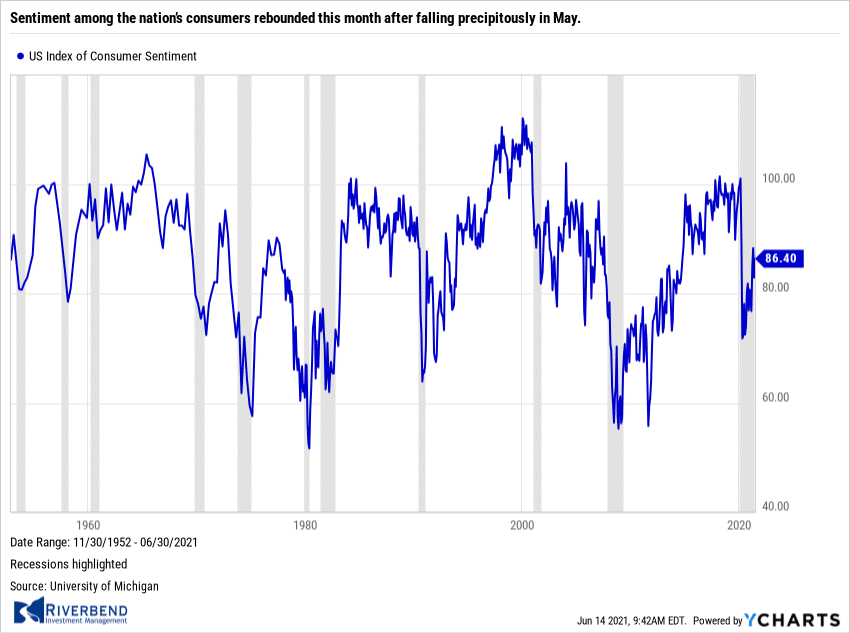 Sentiment among the nation’s consumers rebounded this month after falling precipitously in May. The University of Michigan reported its (preliminary) index of consumer sentiment rose 3.5 points to 86.4 this month. Economists had forecast a reading of 84.4. In the report, the sub-index that measures how consumers feel about the economy right now rebounded to 90.6 in June from 89.4 last month, due to rapid job gains in recent months.
Consumer optimism about the next six months rose to 90.6 in May to 89.4 in the prior month. In a note to clients, Robert Frick, corporate economist with Navy Federal Credit Union wrote, “June’s Consumer Sentiment Survey was mixed, just like how the recovery is playing out. While consumers are rightly frustrated with the current high price of houses, cars and durable goods, they recognize that job growth has finally started moving decisively in the right direction.”
Chart of the Week:
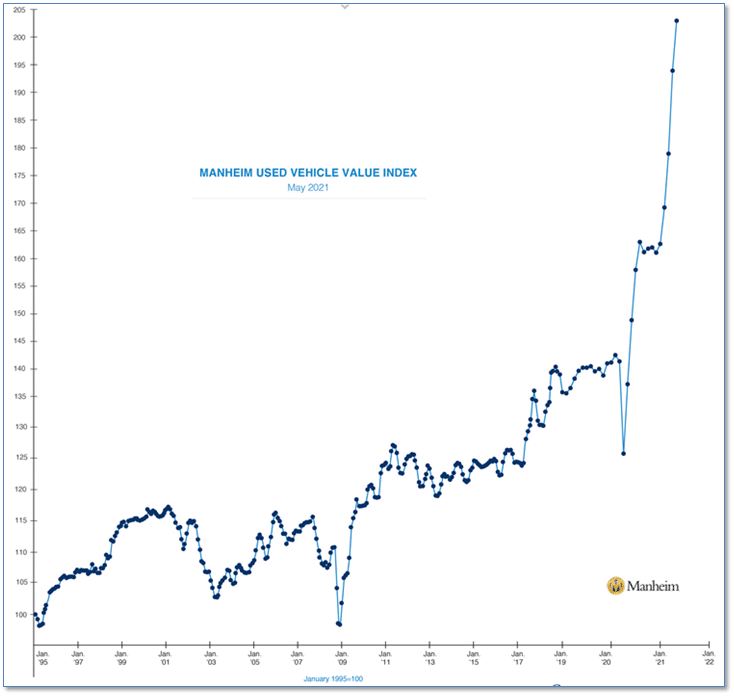
Record prices for used cars and trucks were the biggest contributor to inflation last month, according to the government’s Consumer Price Index report. Prices for used vehicles surged 7.3% just last month, following an even bigger 10% gain in April.
Why are the prices of used vehicles skyrocketing?
In short, there are more people buying cars than there are cars in the market. New car trade-ins are usually the biggest source of used cars, but supply chain disruptions, especially a widespread of specialty semiconductors used by auto manufacturers, have limited availability of new vehicles—causing prices of scarce, used vehicles to catapult higher.
The Manheim Vehicle Value Index, a widely-followed industry yardstick shown in the chart, was described by industry observers as “shocking”.
Riverbend Indicators:

Each week we post notable changes to the various market indicators we follow.
- As a reading of our Bull-Bear Indicator for U.S. Equities (comparative measurements over a rolling one-year timeframe), we remain in Cyclical Bull territory.
- Counting-up of the number of all our indicators that are ‘Up’ for U.S. Equities, the current tally is that four of four are Positive, representing a multitude of timeframes (two that can be solely days/weeks, or months+ at a time; another, a quarter at a time; and lastly, the {typically} years-long reading, that being the Cyclical Bull or Bear status).
The Week Ahead:
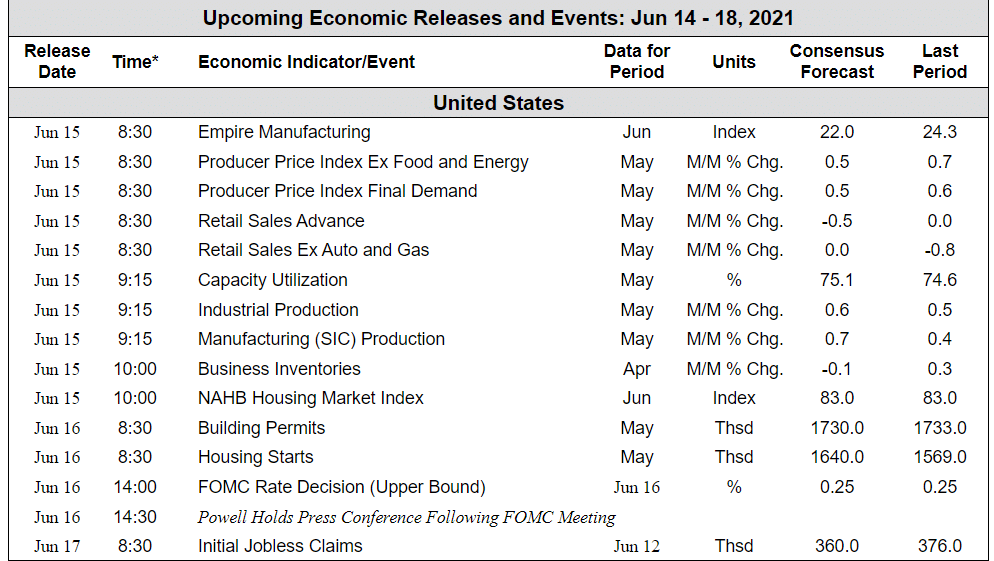
Source: Bloomberg, TD Economics
(Sources: All index- and returns-data from Yahoo Finance; news from Reuters, Barron’s, Wall St. Journal, Bloomberg.com, ft.com, guggenheimpartners.com, zerohedge.com, ritholtz.com, markit.com, financialpost.com, Eurostat, Statistics Canada, Yahoo! Finance, stocksandnews.com, marketwatch.com, wantchinatimes.com, BBC, 361capital.com, pensionpartners.com, cnbc.com, FactSet.)
[/fusion_text][/fusion_builder_column][/fusion_builder_row][/fusion_builder_container]


