Market Recap
U.S. Markets:
U.S. stocks posted solid gains for the week as the technology sector (the largest segment of the S&P 500 Index) rallied, helped by strength in Apple due to the expected announcement of a new video streaming service. 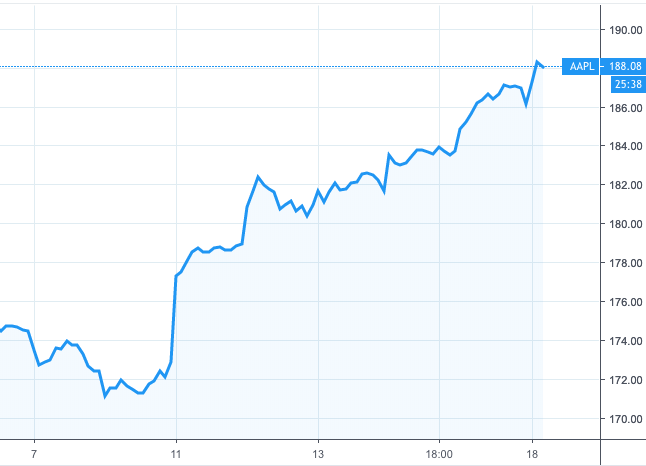
Apple
The Dow Jones Industrial Average surged 398 points to 25,848, a gain of 1.6%. The technology-heavy NASDAQ Composite rallied 280 points, or 3.8%, to close at 7,688.
By market cap, the large cap S&P 500 outperformed the smaller cap benchmarks by rising 2.9%, while the S&P 400 mid cap index and small cap Russell 2000 gained a lesser 1.9% and 2.1%, respectively.
International Markets :
Canada’s TSX rebounded 0.9%, while the United Kingdom’s FTSE 100 gained 1.7%. Major markets were also green across Europe’s mainland.
France’s CAC 40 rose 3.3%, Germany’s DAX added 2.0% and Italy’s Milan FTSE gained 2.7%.
Markets were also up nicely in Asia. China’s Shanghai Composite rose 1.7% and Japan’s Nikkei gained 2.0%. As grouped by Morgan Stanley Capital International, developed markets rose 2.8%, while emerging markets surged 3.5%.
Commodities:
The precious metal Gold also managed a slight gain amidst the broad-based strength in equities. Gold added $3.60, ending the week at $1302.90 an ounce, a gain of 0.3%.
Silver retreated slightly, falling -0.2% to $15.32 an ounce. Energy continued to rebound as West Texas Intermediate crude oil rallied 4.4% to $58.52 per barrel.
The industrial metal copper, seen as an indicator of global economic health due to its wide variety of industrial uses, finished the week up 0.4%.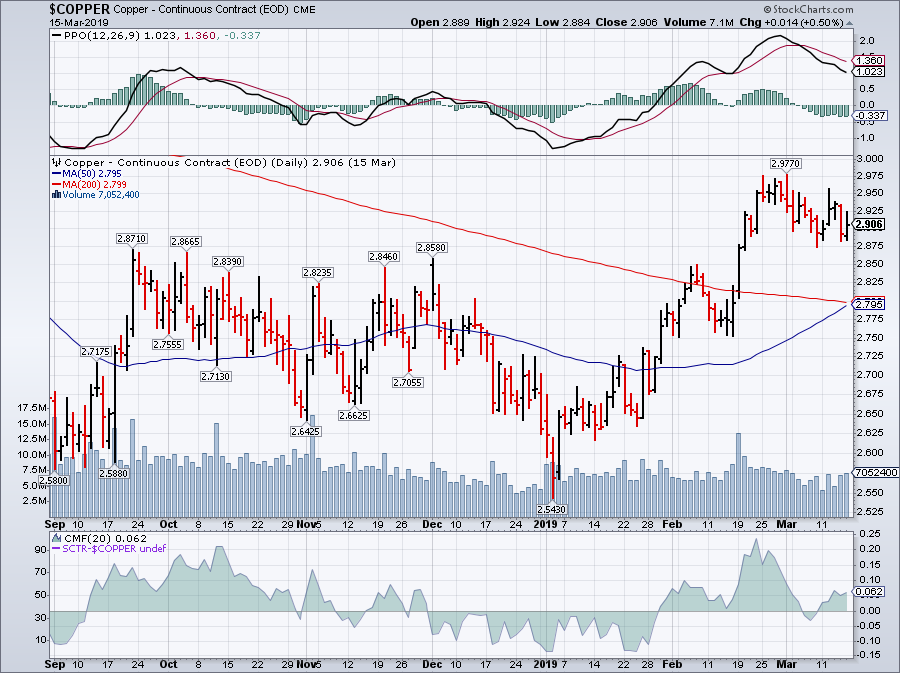
U.S. Economic News
The number of Americans seeking new unemployment benefits rose to a one-month high last week, but the overall level of layoffs remained near historically low levels. The Labor Department reported that initial jobless claims rose by 6,000 to 229,000 vs expectations of a reading of 225,000.
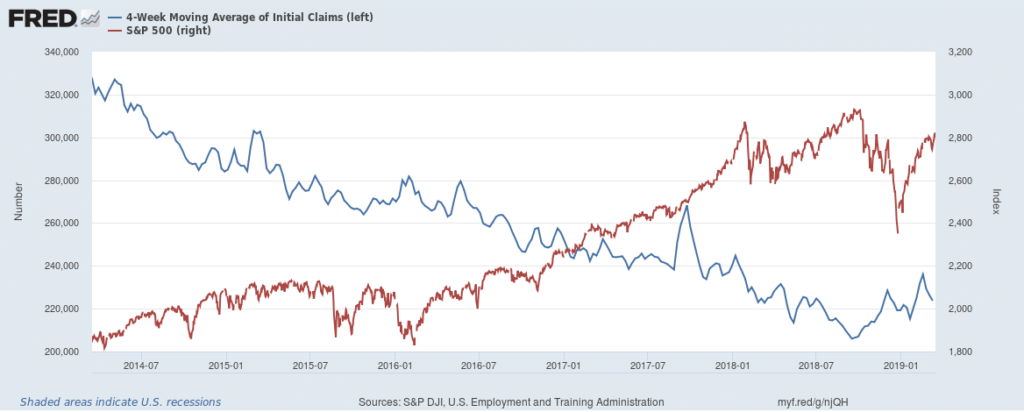
The monthly average of new claims, smoothed to iron-out the weekly volatility, fell by 2,500 to 223,750. Layoffs have risen slightly since hitting a 50-year low last fall, but they still remain far below the 300,000 threshold analysts use to gauge a “healthy” labor market. Continuing claims, which counts the number of people already receiving benefits, increased by 18,000 to 1.77 million.
The Labor Department’s JOLTS (Job Openings and Labor Turnover Survey) report revealed the number of jobs available climbed to their third-highest level on record in January, a sign that companies are still eager to add new employees even within a tight labor market. The number of job openings increased 100,000 from December to 7.58 million, with big increases in wholesale trade, real estate, and information industries.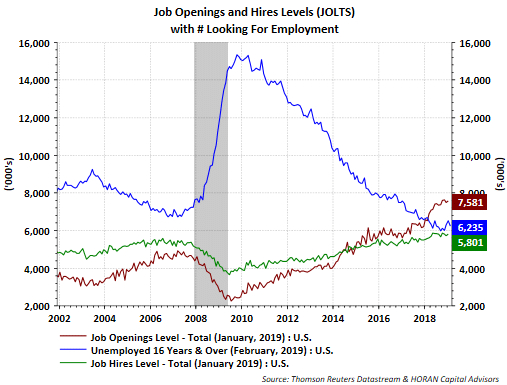
The 7.58 million job openings compares to the 6.54 million people in January who were unemployed, taking the ratio of open positions to those who seek them down slightly to 1.16 from 1.19 in December. The quits rate, rumored to be closely watched by the Federal Reserve for the “robustness” of the labor market, stayed at 2.3%, which is close to the 2.4% high this cycle.
Worker willingness to quit is taken as a positive sign by economists, as it usually means the quitters see better opportunities for higher pay and advancement elsewhere and don’t fear temporary unemployment while between jobs.
The housing market got off to a slow start this year as new home sales dropped 7% in January, the Commerce Department reported. In a report delayed by the partial government shutdown, sales of single-family new homes declined to a 607,000 annual rate, missing forecasts of a 616,000 annual rate. However, the decline wasn’t as bad as the headline indicated once upward revisions for December and November were taken into account. In the details, sales fell in every region except the West. 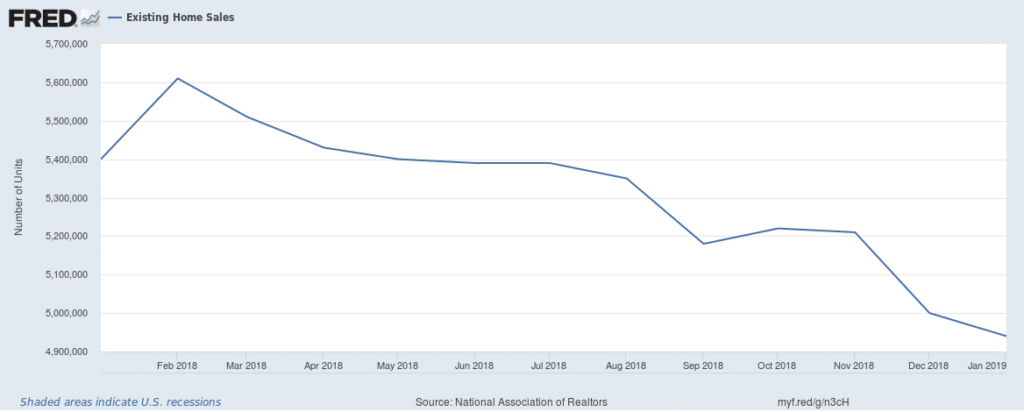
New home sales were 4.1% lower in January compared to the same time last year. In addition, the median sales price of new homes fell again to $317,200. Prices were 3.8% lower versus one year ago, reflecting a decline in demand. At the current pace of sales, there is a 6.6 months’ supply of homes available on the market—slightly higher than what is generally considered a “balanced” housing market.
After the biggest decline in 10 years, sales at U.S. retailers rebounded in January. The Commerce Department reported retail sales rose 0.2% at the beginning of the year, led by home centers and internet stores. Economists had expected only a 0.1% increase.
Sales had tumbled 1.6% in December, the largest drop since late 2009. Omitting auto and gasoline sales, retail sales were up a much more robust 1.2%. Restaurants, pharmacies, grocers, and stores that sell sporting goods and hobby items also reported strong sales.
While the rebound in sales was mildly encouraging, some analysts were concerned the rebound wasn’t enough. Katherine Judge, economist at CIBC World Markets noted, “What went down did come back up again, just not far enough.”
Optimism among the nation’s small business owners inched higher last month, but remained near its lowest levels since the 2016 presidential election. The National Federation of Independent Business (NFIB) said its small-business optimism index rose 0.5 point to 101.7 – up, but still the second-worst reading since December 2016. 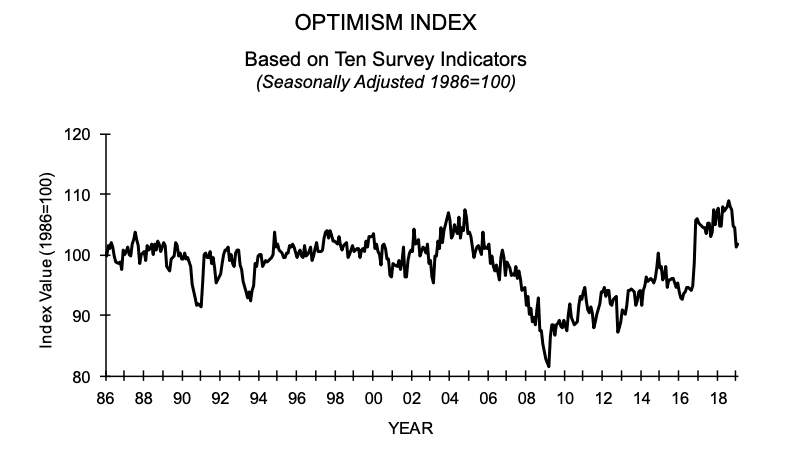
Source: NFIB Research Foundation
In the details, 5 out of the 10 components increased, with the sub-index “expect the economy to improve” leading with a 5-point increase. NFIB President and CEO Juanita Duggan said in its release, “Small business owners are thankful to have the government shutdown in the rearview mirror but need more certainty about the future.”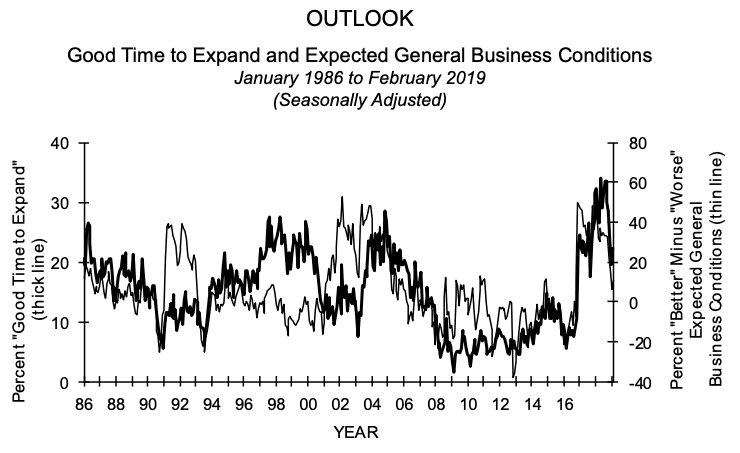
Orders for goods expected to last at least 3 years (a.k.a. durable goods) rose at the beginning of the year for the third consecutive month. The Commerce Department reported orders for long-lasting durable goods rose 0.4% in January, its biggest increase since last summer. Economists surveyed had forecast a 0.1% decline. Ex-transportation, orders dipped 0.1% due to a decline in orders for new cars and trucks.
Core orders, a key measure of business investment, rose 0.8% in January marking its biggest increase since last July and reversing a decline that had seen investment fall five out of the last six months. Economist Andrew Hollenhorst at Citibank is confident that investment spending will pick up in 2019, noting “The bounce in January capital goods orders and shipments is consistent with our view that strong investment spending will continue into 2019.”
Inflation at the consumer level picked up in February, but not enough to raise concern according to analysts. Costs rose for rent, food, gasoline, and clothing last month, their biggest inflation in four months. However, the overall cost of living rose more slowly.
The Bureau of Labor Statistics reported the Consumer Price Index climbed 0.2% in February following three consecutive months of flat readings. The reading matched economists’ forecasts. Over the past year the increase in the cost of living slowed from 1.6% to 1.5%. The rate of inflation has pulled back substantially after hitting a high of almost 3% last summer.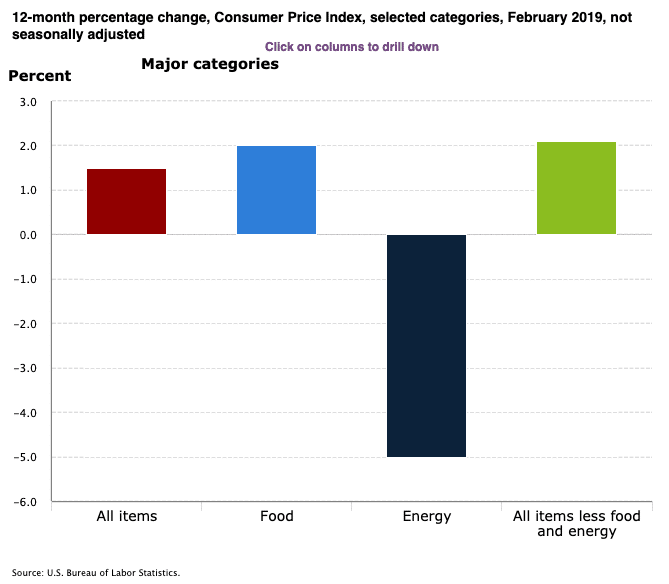
Core inflation, which strips out the volatile food and energy components, ticked up a lesser 0.1% last month—its smallest advance since last summer. The annual increase in the so-called core rate also slowed a tick down to 2.1%.
International Economic News: Credit-rating agency Moody’s Investor Service released a report stating the percentage of money that Canadian consumers owe relative to their disposable income may have leveled off last year, but the amount borrowed and how it was borrowed continue to raise concerns. “Canadian consumers continue to repay their debts, but remain highly vulnerable to an employment shock, posing significant asset risk to banks in an adverse economic scenario,” the report stated.
The level of Canadian consumer debt that’s outstanding “stabilized” at 174% of disposable income in the last three months of 2018. Furthermore, unemployment is hovering near a 40-year low at 5.8%, helping to keep borrowers from defaulting on their loans. However, the credit-rating agency notes that higher interest rates helped increase the amount of that disposable income going towards paying down debt, hiking it to 14.5% in the fourth quarter of 2018 from 13.7% in 2013.
Across the Atlantic, the United Kingdom economy rebounded at a stronger-than-expected pace in January, following a weak end to 2018. The UK’s Office for National Statistics reported Gross Domestic Product grew by 0.5%, its biggest monthly gain in more than two years after it fell -0.4% in December. Analysts note the monthly figures can be volatile and economists don’t see broad improvement in the economy until there’s clarity on Brexit.
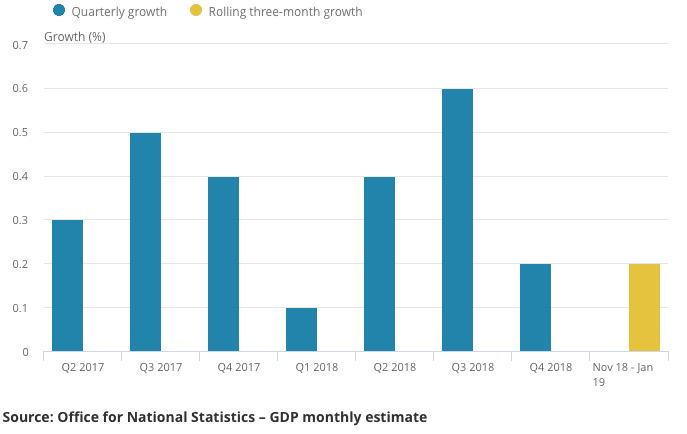
Bloomberg economist Dan Hanson noted, “We expect growth to remain subdued until the outcome of Brexit is known. If a deal is agreed that should spur growth, though it’s unlikely the Bank of England will move until it sees evidence of a rebound in the data.” The rebound in GDP was broad based, with construction, manufacturing and the services sectors all increasing output following declines in December.
The Bank of France said the French economy will grow marginally slower this year than previously expected, but greater household purchasing power should help limit the impact of a global slowdown. The Bank of France forecast growth of 1.4% this year in its quarterly economic outlook—slightly less than the 1.5% predicted in December.
The French economy grew 1.5% in 2018. At the rate forecast by the central bank, France will easily outperform its more export-dependent neighbor Germany, where the government and private institutes expect growth of 1% or lower due to weakening foreign demand. Economists note that since France is more dependent on consumer spending at home, its economy stands to benefit from the 10 billion euro ($11.3 billion USD) package of concessions the government made to “yellow vest” protesters intended to boost spending power.
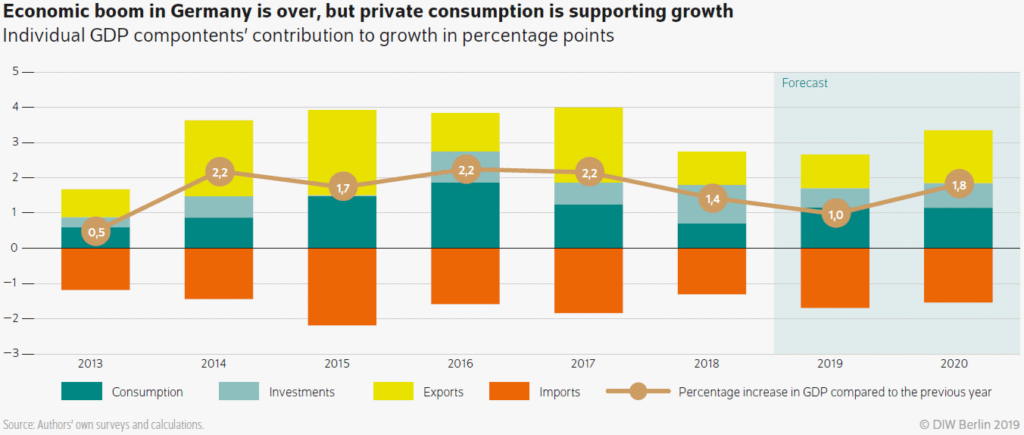
The Munich-based Institute for Economic Research (DIW) revised downward its forecast for economic growth in Germany for 2019 to just 0.6%, down from 1.1%. According to its report, should the international economy continue to lose momentum, global demand for German products would be weak. Ifo Economic Director Timo Wollmershaeuser stated, “Industry will largely fail to act as an economic engine in 2019.”
DIW’s Marcel Fratzscher added “The German economy is cooling down, but this is not the end of the world. We should not paint too black a picture, because the labor market, in particular, continues to look excellent and private consumption is also strong.”
Concerns are growing over China’s slowing economy as the average price of a new home grew by just 0.5% in February, the slowest pace in 10 months. That reading compares to a 0.6% gain in January and was its lowest rate since April 2018. On an annual basis, home prices were up 10.4% in February, accelerating from a 10.0% gain in January.
Consumer and business confidence has slipped over recent quarters as China’s economy slows and trade tensions with the United States continue to rise. The drop in confidence has weighed on residential real estate investment.
The Bank of Japan (BOJ) is now less optimistic about the world’s third-largest economy and kept its ultra-loose monetary policy in place after a two-day policy meeting. The bank said heightened overseas risk could threaten to derail the nation’s fragile economic recovery. “Exports have shown some weaknesses recently,” the central bank said in a statement on its policy decision, offering a bleaker view than in January when it said they were increasing as a trend.
The BOJ maintained a pledge to guide short-term interest rates at minus 0.1% and 10-year government bond yields around 0%. The widely expected decision was made by a 7-2 vote. The central bank also stuck to its view that Japan’s economy is expanding moderately, but added a phrase that “exports and output have been affected by slowing overseas growth.” In January, it said only that the economy was expanding moderately.
Current Indicators
NYSE Bullish Percent Index: 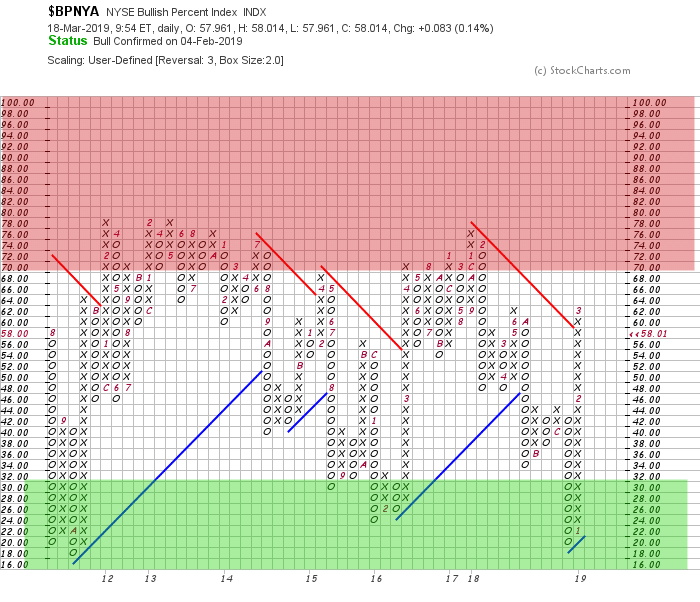
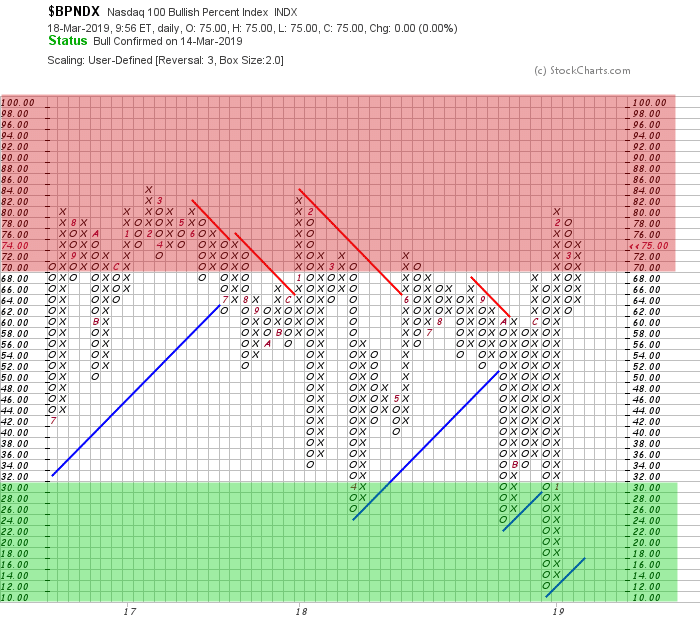
NASDAQ 100 Bullish Percent Index:
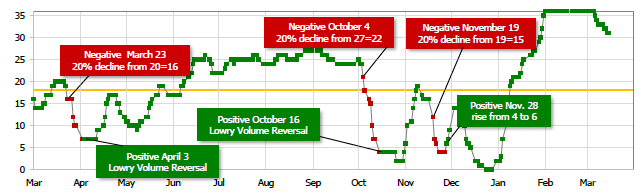
Short Term Trend:
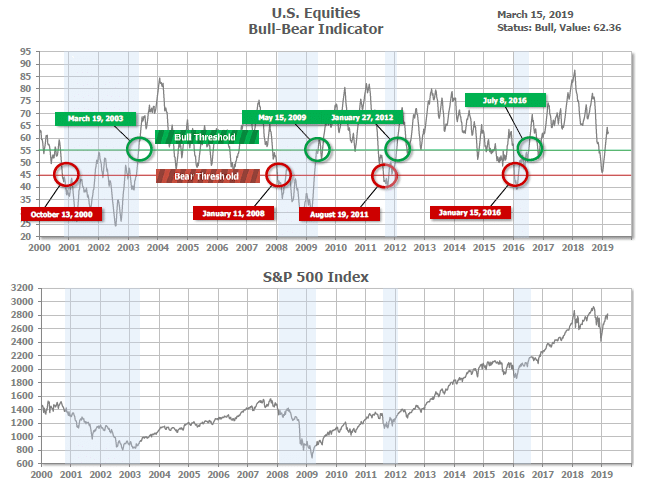
Bull/Bear Market Status:
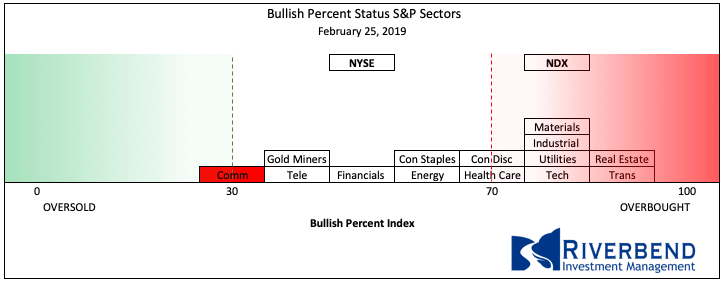
S&P Sector Bullish Percent Index:
The Bullish Percent Index by sector is continuing to show some sectors reversing from overbought status. Below is this week’s reading vs the reading from February 25th. (Boxes highlighted in red are declining).
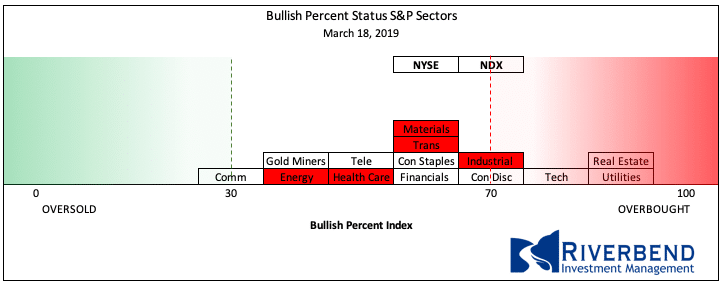
vs February 25th:
SHUT vs DIME
The ranking relationship between the defensive SHUT sectors is one way to gauge institutional investor sentiment in the market.
“S”=Staples [a.k.a. consumer non-cyclical]
“H”=Healthcare
“U”=Utilities and
“T”=Telecom
and the offensive DIME sectors:
“D”=Discretionary [a.k.a. Consumer Cyclical]
“I”=Industrial,
“M”=Materials
“E”=Energy
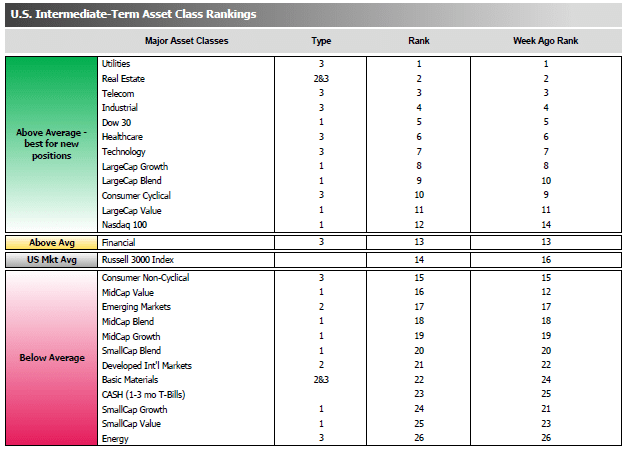
The average ranking of Defensive SHUT sectors and Offensive DIME sectors were, for the third week, virtually unchanged from the prior week. The Defensive SHUT sectors maintained their lead over Offensive DIME sectors.
Note: these are “ranks”, not “scores”, so smaller numbers are higher ranks and larger numbers are lower ranks.
Chart of Interest
Everyone has heard of a “New York Minute.” Johnny Carson said it was that brief instant of time between a Manhattan stoplight turning green and the taxi behind you honking!
How about an “Internet Minute”? An “Internet Minute” is the measure of everything that happens on the internet in the space of a single minute – and it is staggering.
The chart below, from the research blog Visual Capitalist, brings it all together. Visual Capitalist notes that the biggest change from the prior year is a doubling of hours of Netflix streaming per “Internet Minute”!

What’s Happening in Your Portfolio?
(as of 3/18/19)
We are starting to see more volatility in US equities. Sectors that were rising earlier in the year are starting to see profit trading from traders.
The current fear in the market: the US/China trade policy (again).
In the meantime, we are taking a conservative approach in our client portfolios until overbought conditions subside.
If you have any questions, please reach out to me directly at john.rothe@riverbendinvestments.com
(sources: all index return data from Yahoo Finance; Reuters, Barron’s, Wall St Journal, Bloomberg.com, ft.com, guggenheimpartners.com, ritholtz.com, markit.com, financialpost.com, Eurostat, Statistics Canada, Yahoo! Finance, stocksandnews.com, marketwatch.com, wantchinatimes.com, BBC, 361capital.com, pensionpartners.com, cnbc.com, FactSet; Figs 1-5 source W E Sherman & Co, LLC)
© 2019 Riverbend Investment Management, LLC. This presentation is intended for informational purposes only.
The information and statistical data contained herein have been obtained from sources we believe to be reliable but in no way are warranted by us as to accuracy or completeness. The opinions expressed are those of Riverbend Investment Management, LLC. and are subject to change without notice. No part of this presentation may be reproduced in any manner without the written permission of Riverbend Investment Management, LLC. Any securities discussed should not be construed as a recommendation to buy or sell and there is no guarantee that these securities will be held for a client’s account nor should it be assumed that they were or will be profitable. Past performance does not guarantee future comparable results.
Riverbend Investment Management, LLC is a Registered Investment Adviser in Northern VA
ADV II available upon request
Riverbend Investment Management, LLC
1818 Library Street, Suite 500
Reston VA 20190
Tel:703-349-6327
www.riverbendinvestments.com


