Market Recap
U.S. Markets: U.S. stocks finished the week notably higher due to strong rallies on Wednesday and Thursday. In a widely expected move, the Federal Reserve decided to keep rates steady, but investors were cheered by an unexpectedly dovish post-meeting statement.
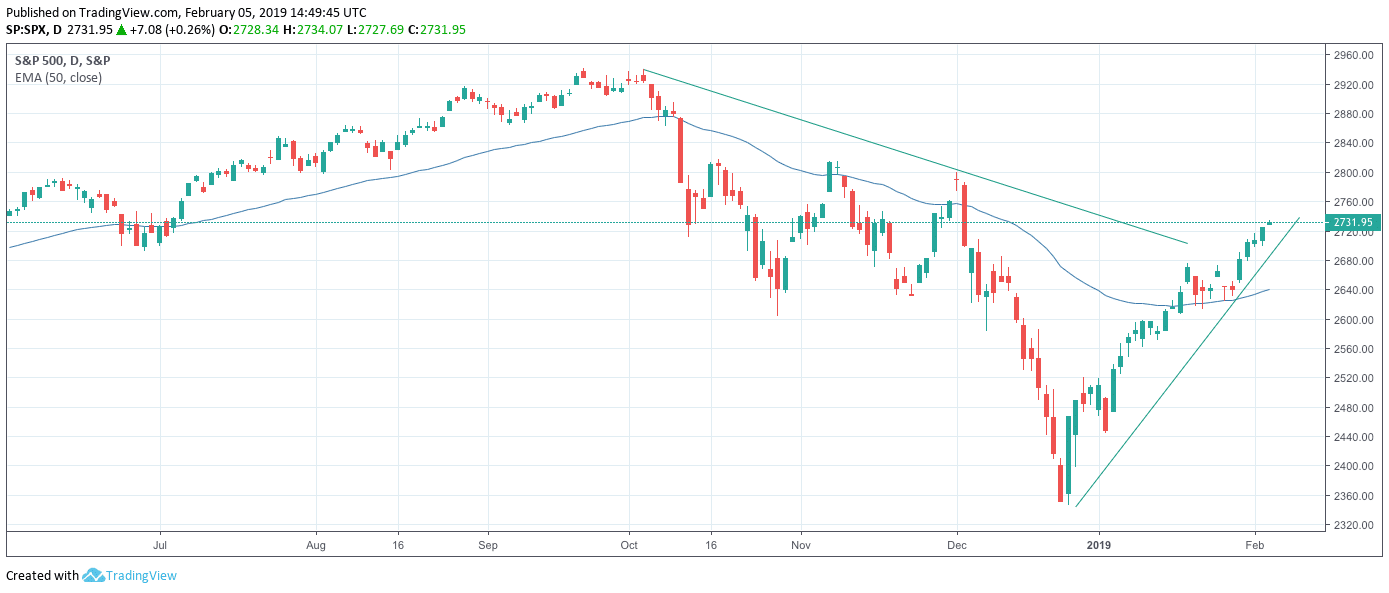
The Dow Jones Industrial Average rose 326 points to close at 25,063—a gain of 1.3%. The technology-heavy NASDAQ Composite added 1.4% finishing the week at 7,263. By market cap, the large cap S&P 500 rose 1.6%, while the mid cap S&P 400 and small cap Russell 2000 each rose 1.3%.
International Markets: Canada’s TSX rose 0.9% for the week. Across the Atlantic, the United Kingdom’s FTSE retraced last week’s entire decline by finishing up 3.1%. On Europe’s mainland, however, major markets were mixed. France’s CAC 40 rose 1.9%, while Germany’s DAX ended down -0.9%.
In Asia, China’s Shanghai Composite added 0.6% and Japan’s Nikkei ticked up 0.1%. As grouped by Morgan Stanley Capital International, emerging markets rose 1.3%, while developed markets gained 0.8%.
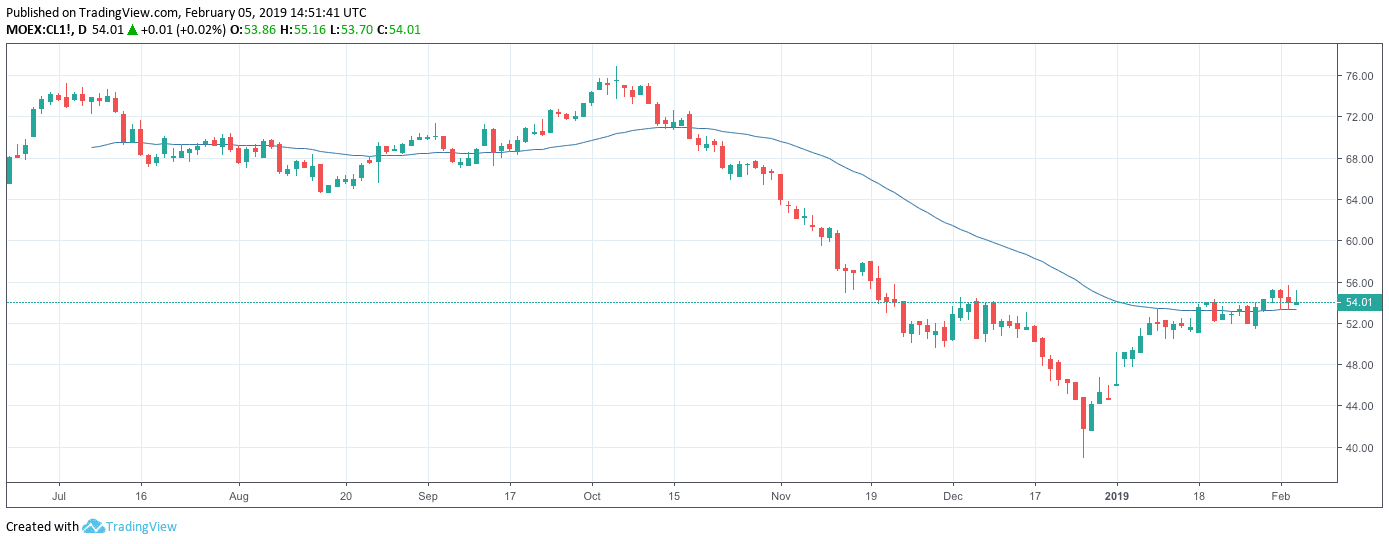
Commodities: Precious metals had their second week of good gains as gold rose 1.9%, closing at $1322.10 an ounce. Silver rose 1.5% and finished the week at $15.93 per ounce. Crude oil resumed its rally after taking a break last week. Crude oil finished up 2.9% at $55.26 per barrel for West Texas Intermediate crude. The industrial metal copper, seen as a gauge of world economic health due to its variety of uses, rose 1.6%.
January Summary: For the month of January, the Dow Jones Industrial Average and NASDAQ Composite smartly rose by 7.2% and 9.7% respectively. Smaller cap indexes outperformed their large cap peers as the S&P 400 and Russell 2000 shot up 10.4% and 11.2%, while the large cap S&P 500 gained a lesser but still robust 7.9%.
Canada’s TSX surged 8.5%, but outside of North America major market gains were less robust. The United Kingdom’s FTSE rose 3.6%. France’s CAC 40 and Germany’s DAX added 5.5% and 5.8%, respectively. China’s Shanghai Composite rose 3.6% and Japan’s Nikkei gained 3.8%. Developed markets rebounded 6.6%, while emerging markets surged 10.3%.
Gold and silver each gained 3.4%, while copper added 2.9%. However, the big story in commodities was in energy, where oil rallied 18.5%.
U.S. Economic News
Initial claims for new unemployment benefits surged by 53,000 last week to 253,000, far above the consensus of a 16,000 increase. It was the biggest jump and to the highest level since September 2017. The number was likely influenced by filings from federal contractors and others impacted by the government shutdown. If this is the case, then initial claims should subside in the coming weeks. The four-week average of claims, used to reduce the short-term volatility, rose by 5,000 to 220,250. Thatnumber remains close to multi-decade lows and is consistent with tight labor market conditions.
Unemployment Rate – Bureau of Labor Statistics
The U.S. added 304,000 jobs in January as firms continue to hire at a robust rate despite global headwinds, according to the Bureau of Labor Statistics. The reading was the biggest increase in almost a year and blew away expectations for a modest gain of 172,000 nonfarm jobs. The economy has added an average of 241,000 jobs a month over the last three months, one of its best stretches in the nearly 10-year old economic expansion. Meanwhile, the unemployment rate ticked up to 4%. The Labor Department said the government shutdown did contribute to the higher jobless rate, but it had “no discernable impacts” on the surge in hiring last month.
The private sector added 213,000 new jobs in January according to payrolls-processor ADP. The reading soared past consensus expectations for a gain of 183,000. Goods-producing payrolls jumped by 68,000, the most in nearly a year and manufacturing added over 33,000 new jobs matching its biggest increase since March of 2012. Services industries added 145,000 new positions with notable gains in professional and business services, health care, and leisure and hospitality. By size, big companies added 66,000 new jobs, mid-size filled 84,000 new positions, and small businesses increased employment by 63,000.
Existing home prices continued to moderate, according to the S&P CoreLogic Case-Shiller National Home Price Index. The 20-city index rose a seasonally-adjusted 0.3% in November and was up 4.7% compared to the same time last year. However, that reading missed estimates for a 4.9% yearly increase and was the slowest pace of annual growth since January of 2015. In November, the metro areas with the biggest annual gains were Las Vegas, Phoenix, and Seattle, however on a monthly basis some of the biggest losers were cities where prices had surged—Denver, San Francisco, and also Seattle. David Blitzer, chairman of the Index Committee at S&P Dow Jones noted “higher prices and increased mortgage rates” were weighing on home prices.
Pending home sales, which measures housing activity in which a contract has been signed but not yet closed, fell 2.2% in December and is down 9.8% from the same time last year. The National Association of Realtors (NAR) noted that higher mortgage rates in the last months of 2018, high prices, and low affordability, all weighed on contract signings. However, as mortgage rates have now backed down, the NAR notes realtors are “confident that the housing market will see improvement in 2019.” Indeed, the conventional mortgage rate is now back below 4.5%, down from nearly 5% in November.
A broad measure of the U.S. economy, the Chicago Fed’s National Activity Index (CFNAI), was up slightly in December, but overall fourth quarter activity was notably weaker than the third.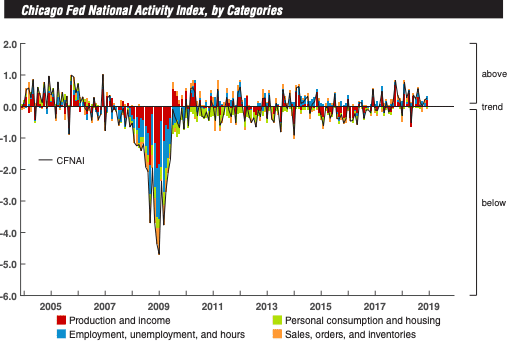
The CFNAI ticked up 0.06 points in December to 0.27, but the volatile nature of the monthly data puts emphasis on the index’s three-month average. The CFNAI’s three-month average increased 0.04 point to 0.16 in the final quarter of 2018, but that was down significantly from the Q3 average of 0.31. Factory-activity and employment-related indicators were responsible for much of the gain. The Chicago Fed index is a weighted average of 85 economic indicators, designed so that zero represents trend growth and a three-month average above 0.70 suggests an increasing likelihood of a period of sustained increasing inflation. Forty-six of the 85 individual indicators made positive contributions in December, while 39 made negative contributions.
Confidence among the nation’s consumers continued to decline last month amid increased financial market volatility and the government shutdown. The Consumer Confidence Index fell 6.4 points to
120.2—its third consecutive decline and its lowest level since July of 2017. Expectations were for only a 4.1 point decline. While consumers’ attitudes towards their present situation remained steady, their expectations of the future plunged 10.4 points to 87.3—its lowest reading since October of 2016.
![]()
In addition, the outlook for business conditions was its weakest since November of 2013. However, with the shutdown now over and equity prices recovering many analysts expect confidence to rebound next month. Lynn Franco, director of economic indicators at the Conference Board observed, “Shock events such as government shutdowns tend to have sharp, but temporary, impacts on consumer confidence.”
Federal Reserve Chairman Jerome Powell thrilled markets this week when he said the case for higher interest rates “has weakened” because of muted inflation and somewhat slower economic growth and stressed that the central bank will be “patient” before determining its next move. The Fed also indicated it’s willing to adjust the size and scale of its balance-sheet runoff, and perhaps end it altogether.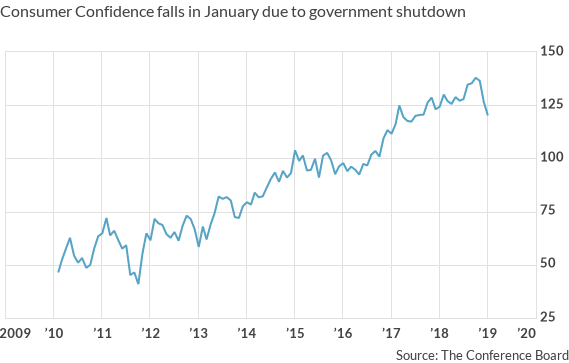
In a unanimous 10-0 vote, senior Fed officials left the key U.S. Fed Funds interest rate, unchanged stating that the current level of interest rates is “appropriate for the state of the economy”. The central bank also backed away from prior pledges for “further gradual increases” in interest rates — the first time since 2015 that the Fed’s statement has not included such language.
Current Indicators
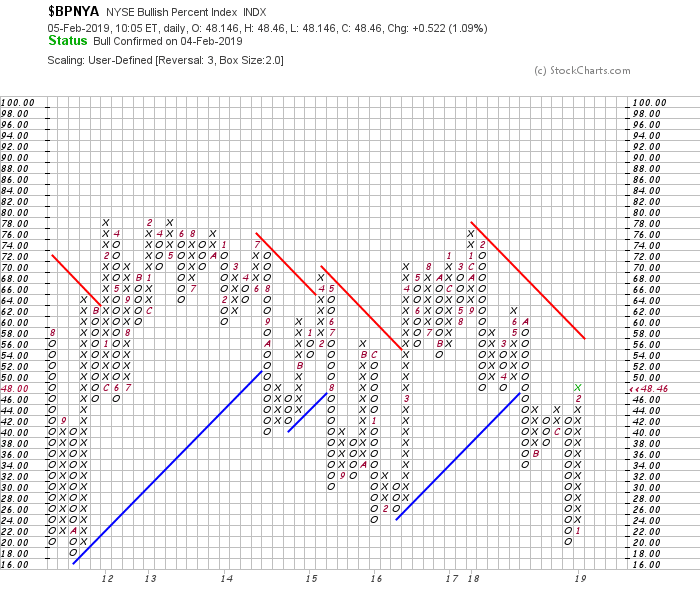
NYSE Bullish Percent Index:
Short Term Trend: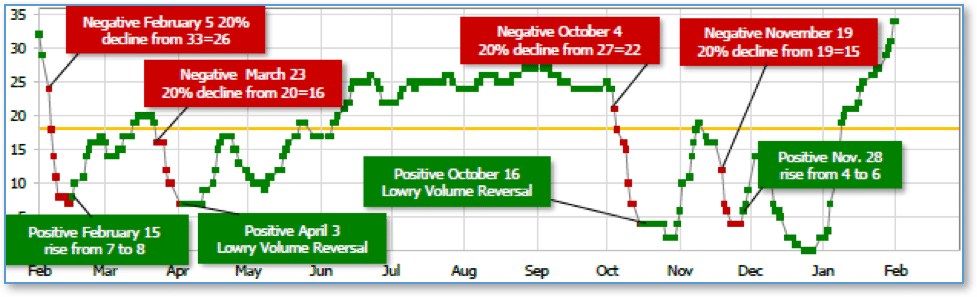
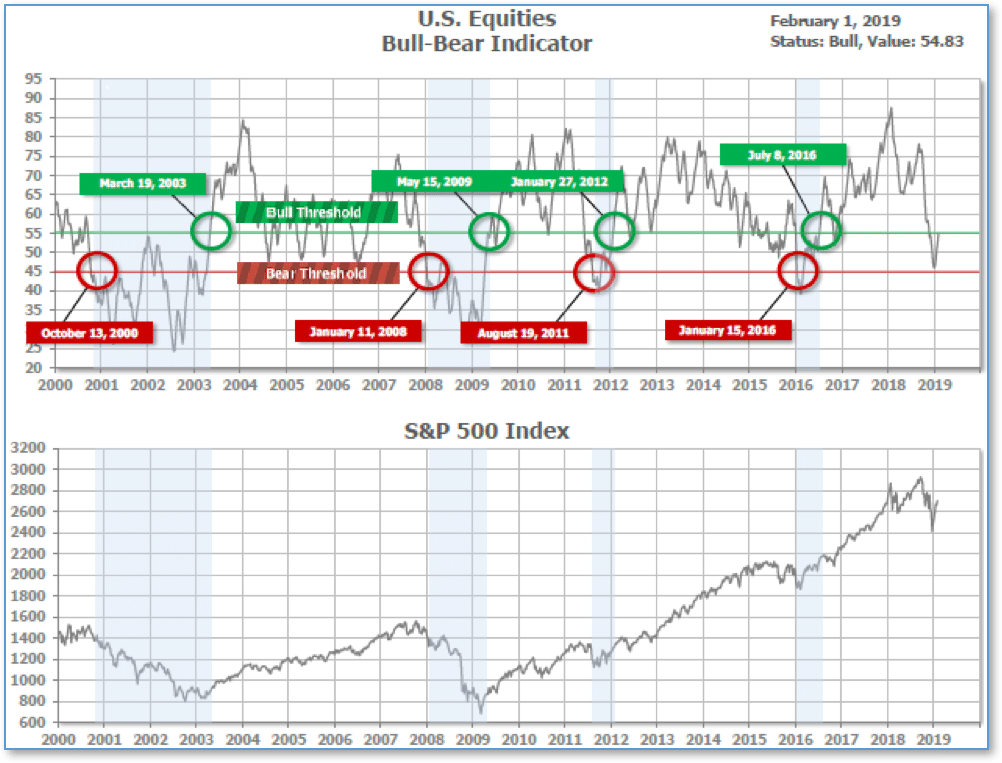
Bull/Bear Market Status
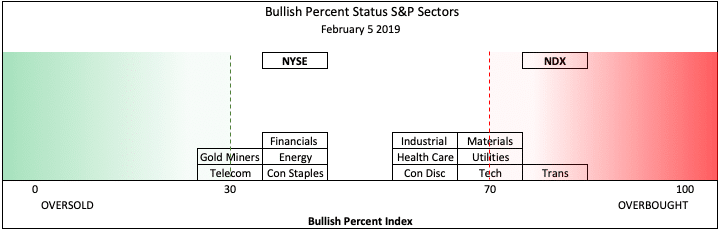
S&P Sector Bullish Percent Index:
SHUT vs DIME
The ranking relationship between the defensive SHUT sectors is one way to gauge institutional investor sentiment in the market.
“S”=Staples [a.k.a. consumer non-cyclical]
“H”=Healthcare
“U”=Utilities and
“T”=Telecom
and the offensive DIME sectors:
“D”=Discretionary [a.k.a. Consumer Cyclical]
“I”=Industrial,
“M”=Materials
“E”=Energy
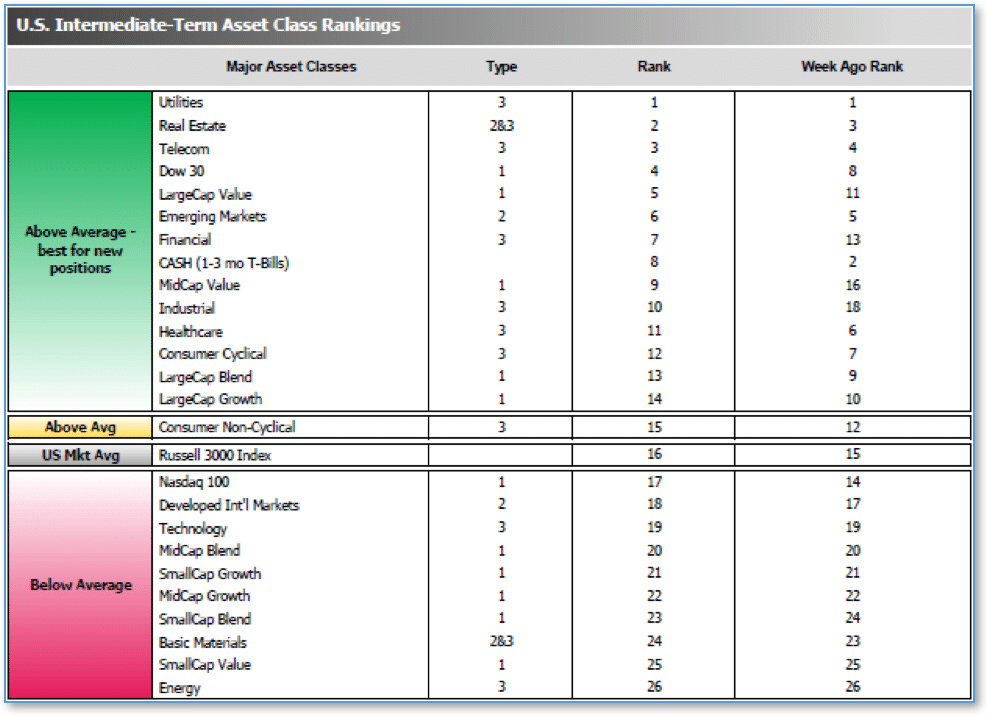
The average ranking of Defensive SHUT sectors fell to 7.50 from the prior week’s 5.75, while the average ranking of Offensive DIME sectors rose to 18.00 from last week’s 18.50. The Defensive SHUT sectors lost a bit of their lead over Offensive DIME sectors.
Note: these are “ranks”, not “scores”, so smaller numbers are higher ranks and larger numbers are lower ranks.
Chart of Interest
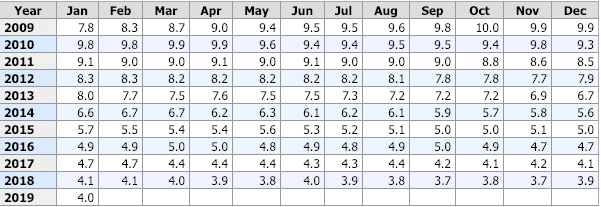
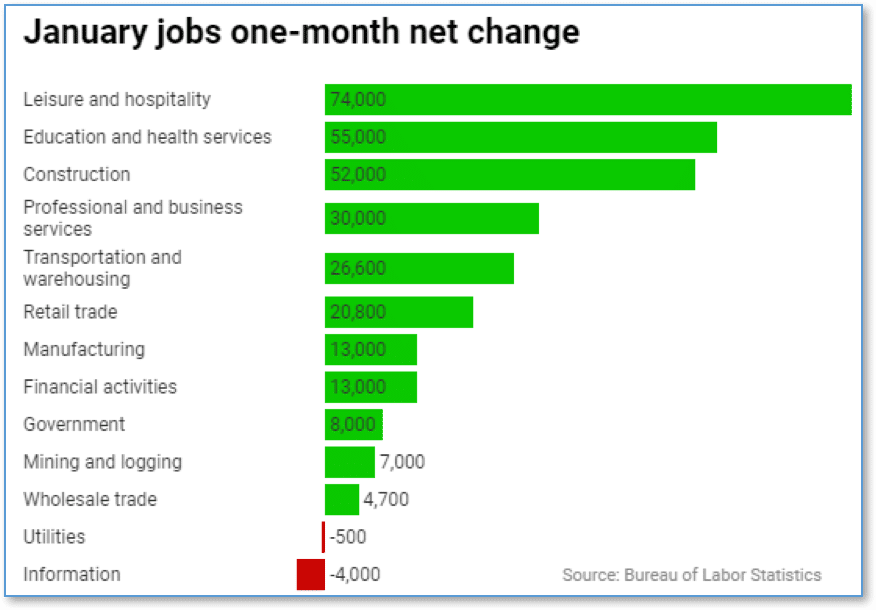
We’ve all heard and seen the advice given to young (and not so young) job-seekers: “Learn to code – that’s where the jobs are!” Coding (or, to use the more traditional term, “programming”) jobs in particular, and all “IT” jobs in general were supposed to be plentiful and going begging for qualified candidates.
Except a funny thing has happened on the way to employment nirvana. Several months in the last year and now two months in a row, the “Information” industry segment has actually shrunk its employment while nearly all other industries are adding.
January’s “blowout” and “beyond all expectations” jobs number had one loser in it: a loss of 4,000 jobs in the “Information” industry.
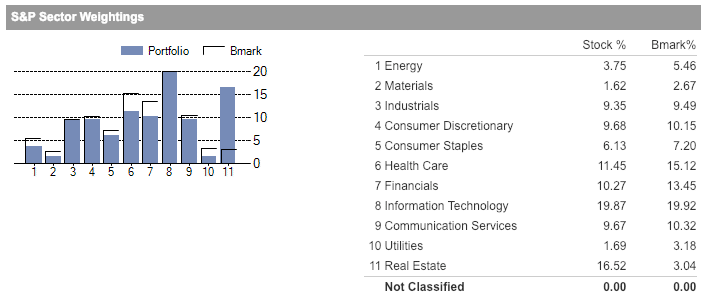
Riverbend Model Portfolio Allocation:
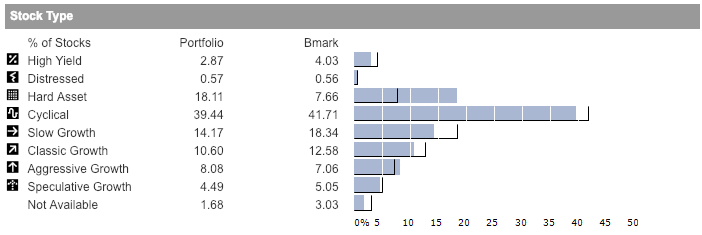 Source: Morningstar
(sources: all index return data from Yahoo Finance; Reuters, Barron’s, Wall St Journal, Bloomberg.com, ft.com, guggenheimpartners.com, ritholtz.com, markit.com, financialpost.com, Eurostat, Statistics Canada, Yahoo! Finance, stocksandnews.com, marketwatch.com, wantchinatimes.com, BBC, 361capital.com, pensionpartners.com, cnbc.com, FactSet; Figs 1-5 source W E Sherman & Co, LLC)
© 2019 Riverbend Investment Management, LLC. This presentation is intended for informational purposes only.
The information and statistical data contained herein have been obtained from sources we believe to be reliable but in no way are warranted by us as to accuracy or completeness. The opinions expressed are those of Riverbend Investment Management, LLC. and are subject to change without notice. No part of this presentation may be reproduced in any manner without the written permission of Riverbend Investment Management, LLC. Any securities discussed should not be construed as a recommendation to buy or sell and there is no guarantee that these securities will be held for a client’s account nor should it be assumed that they were or will be profitable. Past performance does not guarantee future comparable results.
Riverbend Investment Management, LLC is a Registered Investment Adviser
ADV II available upon request
Riverbend Investment Management, LLC
1818 Library Street, Suite 500
Reston VA 20190
Tel:703-349-6327
www.riverbendinvestments.com


